

Abstract
Arterial blood gas is an important routine investigation to monitor the acid-base balance of patients, effectiveness of gas exchange, and the state of their voluntary respiratory control. Majority of the oral and maxillofacial surgeons find it difficult to interpret and clinically correlate the arterial blood gas report in their everyday practice. This has led to underutilization of this simple tool. The present article aims to simplify arterial blood gas analysis for a rapid and easy bedside interpretation. In context of oral and maxillofacial surgery, arterial blood gas analysis plays a vital role in the monitoring of postoperative patients, patients receiving oxygen therapy, those on intensive support, or with maxillofacial trauma with significant blood loss, sepsis, and comorbid conditions like diabetes, kidney disorders, Cardiovascular system (CVS) conditions, and so on. The value of this analysis is limited by the understanding of the basic physiology and ability of the surgeon to interpret the report. Using a systematic and logical approach by using these steps would make the interpretation simple and easy to use for oral and maxillofacial surgeons.
Keywords: Acidosis, alkalosis, blood gas analysis
INTRODUCTION
Arterial blood gas analysis is an important routine investigation to monitor the acid-base balance of patients, effectiveness of gas exchange, and the state of their voluntary respiratory control.[1]
In context of oral and maxillofacial surgery, arterial blood gas analysis plays a vital role in monitoring of postoperative patients, patients receiving oxygen therapy, those on intensive support, or with maxillofacial trauma with significant blood loss, sepsis, and comorbid conditions like diabetes, kidney disorders, Cardiovascular system (CVS) conditions, and so on.
Considering the spectrum of its uses, this useful and simple tool has been underutilized, most frequently due to the difficulty in proper understanding, interpretation, and application in management.
This article aims to simplify the arterial blood gas analysis for a rapid and easy bedside interpretation for oral and maxillofacial surgeons.
The basic physiology
Our body functions in a relatively narrow alkaline environment (pH: 7.35-7.45). Maintenance of normal physiologic function is closely related to the maintenance of pH within this range.[2]
The two main mechanisms for this balance are respiratory and metabolic.[2]
The normal blood pH range is 7.35-7.45.
If pH <7.35, the blood is said to be acidic.
If pH >7.45, the blood is said to be alkalotic.
The respiratory buffer response
Carbon dioxide (CO2) is a normal by-product of cellular metabolism. CO2 is carried in blood to the lungs, which removes the same by controlling breathing. So, partial pressure of CO2 in arterial blood (paCO2) is determined by alveolar ventilation.
The excess CO2 combines with water to form carbonic acid. The blood pH changes according to the amount of this acid in the body and so does the depth and rate of ventilation. Hence CO2 is looked upon as a respiratory acid.[3]
As blood pH decreases (acidosis), CO2 is exhaled (alkalosis as compensation).
As blood pH increases (alkalosis), CO2 is retained (acidosis as compensation).
The respiratory response is fast and activated within minutes.[3]
The renal buffer response
The kidneys secrete Hydrogen ion (H+) and reabsorbs bicarbonate. This is adjusted by the kidneys in response to metabolic acid formation.
Bicarbonate is a metabolic component and considered a base.
As blood pH decreases (acidosis), the body retains bicarbonate (a base).
As blood pH rises (alkalosis), the body excretes bicarbonate (a base) in urine.
This compensation is slow and takes hours to days to get activated.[3]
The acid-base control
The pH is dependent on the paCO2 /HCO3- (HCO3- : bicarbonate) ratio.
A change in CO2 is thus compensated by a change in HCO3- and vice versa.
The initial change is called the primary disorder (e.g., change in CO2 in this case).
The secondary response is called the compensatory disorder (e.g., change in HCO3- in this case).
Basic facts to remember
CO2 is a respiratory component and considered a respiratory acid. It moves opposite to the direction of pH and is visualized as a see-saw [Figure 1] (as paCO2 in blood increases, pH decreases—respiratory acidosis)
Bicarbonate is a metabolic component and considered a base. It moves in the same direction as pH and is visualized as an elevator [Figure 2] (as bicarbonate in blood increases, pH increases—metabolic alkalosis)
If CO2 and HCO3- move in the same direction, it is considered a primary disorder; for example, if there is respiratory acidosis in body (CO2 retention), the bicarbonate levels increase as a compensation (metabolic alkalosis). The direction of both CO2 and HCO3- are the same in this case
If CO2 and HCO3- move in opposite directions, it is considered a mixed disorder; for example, mixed disorder in the case of salicylate poisoning: Primary respiratory alkalosis due to salicylate-induced hyperventilation and a primary metabolic acidosis due to salicylate toxicity.
Figure 1.
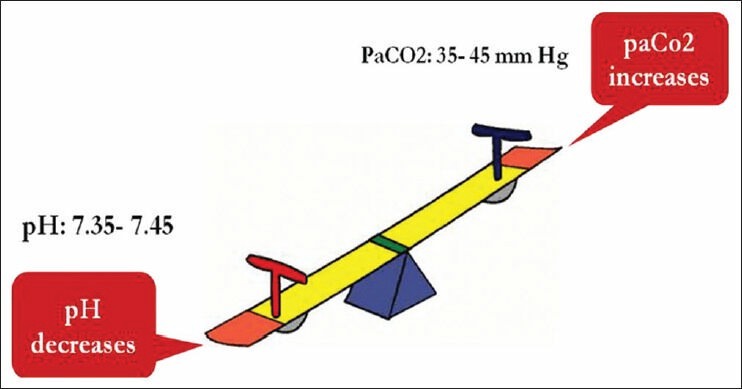
Visualization of pH and paCO2 as a see-saw
Figure 2.
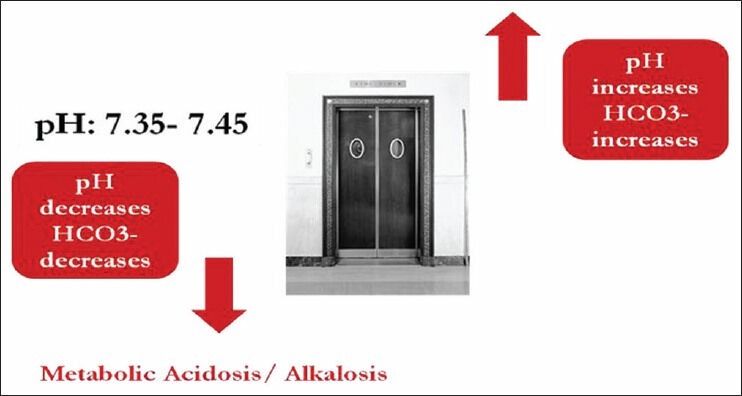
Visualization of pH and bicarbonate as an elevator
Conditions causing acid-base imbalance [Table 1][3]
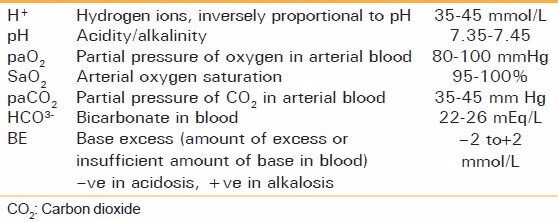
Table 1.
Components and normal values
Respiratory acidosis
It occurs due to any condition causing the accumulation of CO2 in the body.
Central nervous system (CNS) depression due to head injury
Sedation (e.g., narcotics, postoperative, sedation), coma
Chest wall injury, flail chest
Respiratory obstruction/foreign body.
Respiratory alkalosis
It occurs due to decrease in CO2 . Here, hyperventilation occurs and CO2 is washed out causing alkalosis.
Psychological: Anxiety, fear
Pain
Fever, sepsis, pregnancy, severe anemia.
Metabolic acidosis (decrease in HCO3-)
It is caused due to excess of acids or deficit of base.
Increased acids
Lactic acidosis (shock, hemorrhage, sepsis)
Diabetic ketoacidosis
Renal failure
Deficit of base
Severe diarrhoea and intestinal fistulas.
Metabolic alkalosis (excess of HCO3-)
It is caused by excess base or deficit of acids.
Acid Deficit: Prolonged vomiting, nasogastric suction, diuretics
Excess base: Excess consumption of diuretics and antacids, massive blood transfusion (citrate metabolized to bicarbonate).
Why do we order a blood gas analysis?
Aids in establishing diagnosis
Guides treatmentplan
Improvement in the management of acid/base; allows for optimal function of medications
Acid/base status may alter levels of electrolytes critical to the status of a patient.
Limitations of blood gas analysis[4]
The blood gas analysis cannot yield a specific diagnosis. A patient with asthma may have similar values to another patient with pneumonia[4]
The analysis does not reflect the degree to which an abnormality actually affects a patient[4]
Blood gas analysis cannot be used as a screening test for early pulmonary disease.[4]
Arterial versus venous blood gas analysis
It is traditional to draw arterial blood for paO2, paCO2, and pH measurements. It is the best indicator of how well the lungs are oxygenating.[3] However, if the venous sample is obtained, it is recommended that the values be compared and interpreted keeping in consideration the given table [Table 2].
Table 2.
Arterial versus venous blood gas
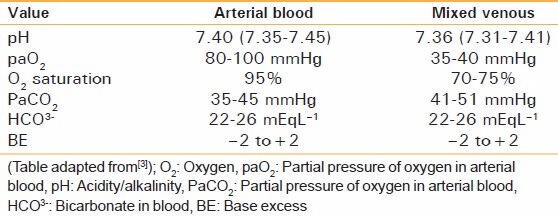
The venous blood gas report can be of significance in hemodynamically[3] unstable patients and should not be discarded.
Obtaining an arterial sample
The order of preference is radial artery > brachial artery >femoral artery.
The radial artery is preferred due to ease of palpation, access, and good collateral supply.[1]
The collateral supply to the hand is confirmed by the modified Allen's test [Figure 3].[5]
Figure 3.
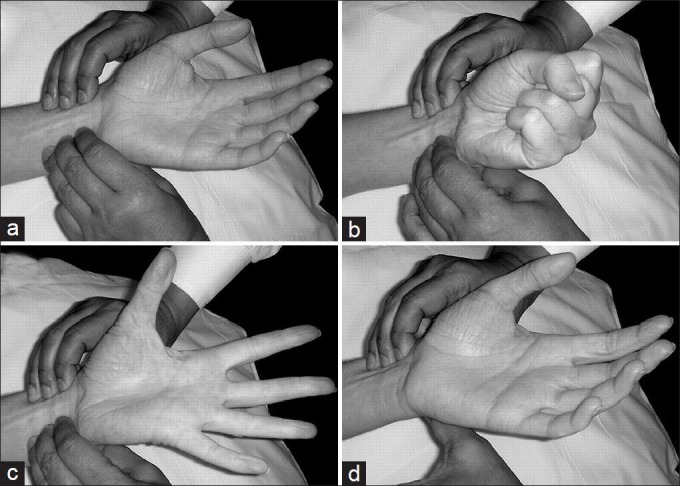
The modified Allen's test]: (a) The radial and ulnar arteries are palpated. (b) The patient clenches the fist and both the arteries are compressed manually. (c) The patient opens the fist (note the blanching of the palm). (d) The ulnar artery pressure is released; if the colour returns to pink, the test is positive; if the colour does not return to pink, the test is negative[6]
Modified Allen's test[5]
Ask the patient to make a tight fist.
Using the middle and index fingers of both hands, apply pressure to the wrist. Compress the radial and ulnar arteries at the same time (never use the thumb to detect the artery).
While maintaining pressure, ask the patient to open the hand slowly. Lower the hand and release pressure on the ulnar artery only.
Positive test: The hand flushes pink or returns to normal color within 15 seconds
Negative test: The hand does not flush pink or return to normal color within 15 seconds, indicating a disruption of blood flow from the ulnar artery to the hand
If the Allen's test is negative, the radial artery should not be used.
Sampling[1]
The arm of the patient is placed palm up on a flat surface, with the wrist dorsiflexed at 45°
The puncture site should be cleaned with alcohol or iodine (allow the alcohol to dry before puncture, as the alcohol can cause arteriospasm), and a local anesthetic (such as 2% lignocaine) should be infiltrated
The radial artery should be palpated for a pulse, and a preheparinised syringe with a 23- or 25-gauge needle should be inserted at an angle just distal to the palpated pulse [Figure 4]
After the puncture, sterile gauze should be placed firmly over the site and direct pressure applied for several minutes to obtain hemostasis.
Figure 4.
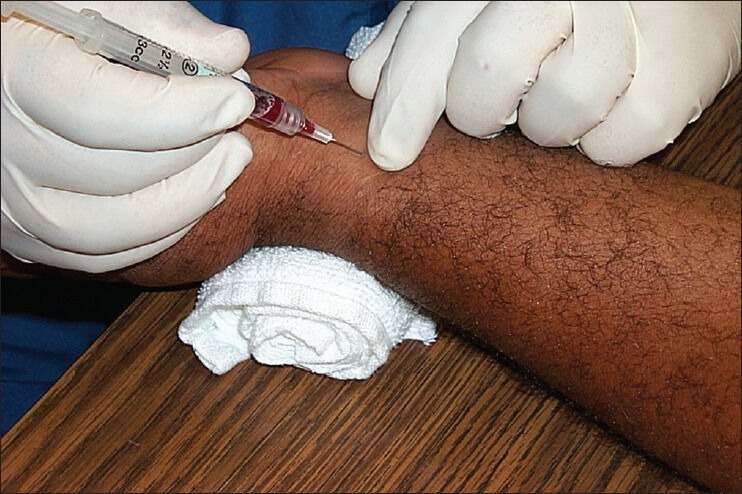
Radial artery sampling
Errors[7]
Allow a steady state after initiation or change in oxygen therapy, before obtaining a sample (in the patients without overt pulmonary disease, a steady state is reached between 3 and 10 minutes[8,9] and in patients with chronic airway obstruction, it takes about 20-30 minutes)[10]
Always note the percentage of inspired air (FiO2) and condition of the patient
Flush the syringe with heparin or use preheparinised syringes. Do not use excess heparin as it causes sample dilution.[4] Excess of heparin may affect the pH. Only 0.05 mL is required to anticoagulate 1 mL of blood. Because dead space volume of a standard 5 mL syringe with 1" 22-gauge needle is 0.02 mL, filling the dead space of the syringe with heparin provides sufficient volume to anticoagulate a 4 mL blood sample[10]
Avoid air bubbles in syringe[4]
Avoid delay in sample processing. As blood is a living tissue, O2 is being consumed and CO2 is produced in the blood sample. The delay may affect the blood gas values. In case of delay, the sample should be placed in ice and such iced samples can be processed for up to two hours without affecting the blood gas values.[10]
Accidental venous sampling. The venous sample report should not be discarded and can provide sufficient information.[7]
Steps of interpretation
Step 1: Anticipate the disorder (keeping in mind the clinical settings and the condition of the patient) (e.g., the patient may present with a history of insulin-dependent diabetes mellitus (IDDM), which may contribute to a metabolic acidosis[2]).
Step 2: Check the pH.
If pH < 7.35: Acidosis
pH > 7.45: Alkalosis
pH = 7.40: Normal/mixed disorder/fully compensated disorder
(Note: If mixed disorder, pH indicates stronger component)
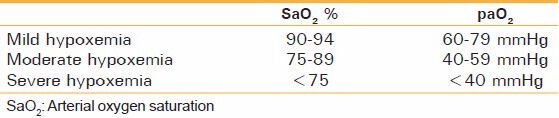
Step 3: Check SaO2 /paO2 (SaO2 is a more reliable indicator as it depicts the saturation of hemoglobin in arterial blood) Table 3.
Table 3.
Grading of hypoxemia
Note: Always compare the SaO2 with FiO2, as the SaO2 could be within normal range but still much less than FiO2, if the patient is on supplemental oxygen (difference should be less than 10).
Step 4: Check CO2 and HCO3 - (bicarbonate) levels-identify the culprit [Table 4].
Table 4.
Acid-base disorders
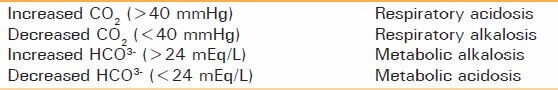
Is it a respiratory/metabolic/mixed disorder?
Step 5: Check base excess (BE).
It is defined as amount of base required to return the pH to a normal range.
If it is positive, the metabolic picture is of alkalosis.
If it is negative, the metabolic picture is of acidosis.
Either of bicarbonate ions/base excess can be used to interpret metabolic acidosis/alkalosis.[7]
The following tables show the interpretation of arterial blood gas report on the basis of using BE as a metabolic index [Figures 5 and 6].
Figure 5.
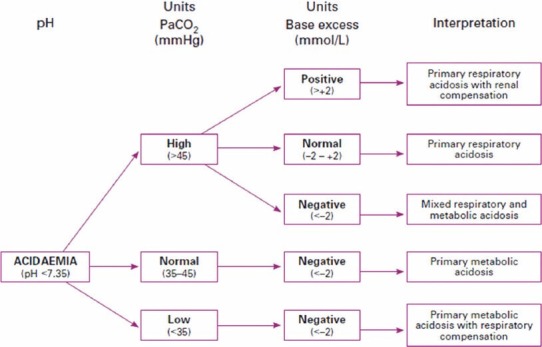
Interpreting acidaemia on an arterial blood gas result
Figure 6.
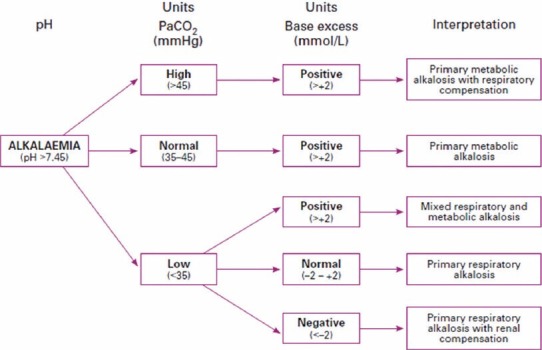
Interpreting alkalaemia on an arterial blood gas result
(Tables adapted from[11])
Step 6: Check for compensation.
Is there a compensatory response with respect to the primary change?
If yes: Compensated, if no: Uncompensated.
In case of compensation, does it bring the pH to a normal range?
If yes: Fully compensated, if no: Partially compensated.
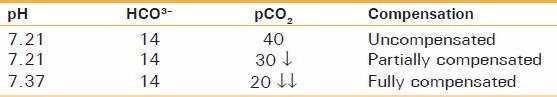
Example: If pH is 7.21, HCO3- is 14, and CO2 is 40.
It is a case of metabolic acidosis (as CO2 is normal, HCO3- is decreased). Expected compensation would be a decrease in CO2 causing respiratory alkalosis. Now consider this table [Table 5]:
Table 5.
Expected compensation
Rule of thumb
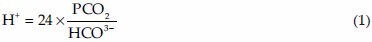
Calculate this value from the arterial blood gas report and if this value is equal to the H+ in the report, the arterial blood gas report is authentic.
Alternatively, subtract the last two digits of the pH (e.g., 20 in pH 7.20) from 80; this value is approximately equal to the H+ concentration (proposed by Burden et al.[13]).
For example, consider this arterial blood gas report: pH: 7.42, pCO2: 30.8, HCO3- : 19.3, H+ : 38.1.
Now, 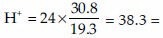 approximately equal to measured H+ in the report.
Alternatively, 80 - last 2 digits of pH = 80-42 = 38 = approximately equal to measured H + in the report.
So, the given ABG report is authentic.
Examples:
-
pH: 7.55, paCO2: 49.0, HCO3- : 48.2
The pH is alkalotic, paCO2 is increased (retention of CO2 causes acidosis), HCO3- is increased (increased base causes alkalosis). So, the primary disorder is metabolic alkalosis. Though CO2 is being retained to compensate for the same, the pH has still not returned to a normal range. So, the interpretation would be partially compensated metabolic alkalosis.
-
pH: 7.34, paCO2: 40.3, HCO3- : 20.4
The pH is acidic, paCO2 is normal, and bicarbonate is decreased. The primary disorder is metabolic acidosis, but there is no compensatory response as the paCO2 is normal. So, the interpretation would be uncompensated metabolic acidosis.
-
pH: 7.52, paCO2 : 31.0, HCO3- : 29.4
The pH is alkalotic, paCO2 is decreased (alkalosis), and bicarbonate is increased (alkalosis).
As the directions of paCO2 and bicarbonate are opposite and both are causing alkalosis, the picture is suggestive of a mixed disorder. The interpretation would be combined alkalosis.
CONCLUSION
Arterial blood gas analysis is a useful tool for diagnosis monitoring and as an aid in management, but its value is limited by the understanding of the basic physiology and ability of the surgeon to interpret the report. Using a systematic and logical approach by using these steps would make the interpretation simple and easy to use.
Footnotes
Source of Support: Nil.
Conflict of Interest: None declared.
REFERENCES
- 1.Verma AK, Paul R. The interpretation of Arterial Blood Gases. Australian Prescriber. 2010;33:124–9. [Google Scholar]
- 2.Mary-Lynn Watson. Back to basics Acid Base Disorders. Can J CME. 2002;6:57–63. [Google Scholar]
- 3.Rao MS, Nagendranath V. Arterial blood gas monitoring. Indian J Anaesth. 2002;46:289–97. [Google Scholar]
- 4.Sood P, Paul G, Puri S. Interpretation of arterial blood gas. Indian J Crit Care Med. 2010;14:57–64. doi: 10.4103/0972-5229.68215. [DOI] [PMC free article] [PubMed] [Google Scholar]
- 5.Williams AJ. ABC of oxygen: Assessing and interpreting arterial blood gases and acid-base balance. BMJ. 1998;317:1213–6. doi: 10.1136/bmj.317.7167.1213. [DOI] [PMC free article] [PubMed] [Google Scholar]
- 6.Asif M, Sarkar PK. Three-Digit Allen's Test. Ann Thorac Surg. 2007;84:686–7. doi: 10.1016/j.athoracsur.2006.11.038. [DOI] [PubMed] [Google Scholar]
- 7.Barthwal MS. Analysis of arterial blood gases-A comprehensive approach. J Assoc Physicians India. 2004;52:573–7. [PubMed] [Google Scholar]
- 8.Mathews PJ. The validity of paO2 values 3, 6 and 9 minutes after an FiO2 change in mechanically ventilated heart surgery patients. Respir Care. 1987;32:1029–34. [Google Scholar]
- 9.Hess D, Good C, Didyoung R. The validity of assessing arterial blood gases 10 minutes after an FiO2, change in mechanically ventilated patients without chronic pulmonary, disease. Respir Care. 1985;30:1037–41. [Google Scholar]
- 10.Woolf CR. Letter: Arterial blood gas levels after oxygen therapy. Chest. 1976;69:808–9. doi: 10.1378/chest.69.6.808. [DOI] [PubMed] [Google Scholar]
- 11.Drage S, Wilkinson D. Acid base balance. Update 13. 2001. World Federation of Societies of Anaesthesiologists. [Last accessed on 2010 Jul 7]. Available from: http://update.anaesthesiologists.org/wp.contentuploads/2009/09/Acid-Base-Balance-Update-13.pdf .
- 12.Kassirer JP, Bleich HL. Rapid estimation of plasma CO2 from pH and total CO2 content. N Engl J Med. 1965;272:1067–8. doi: 10.1056/NEJM196505202722007. [DOI] [PubMed] [Google Scholar]
- 13.Burden RJ, McQuillan PJ. Converting pH and H +: A ½rule of thumb½. Br J Anaesth. 1997;78:479. doi: 10.1093/bja/78.4.479. [DOI] [PubMed] [Google Scholar]