Abstract
The diffusion coefficient of lipids, Dl, within bone marrow, fat deposits and metabolically active intracellular lipids in vivo will depend on several factors including the precise chemical composition of the lipid distribution (chain lengths, degree of unsaturation, etc.) as well as the temperature. As such, Dl may ultimately prove of value in assessing abnormal fatty acid distributions linked to diseases such as cystic fibrosis, diabetes and coronary heart disease. A sensitive temperature dependence of Dl may also prove of value for MR-guided thermal therapies for bone tumors or disease within other fatty tissues like the breast. Measuring diffusion coefficients of high molecular weight lipids in vivo is, however, technically difficult for a number of reasons. For instance, due to the much lower diffusion coefficients compared to water, much higher b factors than those used for central nervous system applications are needed. In addition, the pulse sequence design must incorporate, as much as possible, immunity to motion, susceptibility and chemical shift effects present whenever body imaging is performed. In this work, high b-factor line scan diffusion imaging sequences were designed, implemented and tested for Dl measurement using a 4.7-T horizontal bore animal scanner. The gradient set available allowed for b factors as high as 0.03 µs/nm2 (30,000 s/mm2) at echo times as short as 42 ms. The methods were used to measure lipid diffusion coefficients within the marrow of rat paws in vivo, yielding lipid diffusion coefficients approximately two orders of magnitude smaller than typical tissue water diffusion coefficients. Phantom experiments that demonstrate the sensitivity of lipid diffusion coefficients to chain length and temperature were also performed.
Keywords: Bone marrow, Diffusion, Relaxation, Lipid
1. Introduction
Water diffusion imaging has the potential to provide important information concerning the microstructure of tissue compartments and structural anisotropy in vivo [1–4]. This important feature arises from the fact that MRI diffusion measurements are the only noninvasive techniques that are sensitive to the diffusion path of the water molecules, which, in turn, provides valuable insights in evaluating tissue microstructure. In addition to water diffusion imaging, larger molecules such as lipids may prove useful as diffusion probes. For example, lipid diffusion measurements in bone marrow or metabolically active intracellular lipids in muscle may help assess distinct fatty acid distributions linked to such diseases as cystic fibrosis, diabetes and coronary heart disease [5–9] where lipid constituents or their environments are known to deviate from normal. Another potential application lies in the area of MR-guided temperature monitoring for thermal therapies [10,11] where the current method of choice depends on the temperature-dependent water proton resonance [12]. This temperature dependence of the water resonant frequency is not shared by the methylene or methyl protons of lipids due to the lack of hydrogen bonding [10–12] and, thus, cannot be used for fatty tissue per se. The spin–lattice relaxation time of the lipid protons, T1, has been proposed as an alternate temperature probe for fat [11], though nonlinearities over requisite temperature ranges and field strengths may present problems that measurements of Dl may overcome.
As mentioned above, the diffusion coefficients of lipids, which consist of saturated, monounsaturated and polyunsaturated triglycerides, within bone marrow, adipose tissue and intracellular storage depots, will be influenced by molecular weight (MW), temperature and chemical structure. Furthermore, measuring the diffusion coefficients of these high MW moieties in vivo will require high b factors and pulse sequence approaches that are relatively immune to motion and susceptibility artifacts. Recently, Lehnert et al. employed a diffusion-weighted single-voxel spectroscopic STEAM method with maximum b values of 0.002 to 0.08 µs/nm2, to measure lipid diffusion coefficients in human bone marrow in vivo, and reported values of approximately 12 nm2/µs [13]. In the present work, we performed image-based measurements of lipid diffusion coefficients by implementing the line scan diffusion imaging (LSDI) sequence [14] on a 4.7-T animal scanner capable of achieving b factors of 0.03 µs/nm2 at an echo time (TE) of 42 ms. Two aliphatic organic phantoms were used to study the effect of chain length, and lard samples at 37°C and 24°C were examined to demonstrate the temperature sensitivity of Dl. Finally, studies of lipids in the bone marrow of rat paws were performed to determine lipid diffusion coefficients in vivo.
2. Animal preparation
All procedures were approved by the Children's Hospital Animal Care and Use Committee. Six male Sprague–Dawley rats weighing 200–400 g were scanned with a 4.7-T, 30-cm horizontal bore BioSpec scanner (Bruker Instruments, Inc., Billerica, MA) with a gradient coil insert capable of generating a maximum gradient strength of 400 mT/m. A volume coil was used for RF transmission with a receiver coil placed directly under the rat paws for improved signal-to-noise ratio. The MR scans were performed with animals under isoflurane anesthesia (1.5–2%; Forane, Baxter Healthcare Corporation, Deerfield, IL) and euthanized with an overdose of pentobarbital (100 mg/kg) at the end of each experiment.
3. Phantom studies
Diffusion-weighted images with high b factors were obtained using the LSDI sequence [14]. This sequence was implemented on a 4.7-T Bruker animal imaging system with software release version 3.1.1. Details regarding the LSDI technique have been presented elsewhere [14–16], but the sequence is a spin-echo method in which spatially selective π/2 and π pulses elicit a spin echo from a column of tissue defined by the intersection of the slice-selective pulses. Spins along the column are frequency encoded during the spin-echo acquisition. Balanced diffusion gradients are placed about the refocusing π pulse in the classic Tanner–Stejskal configuration [17] to achieve diffusion weighting. Multiple columns are sequentially sampled in an interleaved fashion [14] to acquire 2D images of the selected slice with b-factor weighting defined by the relation:
where γ is the gyromagnetic ratio, g is the diffusion gradient strength, Δ is the delay between leading edges of the diffusion sensitization pulses and δ is the duration of each diffusion sensitization gradient assumed applied using all three gradient directions accounting for the factor of 3 in this relation. Diffusion imaging was performed at a temperature of approximately 24±2°C on two organic compounds placed in cylindrical phantoms (diameter=3 cm, length=11 cm). The two compounds had different chain lengths: n-butanol (C4H9OH) and oleic acid (C17H33-COOH) with MWs of 74 and 282 u, respectively.
Experiments were also performed with an animal lard sample at 24°C and 37°C for comparison to animal fat in vivo. The higher temperature was achieved in an oven outside of the scanner with the temperature of the lard measured before and after the experiment and with a total change of less than 4°C. For phantom imaging of these isotropically diffusing compounds, diffusion sensitization was applied only along a single direction in a (1, 1, 1) gradient configuration to achieve maximum diffusion encoding with minimum TE. For n-butanol, the imaging parameters used were as follows: TE=32 ms, effective repetition time (TR)=7333 ms, time between column samplings=170 ms, δ=9 ms and Δ=16 ms with 16 equally spaced b factors sampled from 0.0001 to 0.0075 µs/nm2. For oleic acid, the imaging parameters used were the following: TE=43 ms, effective TR=7333 ms, time between column samplings=170 ms, δ=9 ms and Δ=16 ms with 16 equally spaced b factors sampled from 0.0002 to 0.03 µs/nm2. For the animal lard studies at both temperatures, the imaging parameters were as follows: TE=50 ms, effective TR=7333 ms, time between column samplings=170 ms, δ=20 ms and Δ=24 ms with 16 images acquired with spaced b factors from 0.002 to 0.06 µs/nm2. All images were acquired with a square field of view of 8×8 cm2 and a matrix size (frequency×column) of 128×132.
4. In vivo studies
The bone marrow image acquisition protocol included a series of axial spin-echo T2-weighted images (RARE sequence with 1000 ms TR, 28 ms effective TE, 2 mm slice thickness, 128×128 matrix, 4 cm2 field of view and 4 signal averages) for localization followed by an LSDI acquisition of both paws in the axial plane. The right hind paw of each rat had been treated with a toxin as part of a separate muscle edema study [15]. We hypothesized that the muscle edema would have no effect on lipid diffusion within the bone marrow (vide infra). The LSDI data were obtained with the following scan parameters: effective TR=7920 ms, time between column samplings=180 ms, TE=42 ms, square field of view=6.4×6.4 cm2, slice thickness=1.5 mm and matrix size (frequency×column)=128×131. Data were acquired for 16 equally spaced b factors from 0.0002 to 0.03 µs/nm2 using four separate diffusion gradient directions of (1, 1, 1), (1, 1, −1), (1, −1, 1), (−1, 1, 1). The diffusion gradient pulse duration δ and the separation between the first and the second gradient pulse Δ were fixed at 16 and 20 ms, respectively. The total scan time for one diffusion direction with 16 b factors was approximately 7 min. For diffusion analyses, ROIs within the central digit of the left and right paw for each rat (2 ROIs per rat) were identified from which signal intensity versus b-factor curves were extracted and fit with monoexponential functions in order to estimate Dl.
5. Results
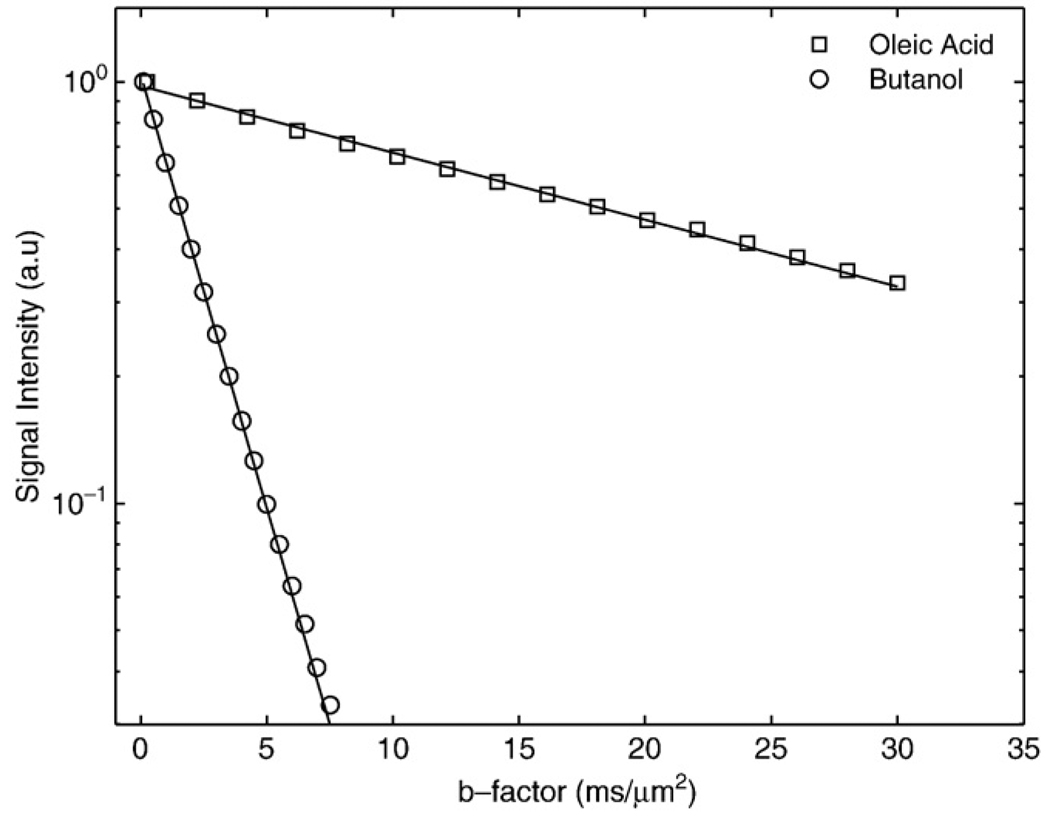
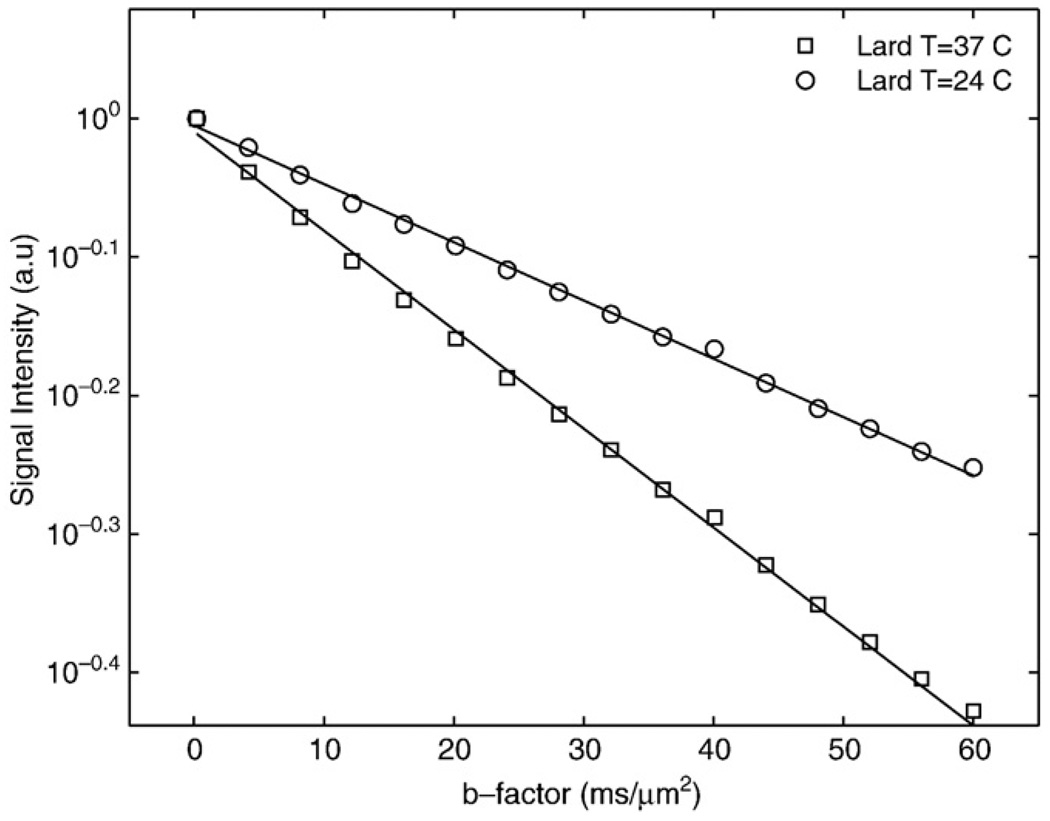
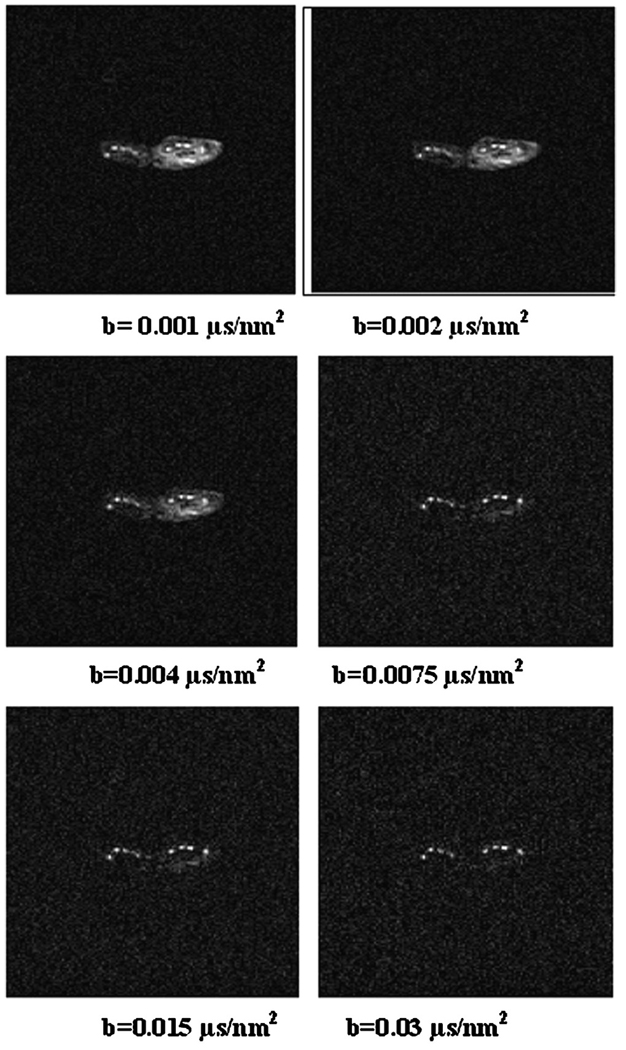
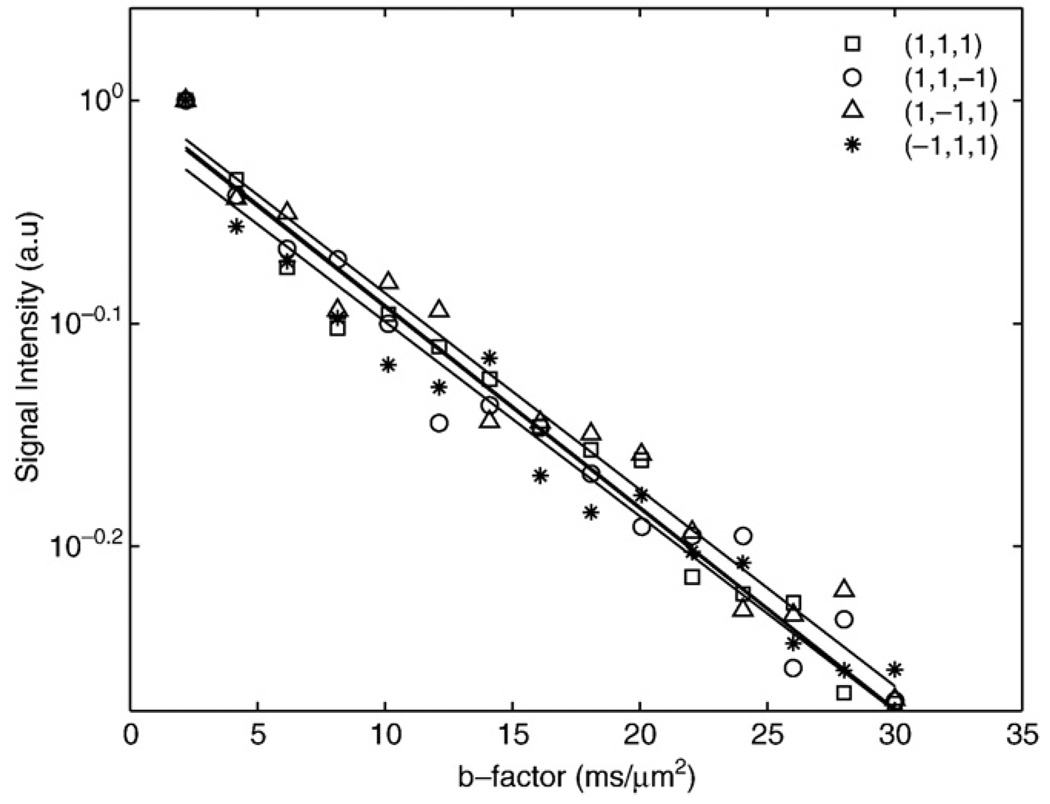
Fig. 1 shows semi-log plots of signal intensity versus b factor for n-butanol (MW=74 u) and oleic acid (MW=282 u) samples. The decays were well characterized with mono-exponential functions, yielding diffusion coefficients of 450±30 and 36±2 nm2/µs for butanol and oleic acid, respectively. Fig. 2 shows semi-log plots of signal intensity versus b factor for animal lard at 37°C and 24°C. The decays are well-characterized with monoexponential functions, yielding Dl values of 16.5±0.8 and 9.7±0.6 nm2/µs for the 37°C and 24°C measurements, respectively. Fig. 3 shows in vivo images of rat paws acquired at b factors of 0.001, 0.002, 0.004, 0.0075, 0.015 and 0.03 µs/nm2. The muscle edema induced for the previously published study [15] is evident within the right paw in the lower b-factor image, while in the highest b-factor image, the only signal remaining from either paw arises from bone marrow lipids in the digits. Fig. 4 shows signal intensity decay curves from an ROI within bone marrow of a rat paw for all four diffusion sensitization gradient directions. Solid lines through the data are best fits to monoexponential functions with the data from the lowest b factor discarded as signal from this point was well above extrapolated fits to the higher b factor, a feature attributed to a faster decaying water and/or perfusion component at the smallest b factors. Table 1 provides the interindividual mean (6 rats, 12 ROIs) diffusion coefficients for each direction, the mean trace diffusion coefficient and diffusion tensor cross terms available from the tetrahedral diffusion sensitization encoding. The trace values for the lipid diffusion coefficients are all on the order of 18.5 nm2/µs, a value similar to the 16.5 nm2/µs Dl obtained for lard at 37°C. There was no statistical difference in Dl values between the right and the left paws (P>.7, paired t test), justifying the assumption that the muscle edema [15] played no role in the study. Off-diagonal terms of the diffusion tensor available from the tetrahedral diffusion encoding scheme, Dxz, Dxy and Dyz, were less than 1% of the trace diffusion coefficients, indicating minimal diffusion anisotropy effects at the settings employed.
Fig. 1.
Semi-log plots of the signal decay with b factor from n-butanol and oleic acid as obtained at 24±2°C. Solid lines indicate the monoexponential fits to the data, yielding diffusion coefficients of 450 and 36 nm2/µs for n-butanol and oleic acid, respectively.
Fig. 2.
Semi-log plots of the signal decay with b factor from animal lard at 24°C and 37°C. Solid lines indicate monoexponential fits to the data, yielding Dl values of 9.7 and 16.5 nm2/µs for lard at 24°C and 37°C, respectively.
Fig. 3.
Axial images of rat paws acquired at b factors of 0.001, 0.002, 0.004, 0.0075, 0.015 and 0.03 µs/nm2 using the LSDI sequence.
Fig. 4.
Normalized decay curves from bone marrow ROI as acquired for different tetrahedral diffusion sensitization directions.
Table 1.
Interindividual means±S.D. of (A) the diffusion coefficients of bone marrow for four directions using 12 ROIs placed within the digits of six rats and (B) the trace and the cross terms’ diffusion coefficients
| (A) | ||||
|---|---|---|---|---|
| Diffusion direction | (1, 1, 1) | (1, 1, −1) | (1, −1, 1) | (−1, 1, 1) |
| Bone marrow Dl (nm2/µs) |
18.2±2.8 | 18.6±2.0 | 18.3±2.1 | 19.0±2.2 |
| (B) | ||||
| Diffusion anisotropy | Trace | Dxz | Dyz | Dxy |
| Bone marrow Dl (nm2/µs) |
18.5±0.23 | 0.14±0.065 | 0.035±0.012 | 0.057±0.0057 |
6. Discussion
Lipids of bone marrow, visceral and subcutaneous fat deposits consist mainly of triglycerides with MWs on the order of 800 u. Thus, to see very clear signal attenuation, strong diffusion weighting must be applied. For calibration purposes, high MW substances like butanol and oleic acid may be employed. The diffusion coefficients we obtained for these substances are grossly similar to those reported by Lehnert et al. [13], who used STEAM methods on a clinical scanner with maximum gradient strengths of 25 mT/m. They reported diffusion coefficients for butanol and oleic acid, measured at 20°C, of 377.8±18.9 and 31.8±0.6 nm2/µs, respectively. In comparison, the present results, measured at 24°C, showed somewhat larger values, approximately 20% and 12% higher for n-butanol and oleic acid, respectively, possibly due to higher room temperatures in the present study. We do note, however, that our room-temperature values for the diffusion coefficient of n-butanol are very similar to those reported by Tofts et al. [18] in their study of potential test liquids for quantitative diffusion phantoms.
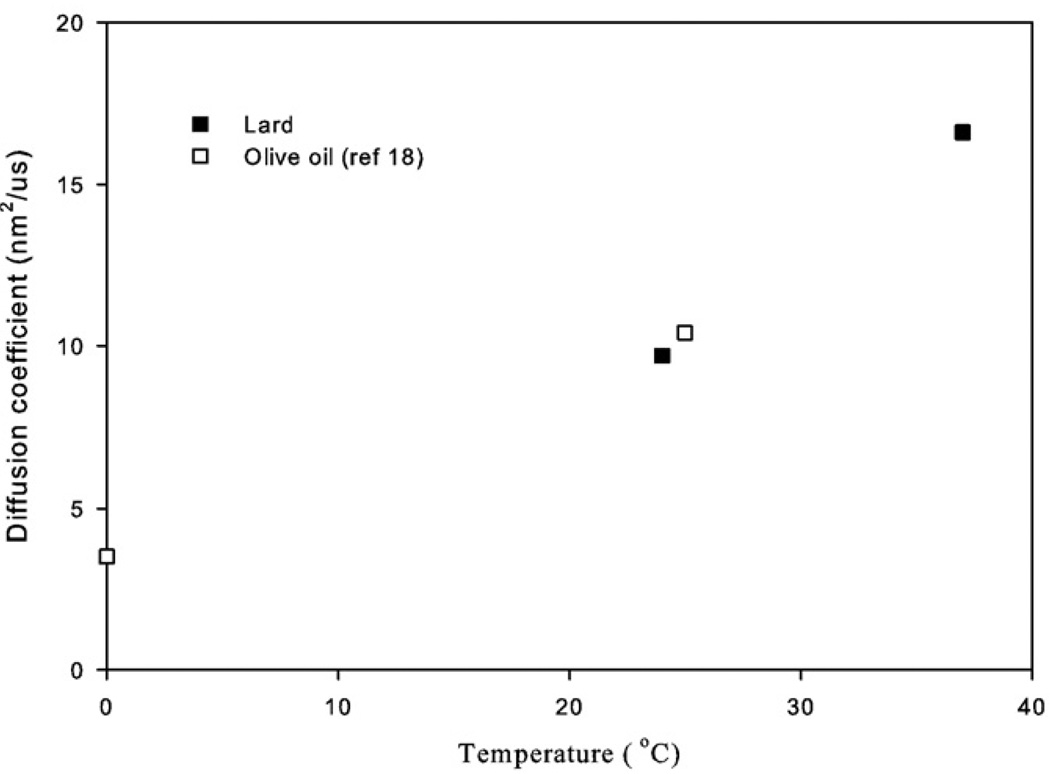
Animal lard and vegetable oils consist of triglycerides with MWs on the order of 800 u and, hence, represent even more realistic phantom calibration materials for lipid diffusion measurements in bone marrow or human lipid deposits than the neat solutions of n-butanol and oleic acid. Our Dl value for the room-temperature lard experiments of 9.7 nm2/µs is similar to the room-temperature Dl value of 10.4 nm2/µs for triglycerides within olive oil reported by Guillermo and Bardet [19] using similar pulsed field gradient proton diffusion measurements made with similar instrumentation and technique. Furthermore, this value is close to the Dl value of 11 nm2/µs measured previously by our group at room temperature in a dairy cream phantom for the slow diffusion component attributed to the lipids [16]. By elevating the temperature of our lard sample to approximately 37°C, the Dl value increased to 16.5 nm2/µs, which was very similar to our in vivo measurement of Dl of triglycerides within the rat paw of 18.5 nm2/µs. We note that Lehnert et al. [13] reported a much higher Dl for “molten” lard at 37°C of 65 nm2/µs, a difference we attribute primarily to the fact that our sample was still solid and cooling from 37°C during the experiment. Still, our Dl measurement of lard at 37°C is strikingly similar to the in vivo result for rat paw bone marrow that presumably consists of similar triglycerides at a similar temperature. Large differences in sequence timing parameters and technique (spin echo with large gradients vs. STEAM with clinical strength gradients [13]) can also lead to discrepancies between our results and those of Lehnert et al. who reported Dl values for in vivo human bone marrow of 11.1 to 12.4 nm2/µs as opposed to our in vivo rat marrow Dl values of around 18.5 nm2/µs. Fig. 5 is a plot of the Dl versus temperature generated using our lard data combined with the olive oil diffusion measurements of Guillermo and Bardet who measured Dl close to 0°C as well as at room temperature [19]. From this plot, the temperature sensitivity of typical triglycerides is estimated to be approximately 0.35 nm2/µs/°C, an estimate that may be useful in calculating anticipated signal changes in diffusion-weighted images of bone marrow or other fatty tissue like breast [10] during thermal therapies.
Fig. 5.
Plot of Dl versus temperature from our measurements in lard and related measurements in olive oil from Ref. [19]. The increase of Dl with temperature is estimated to be approximately 0.35 nm2/µs/°C.
Diffusion imaging of lipids in vivo is relatively unexplored and may have medical applications in assessing fatty acid distributions or for monitoring temperatures in fatty tissues during MR-guided thermal therapies. Technical difficulties of performing lipid diffusion imaging have been overcome in this work by using high b-factor LSDI sequences as implemented on a high-performance animal scanner, allowing for measurement of lipid diffusion coefficients, which are approximately 100 times smaller than typical water diffusion coefficients. With clinical scanners, stimulated-echo- as opposed to spin-echo-based approaches are probably the most practical for achieving the strong b-factor weightings needed for Dl assessments, given the limitations of gradient strengths available and the need to keep TEs as short as possible to limit T2 decay signal loss. Estimates of how strong the b factors should be can be made using the measured values of Dl from either Lehnert et al.'s study [13] or this study, within the framework of the two-point optimization calculation of Xing et al. [20], who showed that the high b factor should obey the approximate relation bDl=1.1. Thus, for Dl values in the range of 9 to 18 nm2/µs, high b values of 0.06 to 0.12 µs/nm2, or, in more conventional units, 0.06 to 0.122 µs/nm2, should be employed. Finally, as with water diffusion measurements, restricted diffusion effects can play a role in lipid diffusion measurements with droplet or lipid containing pore sizes affecting the observed Dl values, which, in turn, become sensitive to the diffusion times employed [19]. However, the extent to which information regarding lipid domain sizes can be inferred and exploited to study aspects of bone degeneration in disease processes like osteoporosis remains to be assessed.
Acknowledgments
This work was supported in part by NIH Grant 1 R01 NS39335-01, NIH R01 EB006867, and U41RR019703. H.B. was supported by a grant from the French Society of Anesthesia Intensive Care.
References
- 1.Beaulieu C. The basis of anisotropic water diffusion in the nervous system — a technical review. NMR Biomed. 2002;15:435–455. doi: 10.1002/nbm.782. [DOI] [PubMed] [Google Scholar]
- 2.Jespersen SN, Kroenke CD, Ostergard L, Ackerman JJH, Yablonskiy DA. Modeling dendrite density from magnetic resonance diffusion measurements. NeuroImage. 2007;34:1473–1486. doi: 10.1016/j.neuroimage.2006.10.037. [DOI] [PubMed] [Google Scholar]
- 3.Meder R, de Visser SK, Bowden JC, Bostrom T, Pope JM. Diffusion tensor imaging of articular cartilage as a measure of tissue architecture. Osteoarthr Cartil. 2006;14:875–881. doi: 10.1016/j.joca.2006.03.002. [DOI] [PubMed] [Google Scholar]
- 4.Sinha S, Sinha U. In vivo diffusion tensor imaging of the human prostate. Magn Reson Med. 2004;52:530–537. doi: 10.1002/mrm.20190. [DOI] [PubMed] [Google Scholar]
- 5.Campbell IM, Crozier DN, Caton RB. Abnormal fatty acid composition [LA] and impaired oxygen supply in cystic fibrosis patients. Pediatrics. 1976;57:480–486. [PubMed] [Google Scholar]
- 6.Boden G. Free fatty acids, insulin resistance, and type 2 diabetes mellitus. Proc Assoc Am Physicians. 1999;111:241–248. doi: 10.1046/j.1525-1381.1999.99220.x. [DOI] [PubMed] [Google Scholar]
- 7.Wood DA, Butler S, Riemersma RA, Thomson M, Oliver MF, Fulton M, et al. Adipose tissue and platelet fatty acids and coronary heart disease in Scottish men. Lancet. 1984;2:117–121. doi: 10.1016/s0140-6736(84)91044-4. [DOI] [PubMed] [Google Scholar]
- 8.Beynen AC, Hermus RJJ, Hautvast JGAJ. A mathematical relationship between the fatty acid composition of the diet and that of the adipose tissue in man. Am J Clin Nutr. 1980;33:81–85. doi: 10.1093/ajcn/33.1.81. [DOI] [PubMed] [Google Scholar]
- 9.Felts JM. In: Fat as a tissue. Rodahi K, Issekutz B, editors. New York: McGraw-Hill Book Company; 1964. p. 95. [Google Scholar]
- 10.McDannold N, Szot Barnes A, Rybicki FJ, Oshio K, Chen NK, Hynynen K, et al. Temperature mapping considerations in breast with line scan echo planar spectroscopic imaging. Magn Reson Med. 2007;58:1117–1123. doi: 10.1002/mrm.21322. [DOI] [PubMed] [Google Scholar]
- 11.Hynynen K, McDannold N, Mulkern RV, Jolesz FA. Temperature monitoring in fat with MRI. Magn Reson Med. 2000;43:901–904. doi: 10.1002/1522-2594(200006)43:6<901::aid-mrm18>3.0.co;2-a. [DOI] [PubMed] [Google Scholar]
- 12.Quesson B, de Zwart JA, Moonen CTW. Magnetic resonance temperature imaging for guidance of thermotherapy. J Magn Reson Imag. 2000;12:525–533. doi: 10.1002/1522-2586(200010)12:4<525::aid-jmri3>3.0.co;2-v. [DOI] [PubMed] [Google Scholar]
- 13.Lehnert A, Machann J, Helms G, Claussen CD, Schick F. Diffusion characteristics of large molecules assessed by proton MRS on a whole-body MR system. Magn Reson Imag. 2004;22:39–46. doi: 10.1016/j.mri.2003.05.007. [DOI] [PubMed] [Google Scholar]
- 14.Gudbjartsson H, Maier SE, Mulkern RV, Morocz IA, Patz S, Jolesz FA. Line scan diffusion imaging. Magn Reson Med. 1996;36:509–518. doi: 10.1002/mrm.1910360403. [DOI] [PubMed] [Google Scholar]
- 15.Ababneh Z, Beloeil H, Berde CB, Gambarota G, Maier SE, Mulkern RV. Biexponential parameterization of diffusion and T2 relaxation decay curves in a rat muscle edema model: decay curve components and water compartments. Magn Reson Med. 2005;54:524–531. doi: 10.1002/mrm.20610. [DOI] [PubMed] [Google Scholar]
- 16.Ababneh Z, Haque M, Maier SE, Mulkern RV. Dairy cream as a phantom material for biexponential diffusion decay. Magn Reson Mater Phy. 2004;17:95–100. doi: 10.1007/s10334-004-0063-7. [DOI] [PubMed] [Google Scholar]
- 17.Stejskal EO, Tanner JE. Spin diffusion measurements: spin echoes in the presence of a time-dependent field gradient. J Chem Phys. 1965;42:288–292. [Google Scholar]
- 18.Tofts PS, Lloyd D, Clark CA, Barker GJ, Parker GJM, McConville P, et al. Test liquids for quantitative MRI measurements of self-diffusion coefficient in vivo. Magn Reson Med. 2000;43:368–374. doi: 10.1002/(sici)1522-2594(200003)43:3<368::aid-mrm8>3.0.co;2-b. [DOI] [PubMed] [Google Scholar]
- 19.Guillermo A, Bardet M. In situ pulsed-field gradient NMR determination of the size of oil bodies in vegetable seeds. Analysis of the effect of the gradient pulse length. Anal Chem. 2007;79:6718–6726. doi: 10.1021/ac070416w. [DOI] [PubMed] [Google Scholar]
- 20.Xing D, Papadakis NG, Huang CLH, Lee VM, Carpenter TA, Hall LD. Optimised diffusion-weighting for measurement of apparent diffusion coefficient (ADC) in human brain. Magn Reson Imag. 1997;15:771–784. doi: 10.1016/s0730-725x(97)00037-4. [DOI] [PubMed] [Google Scholar]


