

SUMMARY
The mechanisms dictating whether a cell proliferates or differentiates have undergone intense scrutiny but remain poorly understood. Here, we report that a central component in the nonsense-mediated RNA decay (NMD) pathway—UPF1—plays a key role in this decision by promoting the proliferative, undifferentiated cell state. UPF1 acts, in part, by destabilizing the NMD substrate encoding the TGFβ inhibitor, SMAD7, and stimulating TGFβ signaling. UPF1 also promotes the decay of mRNAs encoding many other proteins that oppose the proliferative, undifferentiated cell state. Neural differentiation is triggered when NMD is downregulated by neurally expressed microRNAs (miRNAs). This UPF1-miRNA circuitry is highly conserved and harbors negative feedback loops that act as a molecular switch. Our results suggest that the NMD RNA decay pathway collaborates with the TGF-β signaling pathway to lock-in the stem-like state, a cellular state that is stably reversed when neural differentiation signals that induce NMD-repressive miRNAs are received.
INTRODUCTION
The underlying mechanisms dictating whether a cell proliferates or differentiates has been one of the most important questions in the field of biology for the past several decades. In contrast to the plethora of knowledge about transcriptional mechanisms that control such proliferation vs. differentiation decisions, very little is known about the role of post-transcriptional mechanisms in this process. Recent studies have identified specific RNA-binding proteins and microRNAs (miRNAs) that can swing the balance in one direction or another, but the mechanisms underlying these pathways remains poorly understood (Melton and Blelloch, 2010).
In this communication, we report that the nonsense-mediated mRNA decay (NMD) pathway plays a crucial role in this decision. NMD is a conserved RNA degradation mechanism that depends on several proteins, including UPF1, an RNA helicase with ATPase activity that is absolutely essential for NMD, and the adapter proteins, UPF2 and UPF3B, that are required for specific branches of NMD (Popp and Maquat, 2013; Schweingruber et al., 2013). NMD was originally identified as a quality control pathway that rapidly degrades aberrant transcripts harboring premature stop (nonsense) codons (PTCs) (Chang et al., 2007). Recent studies have shown that NMD is not only a quality control pathway, but also a regulatory pathway that controls normal gene expression. Gene expression profiling studies have shown that either loss or depletion of NMD factors in species scaling the phylogenetic scale leads to the dysregulation of ~3%–15% of normal transcripts (Schweingruber et al., 2013). While many of these dysregulated mRNAs are probably indirectly regulated by NMD, studies have begun to identify some of them as direct NMD targets (Hurt et al., 2013; Kim et al., 2012; Tani et al., 2013). One of the “NMD-inducing features” in these direct NMD substrates is the presence one or more introns downstream of the stop codon that defines the end of the open reading frame (ORF) encoding the protein (Chang et al., 2007). Intron splicing leads to deposition of a set of proteins called the exon-junction complex (EJC), which interact with UPF1 and other NMD factors recruited at the site of translation termination, ultimately leading to rapid mRNA decay. Evidence suggests that mRNAs harboring a stop codon in the final exon avoid rapid mRNA decay because actively translating ribosomes strip off EJCs before encountering the stop codon during the pioneer round of translation (Dostie and Dreyfuss, 2002; Chang 2007). Other NMD-inducing features are upstream ORFs (uORFs) and long 3′ UTRs, which trigger NMD by mechanisms that are not clearly understood (Schweingruber et al., 2013).
The finding that NMD regulates the levels of many normal mRNAs raises the possibility that NMD regulates normal biological events. In support of this possibility, studies conducted in a wide range of organisms have shown that loss or depletion of NMD factors causes specific developmental defects (Vicente-Crespo and Palacios, 2010). While these studies have clearly shown that NMD factors have roles in various biological processes, it has not been determined whether this is because of NMD’s ability to regulate normal gene expression programs (i.e., through decay of subsets of normal mRNAs) or its quality control function (i.e., through decay of aberrant transcripts).
The notion that NMD’s ability to regulate normal gene expression programs is physiologically important is supported by the growing evidence that NMD itself is subject to regulation (Huang and Wilkinson, 2012; Karam et al., 2012). Our laboratory recently reported that the neurally expressed miRNAs miR-128-1 and -2 repress NMD through direct silencing of UPF1 and the EJC core protein MLN51 (Bruno et al., 2011). While we did not address the physiological relevance of this regulation, we obtained several lines of evidence suggesting that these two miRNAs (which are identical and thus we will henceforth collectively refer to as “miR-128”) are important for nervous system development. In the present paper, we directly address the roles of miR-128 and one of its targets, UPF1, as well as their regulatory relationship, in controlling the decision to maintain the undifferentiated cell state or undergo neural differentiation.
Results
UPF1 Promotes the Stem-Like State and is Downregulated to Permit Neural Differentiation
Given that UPF1 is a core NMD factor that we previously showed is a direct target of a neural-promoting miRNA (Bruno et al., 2011), we examined whether UPF1 levels are regulated in the nervous system. We found that Upf1 mRNA levels decrease during mouse embryonic brain cortex development and when mouse neural stem cells (mNSCs) and human neural progenitor cells are induced to undergo maturation (Figures 1A and S1A). Upf1 mRNA is also downregulated in differentiated P19 cells (Figure S1A), which undergoes neural differentiation in response to retinoic acid (RA) treatment. To assess the generality of this downregulatory response, we examined other NMD factors and found that Upf2, Upf3b, Smg1, and Smg6 mRNA were also downregulated in mNSCs undergoing maturation (Figure 1A). In contrast, Smg5 and Smg7 mRNA levels were modestly upregulated in maturing mNSCs.
Figure 1. UPF1 is Downregulated to Permit Neural Differentiation.

(A) Quantitative polymerase chain reaction (qPCR) analysis of NMD factor transcript levels in mNSCs incubated in differentiation media for the times indicated.
(B and C) NMD activity is decreased during neural differentiation. P19 cells treated with RA to induce differentiation were analyzed for NMD activity using the NMD reporters developed by Boelz et al. (2006) (B) and Singh et al. (2008) (C), as described in the Extended Experimental Procedures.
(D–F) Rescue of UPF1 expression suppresses neural differentiation. qPCR (D), Western (E), and Immunofluorescence (F) analyses of P19 cells transfected with the UPF1 expression vector (Ev-Upf1) or empty vector (Ev-C) and treated with RA. mRNA levels (D) are relative to P19 cells not incubated with RA, which were given a value of 1. Western analysis quantification (E) is the mean of three experiments, normalized against β-ACTIN; error bars represent standard deviation (SD). Immunofluorescence analysis (F) is of UPF1 (red), NESTIN (green), and DAPI (blue); the box plot shows the distribution of protein levels in individual cells (see Extended Experimental Procedures for details).
(G, H) Suppression of Upf1 expression is sufficient to induce neural differentiation and promote neural maturation. qPCR analysis of P19 cells (G) and mNSCs (H) transfected with either UPF1 siRNA or Luciferase (Luc) siRNA (the latter is the negative control, which was given a value of 1). The P19 cells were cultured in the absence of RA.
(I–L) The Upf1 downregulatory response is necessary and sufficient to inhibit cellular proliferation. Cell-counting experiments performed in P19 cells treated and transfected as indicated (I–K; n=6). Cell-cycle analysis of P19 cells treated and transfected as indicated (L; n=3). Error bars represent SD.
Statistical analysis for all figure panels was done using the paired Student’s t test (asterisks denote statistically significant differences; p<0.05). Unless otherwise noted, all experiments were repeated 3 times and error bars depict standard error mean (SEM). Transcript levels were normalized to the level of L19 RNA for all qPCR experiments.
The downregulation of UPF1 and most other NMD factors that we tested raised the possibility that the magnitude of NMD itself is reduced during neural differentiation and maturation. In support of this, three well-established NMD substrates—Atf3, Gadd45b, and Gas5 mRNA (Chan et al., 2007; Huang et al., 2012)—were upregulated in differentiating P19 cells (Figure S1B). To directly assess NMD activity, we used a dual NMD reporter system (Boelz et al., 2006) and found that the ratio of PTC−/PTC+ transcripts decreased when P19 cells underwent neural differentiation, indicative of decreased NMD activity (Figures 1B and S1C). NMD activity was also decreased during mNSCs maturation, as assessed using a tetracycline (tet)-promoter-based NMD reporter system to directly measure mRNA half-life (Singh et al., 2008) (Figure 1C).
To determine whether this NMD downregulatory response has a causal role in neural differentiation, we maintained UPF1 levels in differentiating P19 cells by expressing modest levels of exogenous UPF1 from a heterologous promoter. We found that this blocked the upregulation of neural differentiation markers and largely prevented the downregulation of stem-cell markers (Figures 1D–1F). As further evidence that UPF1 promotes the stem-like state, we found that UPF1 overexpression was sufficient to upregulate stem-cell markers (Figure S1D). To determine whether repression of UPF1 is sufficient to elicit neural differentiation, we used RNA interference (RNAi) to deplete UPF1 in P19 cells. We found that UPF1 knockdown was sufficient to elicit the initial stages of differentiation, as assessed by the upregulation of neural differentiation markers and the downregulation of stem-cell markers (Figures 1G and S1E). UPF1 knockdown also stimulated neural maturation, as assessed in mNSCs grown under pro-neural differentiation conditions (Figure 1H).
Since UPF1 is an essential factor for another RNA decay pathway—SMD (Gong et al. 2009)—this raised the possibility that the UPF1 downregulatory response promotes neural maturation because it depresses the SMD pathway. This is unlikely to be case, as we found that depleting the essential SMD factor, STAU1, did not promote mNSC maturation, as assessed by early neural maturation markers (Figure S1F). To assess whether the ability to repress neural maturation is a general property of NMD or mediated by UPF1 in particular, we examined the effect of loss of the NMD factor, UPF3B, which, like UPF1, is downregulated during neural maturation (Figure 1A). We isolated mNSCs from the Upf3b-null mice we recently generated (Huang et al., 2012) and found that when grown under differentiating conditions, these Upf3b-null mNSCs had significantly higher level of early neural markers than littermate control mNSCs, suggesting that UPF3B normally suppresses the ability of these cells to differentiate (Figure S1G). Taken together, these data indicate that the NMD downregulatory response that occurs during the neural differentiation program is essential for the normal differentiation and maturation of neural cells.
UPF1 Promotes Proliferation at the G1/S Transition
Our finding that UPF1 represses neural differentiation and maturation raised the possibility that it does so because UPF1 favors the proliferative state. Indeed, we found that depleting UPF1 in undifferentiated P19 cells reduced their ability to proliferate (Figure 1I). Conversely, modest overexpression of UPF1 was sufficient to increase their proliferation (Figure 1J). Because UPF1 is normally downregulated during neural differentiation (Figures 1A and S1A), this led us to next ask whether this downregulatory response is necessary for P19 cells to cease proliferating in response to a differentiation signal. Indeed, we found that maintenance of UPF1 levels with an Upf1 expression vector prevented the cessation of proliferation that normally occurs when P19 cells are induced to undergo neural differentiation by RA treatment (Figure 1K).
It is well established that neural differentiation leads to inhibited cell proliferation at the G1/S transition point of the cell cycle (Orford and Scadden, 2008). Thus, if the UPF1 downregulatory response we uncovered has a role in this cell cycle blockade, UPF1 knockdown ought to inhibit progression through G1/S. Indeed, we found that depletion of UPF1 caused an accumulation of cells in G1 and reduced number of cells in S phase, indicative of a G1/S transition block (Figures 1L and S1H). As a positive control, we tested the standard neural differentiation signal, RA, and found it had the same effect (Figures 1L and S1H). Forced UPF1 expression in RA-treated P19 cells largely reversed the G1/S blockade, providing direct evidence that UPF1 drives cells to progress through this transition point of the cell cycle (Figure 1L).
NMD Selectively Degrades mRNAs Encoding Proliferation Inhibitory Factors
Our finding that the NMD factor, UPF1, promotes progression through G1/S raised the possibility that NMD promotes the decay of mRNAs encoding inhibitory proteins that block progression through this stage of the cell cycle. Ten factors with well-defined G1/S inhibitory activity are known, most of which are repressed in stem cells to maintain a high rate of self-renewal activity and must be activated for such cells to leave the mitotic cycle and undergo terminal differentiation (Orford and Scadden, 2008). As a first step towards evaluating whether the mRNAs encoding any of these G1/S inhibitors are NMD targets, we examined whether they have known NMD-inducing features, such as an uORF, a long 3′ UTR (>1 kb), an intron in the 3′ UTR, or were alternatively spliced to generate one or more of these features (see Introduction). We found that 8 of these 10 mRNAs had NMD-inducing features (Table S1). To empirically determine whether any of these 8 mRNAs are regulated by NMD, we examined whether they are upregulated when NMD is perturbed. Quantitative (q) RT-PCR analysis demonstrated that transcripts from 4 of these genes—p21 (Cdkn1a), p27 (Cdkn1b), p57 (Cdkn1c), and Mapk6 (Erk3)—were significantly upregulated in UPF1-depleted P19 cells (Figure 2A). Since destabilization is the hallmark of direct NMD target mRNAs (Chang et al., 2007), we performed RNA half-life analysis on these 4 mRNAs and found they were stabilized in response to UPF1 depletion (Figures 2B and S2A). Together with their increased steady-state level in response to NMD perturbation and the fact they have NMD-inducing features, this provided strong evidence that these 4 transcripts are direct NMD targets. Further support that p21 mRNA is a direct NMD target is that it is stabilized when its putative NMD-inducing feature—an uORF—is deleted (Kim et. al., 2012).
Figure 2. UPF1 Promotes the Decay of mRNAs Encoding Proliferation Inhibitors and Differentiation Factors.

(A) qPCR analysis of transcripts encoding the indicated classes of proteins in Upf1-depleted (siUpf1) P19 cells. The fold change of mRNA level is relative to that in control cells treated with a siRNA against luciferase (siLuc). mRNA normalization and statistical analysis were performed as in Figure 1.
(B) RNA decay of selected mRNAs in P19 cells transfected as indicated (see Figure S2 for analysis of more mRNAs). Transcripts levels were normalized to the level of Gapdh mRNA, which is relatively stable.
If UPF1 stimulates transition through the G1/S phase of the cell cycle by selectively promoting the decay of mRNAs encoding G1/S proliferation inhibitory factors, this predicts it would tend to not target mRNAs encoding G1/S proliferation activator factors. To test this, we analyzed the mRNAs encoding the eight proteins with well-established roles as direct activators of G1/S progression (Orford and Scadden, 2008) (Table S1) and found that none of them were significantly upregulated in response to depletion of UPF1 (Figure 2A). Instead, the mRNAs encoding five of these factors—CCND1, CCNE, CDC25A, CDK4, and MYC—were significantly downregulated when UPF1 was depleted (Figure 2A), consistent with our finding that UPF1 downregulation triggers reduced cell proliferation (Figures 1I and S1H). We conclude that NMD selectively targets mRNAs encoding G1/S inhibitor proteins, thereby providing a possible mechanism by which UPF1 promotes proliferation.
NMD Selectively Degrades mRNAs Encoding Neural Differentiation Factors
We postulated that an additional mechanism by which NMD promotes the undifferentiated cell state is by degrading mRNAs encoding differentiation factors. We focused our analysis on neural differentiation factors since deficiencies in NMD cause intellectual disability (Tarpey et al., 2007). Only well-established neural differentiation factors were selected, including those acting in neural signaling pathways, transcription factors that reprogram cells into neurons, and downstream effectors that have been shown to have essential roles in neural differentiation and/or specification (Table S2). We found that of the 29 neural differentiation factors that fulfill these criteria, 23 are encoded by mRNAs harboring known NMD-inducing features (Table S2), 19 of which were significantly upregulated in response to UPF1 depletion in P19 cells (Figure 2A). At least 16 of these 19 were stabilized by NMD depletion, based on mRNA half-life analysis in P19 cells (Figures 2B and S2A), but note that this is a conservative estimate, as this assay does not always detect direct NMD targets (Chan et al., 2007). To test whether this was a selective property, we next examined whether mRNAs encoding anti-neural differentiation factors were also targeted by NMD. We found that 4 of 18 factors with well-defined roles in repressing neural differentiation and/or maturation had an NMD-inducing feature and were significantly upregulated in UPF1-depleted cells (Figure 2A and Table S3). We examined the half-life of two of these mRNAs, Lefty1 and Smad1, and found that neither was stabilized upon UPF1 depletion, suggesting they are not direct NMD targets (Figure S2B). Taken together, these results provide evidence that NMD preferentially degrades transcripts encoding neural differentiation factors. This raised the possibility that NMD promotes the undifferentiated cell state through this property, a possibility we explore below.
NMD Represses Neural Differentiation by Targeting the TGF-β Signaling Pathway
A well-established mechanism that promotes neural differentiation is repression of the TGF-β/BMP signaling pathway (Seuntjens et al., 2009). This was of interest in light of our finding that several of the mRNAs targeted for decay by UPF1 in P19 cells encode TGF-β/BMP signaling inhibitors: SMURF1, SMURF2, SMAD6, and SMAD7 (Figures 2 and S2A). These mRNAs were also upregulated in response to UPF1 knockdown in mNSCs (Figure 3A). mNSCs lacking another NMD factor, UPF3B, also upregulated Smad6 and Smad7 mRNA, as well as other mRNAs (Figure S3A), providing strong evidence these are direct NMD targets. Since UPF1 targets these mRNAs for decay and they encode negative regulators of TGF-β/BMP signaling, this raised the possibility that UPF1 promotes TGF-β signaling pathway. In support of this hypothesis, we found that UPF1 depletion inhibited TGF-β signaling, as shown by the decreased expression of Smad2 and the TGF-β signaling target genes Cdx4 and Lhx1 (Liu et al., 2011) (Figure 3B). UPF1 depletion also decreased the level of phosphorylated SMAD2 (Figure 3C), a hallmark of TGF-β signaling (Massague and Xi, 2012). To further test the hypothesis that UPF1 promotes TGF-β signaling, we prevented the downregulation of UPF1 expression that normally occurs during neural differentiation by expressing modest levels of UPF1 from an expression vector and found that this reduced the decrease in phospho-SMAD2 levels that normally accompanies neural differentiation (Figure S3B). Together, these data indicated that UPF1 promotes TGF-β signaling, thereby providing a potential molecular pathway by which UPF1 controls neural differentiation.
Figure 3. UPF1 Represses Neural Differentiation by Targeting the TGF-β Signaling Pathway.

(A–C) UPF1 promotes TGF-β signaling. (A) qPCR analysis of mRNAs encoding TGF-β signaling inhibitors in mNSCs transfected with Upf1 siRNA (siUpf1) and Luc siRNA (siLuc), the latter of which was given a value of 1. (B) TGF-β target genes analyzed as in panel A. (C) Western blot analysis of P19 cells treated as in panel A and quantified as in Figure 1E.
(D) Model: UPF1 dictates lineage-specific differentiation events through its ability to promote TGF-β signaling.
(E) Smad7 promotes neural differentiation. qPCR analysis of P19 cells with a shRNA against Smad7 (shSmad7) or a shRNA control vector (shRNA-C). mRNA levels are relative to cells transfected with shRNA-C and cultured without RA, which were given a value of 1.
(F, G) Smad7 mRNA is destabilized through its NMD-inducing features in the 5′ and 3′ UTR regions. RNA half-life analysis of Tet-off HeLa cells transfected with a TRE-driven β-globin reporter harboring the indicated regions of Smad7 (see Extended Experimental Procedures for details).
(H, I) UPF1 promotes TGF-β signaling and inhibits neural differentiation by targeting Smad7 mRNA. mRNA levels in panel I are relative to cells transfected with siLuc/shRNA-C, which were given a value of 1. qPCR analysis of P19 cells transfected as indicated.
(J) UPF1 promotes mesodermal differentiation by targeting Smad7 mRNA. qPCR analysis of Brachyury (T) and Goosecoid (Gsc) mRNA in P19 cells incubated and transfected the agents indicated. mRNA levels are relative to cells transfected with siLuc/shRNA-C, which were given a value of 1.
Quantification and statistical analysis for all data panels was done as in Figure 1, unless otherwise noted.
Since the mRNA encoding the TGF-β inhibitor, SMAD7, was the most strongly upregulated mRNA in response to UPF1 knockdown (Figure 2A), we deemed it a good candidate to act in a NMD-based circuit to control neural differentiation. In this proposed circuit, Smad7 mRNA is stabilized by NMD downregulation, which leads to increased SMAD7 protein level and, as a consequence, repressed TGF-β signaling, leading to neural differentiation (Figure 3D). The existence of this NMD-Smad7 circuit was supported by the following: First, depletion of UPF1 increased the level of SMAD7 protein in P19 cells (Figure 3C). Second, depletion of SMAD7 in P19 cells inhibited their ability to undergo neural differentiation (Figure 3E), consistent with past studies that have shown that SMAD7 promotes neural differentiation (Ozair et al., 2013). Third, several lines of evidence indicated that Smad7 mRNA is directly targeted for decay by NMD: (i) Smad7 mRNA was upregulated in response to UPF1 depletion in both P19 (Figure 2A) and mNSC cells (Figure 3A), (ii) Smad7 mRNA was strongly stabilized by UPF1 knockdown in P19 cells (Figure 2B), (iii) Smad7 mRNA was upregulated in response to loss of the NMD factor UPF3B (Figure S3A), and (iv) Smad7 possesses three putative features that are capable of eliciting NMD: an uORF in the 5′ UTR, a long 3′ UTR, and an intron in the 3′ UTR (see Introduction and Table S2). To assess their role, we made use of a tetracycline (tet)-regulated vector system that allows one to identify destabilizing cis elements by virtue of their ability to destabilize the normally stable β-globin mRNA (Singh et al., 2008). We independently sub-cloned the Smad7 5′ UTR and 3′ UTR upstream and downstream, respectively, of the β-globin coding region in this vector and found that both greatly destabilized β-globin mRNA, an effect that was partially reversed when Upf1 levels were depleted (Figures 3F and 3G). This verified that Smad7 mRNA is an NMD target and it indicated that it is downregulated by NMD by virtue of features in both its 5′ and 3′ UTR.
We performed a rescue experiment to directly address whether Smad7 acts in a functional circuit downstream of NMD. Using a modest dose of Smad7 shRNA, we largely prevented the upregulation of SMAD7 that normally occurs in response to NMD repression during neural differentiation (Figure 3H). We found that this partially rescued TGF-β signaling, as measured with the downstream effectors Cdx4 and Lhx1 (Figure 3H), and largely prevented neural differentiation, as measured with the neural markers Nestin and Tubb3 (Figure 3I). We also tested whether overexpression of UPF1 had the reciprocal affect, but observed no change in Smad7 mRNA levels (Figure S3C), implying that UPF1 is not rate limiting for NMD in P19 cells. Since there is evidence that SMAD7 not only promotes neural differentiation but also inhibits cell proliferation (Briones-Orta et al., 2011), we also assessed whether SMAD7 has a role in NMD’s pro-proliferation function. We found that knockdown of SMAD7 did not significantly rescue the effect of NMD on cellular proliferation in P19 cells (Figures S3D, S3E, and S3F), suggesting that NMD regulates proliferation independently of SMAD7. We conclude that SMAD7 participates with NMD in a circuit that specifically acts on neural differentiation, not cellular proliferation (Figure 3D).
Given that UPF1 promotes TGF-β signaling, this raised the possibility that UPF1 might stimulate mesoderm differentiation, which is stimulated by TGF-β signaling (Nakaya et al., 2008). Indeed, we found that UPF1 knockdown reduced the ability of P19 cells to differentiate down the mesoderm lineage (in response to Activin), as assessed using the mesodermal markers Brachury (T) and Goosecoid (Gsc) (Nakaya et al., 2008) (Figure 3J). This repression of mesodermal differentiation was reversed by preventing the upregulation of SMAD7 that normally occurs in response to UPF1 depletion (using low-dose Smad7 shRNA; Figure 3J). Together, these data support the notion that UPF1/SMAD7 circuit acts through TGF-β signaling as a binary switch to control whether precursor cells differentiate down the neural vs. mesoderm cell lineage (Figure 3D).
A NMD-miRNA Circuit that Influences Cell Fate
We previously reported that UPF1 is a direct target of miR-128, a brain-enriched miRNA expressed in neurons in the cortex and hippocampus in vivo whose expression is dramatically upregulated during neural differentiation and maturation in vitro (Smirnova et al., 2005; Bak et al., 2008; Bruno et al., 2011). Coupled with the results described above, this raised the possibility that miR-128 serves to repress UPF1 expression in order to drive neural precursor cells to undergo differentiation and maturation (Figure 4A). Consistent with this possibility, miR-128 and Upf1 RNA levels are inversely expressed during neuron maturation and differentiation in vitro and during brain development in vivo (Figures 1A and S1A) (Bruno et al., 2011). To directly test this hypothesis, we first performed a rescue experiment in which we asked whether preventing the Upf1 downregulatory response that normally occurs when miR-128 is induced is sufficient to block neural differentiation. Indeed, we found that when Upf1 levels were maintained at pre-treatment levels with an Upf1 expression vector, that this largely inhibited miR-128-induced neural differentiation of P19 cells (Figure S4A). Since miR-128 promotes neural differentiation, this predicts it would also inhibit proliferation. Gain-of-function evidence for this was the finding that ectopic expression of miR-128 inhibited cellular proliferation and inhibited cell cycle progression through G1/S (Figures S4B and C). For a loss-of-function approach, we engineered a miR-128 decoy to inhibit miR-128 function (Figure S4D. This miR-128 decoy, which inhibited P19 cells from undergoing neural differentiation in response to RA (Figure S4E), also inhibited the blockade in cell proliferation that normally accompanies neural differentiation (Figure S4F). These rescue experiments showed that rescuing Upf1 expression in miR-128 mimic-treated cells reversed the cell proliferation block in the G1/S transition (Figures S4C and S4G). Taken together, these data indicated that (i) miR-128 promotes neural differentiation; (ii) miR-128 inhibits cellular proliferation at the G1/S transition, (iii) miR-128 acts, at least in part, through UPF1 to mediate these actions (Figure 4A).
Figure 4. A Post-transcriptional Circuit that Influences Differentiation vs. Proliferation Decisions.

(A) Model: miR-128 and UPF1 oppose each other in a circuit that controls neural differentiation and proliferation.
(B) Taqman-qPCR analysis of miR-128 levels in P19 cells, normalized against U6 snRNA. miR-128 levels are relative to cells treated the negative control, EtOH/siLuc, which had a background PCR signal (N.D.) that was assigned a value of “1” to provide a conservative estimate of miR-128 induction in response to the other treatments.
(C) Conservation of putative miRNA targets sites in the Upf3b 3′ UTR. Has, Homo sapien; Mmu, Mus musculus; Ptr, Pan troglodytes; Mml, Macaca mulatta; Ocu, Oryctolagus cuniculus; Gga, Gallus gallus; Xtr, Xenopus tropicalis.
(D) Luciferase expression from the pMiR-Luc-3B reporter harboring the full-length Upf3b 3′ UTR cotransfected into HeLa cells with the indicated miRNA mimic or the negative-control mimic (miR-C).
(E) Left: qPCR analysis of HeLa cells transfected as indicated. Middle and right: Western blot analysis of P19 cells with a miR-9 inhibitor (miR-9 inh) or negative control inhibitor (miR-C Inh), quantified as in Figure 1E.
(F) Model: NMD and neurally expressed miRNAs mutually suppress each other, which serves to lock in a given cell state.
(G) Repression of NMD induces NMD-inhibitory miRNAs. Taqman-qPCR analysis of mNSCs (wild type (WT) on the left; WT and Upf3b-null on the right) transfected with the indicated siRNAs and miRNA mimics.
Quantification and statistical analysis of all data panels was done as in Figure 1, unless otherwise noted.
A Self-Reinforcing NMD-miRNA Feedback Control Circuit
Our finding that UPF1 downregulation promotes neural differentiation and maturation (Figures 1G and 1H), raised the possibility that this UPF1 downregulatory response is a necessary prerequisite for the dramatic induction of miR-128 expression that occurs during neural differentiation and maturation (Bruno et al., 2011). In other words, we hypothesized that not only does miR-128 negatively regulate UPF1, but UPF1 negatively regulates miR-128 (Figure 4A). In support, we found that depletion of UPF1 was sufficient to strongly induce miR-128 in P19 cells (Figure 4B). This induction was largely prevented by the TGF-β signaling inducer Activin (Figure 4B), suggesting that miR-128 is induced as a result of repression of TGF-β signaling. This was further supported by the finding that incubation with the TGF-β inhibitor, TGF-I (SB431542) (Halder et al., 2005), was sufficient to strongly induce miR-128 expression (Figure 4B). This data suggest the existence of a self-reinforcing negative-feedback circuit (Figure 4A and see Discussion).
We screened other neurally expressed miRNAs to determine whether they also target NMD factors. Figure S4I shows that several neurally expressed miRNAs are predicted to target NMD factors, based on using the miRNA target prediction programs MicroCosm, TargetScan and miRanda-mirSVR. We empirically tested the four miRNAs predicted to target the NMD gene, UPF3B (Figure S4I), since mutations in this gene cause intellectual disability (Tarpey et al., 2007). We found that three of four of these miRNAs—miR-9, -124, and -128—repressed luciferase expression from a reporter harboring the UPF3B 3′ UTR (Figures 4C and 4D). We tested miR-9 further because of the abundant evidence it promotes neural differentiation (Sun et al., 2013) and found that the miR-9 mimic also downregulated endogenous UPF3B mRNA level and a sequence-specific miR-9 inhibitor upregulated endogenous UPF3B protein (Figure 4E).
Given that miR-128 expression is repressed by NMD (Figure 4F), we asked whether miR-9 and miR-124 are regulated in this manner as well. In support, we found that depletion of UPF1 upregulated the expression of not only miR-128, but also miR-9 and miR-124 (Figure 4G). To distinguish between these miRNAs being regulated by UPF1 specifically or by NMD in general, we examined the effect of loss of another NMD factor: UPF3B. MiR-9 and -128 were upregulated in Upf3b-null mNSCs (Figure 4G), which together with their induction in response to depletion of UPF1 strongly suggests they are negatively regulated by the NMD pathway. In contrast, miR-124 was not upregulated in Upf3b-null mNSCs, suggesting that miR-124 is either specifically regulated by UPF1 or it is regulated by an Upf3b-independent branch of the NMD pathway (Chan et al., 2007; Huang et al., 2011). Together, these results support a model in which miR-128 and other neurally expressed miRNAs participate in an NMD-driven regulatory circuit that dictates whether a neural precursor cell remains in an undifferentiated, proliferative state or terminally differentiates (Figure 4A). Because NMD and the miRNAs that operate in this circuit are mutually repressive (Figure 4F), this circuit “locks in” either the undifferentiated or differentiated cell state, depending on the input signal (see Discussion).
Conservation of the NMD-miRNA Regulatory Circuit
We examined whether the UPF1/miR-128 regulatory circuit is conserved in X. laevis. In support of this notion, the components of the circuit are conserved: (i) miR-128 is identical in sequence in X. laevis and mammals (Bruno et al., 2011), (ii) the miR-128 seed-sequence complementary binding region in the 3′ UTR of X. laevis upf1 and mammalian UPF1 are identical (Bruno et al., 2011), and (iii) the UPF1 protein sequence is >90% identical in Xenopus and mammals (Figure S5A). In further support, we found that upf1 mRNA level decreases during the development of the X. laevis presumptive neural tissue (the anterior ectoderm region) in a pattern inversely correlated with the induction of miR-128 (Bruno et al., 2011), just as Upf1 mRNA levels do during mouse brain development (Figures S5B and S5C). This decrease in upf1 mRNA levels coincides with an increase in all the direct NMD target transcripts that we examined—atf3, axin2, dkk1, smad7, and cdkn1a—during both X. laevis and mouse neural development (Figures S5B, S5C, and data not shown). Coupled with our previous finding that ectopic expression of miR-128 in X. laevis embryos downregulates NMD, as judged by assessing X. laevis NMD target transcripts (Bruno et al., 2011), these data strongly suggest that the UPF1/miR-128 circuit is conserved and regulated during anterior ectoderm embryonic development in X. laevis.
To assess whether the magnitude of NMD is depressed during X. laevis neural development, we turned to an in vitro system in which the mRNA encoding the neural inducer Noggin (a potent TGF-β/BMP inhibitor) is microinjected into the animal pole region of two-cell embryos to promote their differentiation into neural tissue when isolated at the late blastula stage and cultured in vitro (Lamb et al., 1993). We found that Noggin treatment dramatically reduced Upf1 mRNA levels and increased the levels of direct NMD target transcripts atf3, axin2, smad7 and cdkn1a (Figure 5A and data not shown), thereby recapitulating the molecular event occurring during the in vivo development of the anterior ectoderm region (Figures S5B and S5C) and providing evidence that the magnitude of NMD is repressed during X. laevis neural development. To examine the specificity of this response, we injected the mRNA encoding constitutively activated BMP receptor (CABR), which has the opposite effect: it promotes epidermal differentiation and represses neural differentiation (Suzuki et al., 1997). As expected, this treatment induced BMP-responsive genes and the epidermal differentiation marker keratin, but not neural markers (Figure 5B). Interestingly, Upf1 mRNA expression was strongly upregulated by this epidermal differentiation protocol (Figure 5B), indicating that epidermal differentiation induces the opposite upf1 response as compared to neural differentiation (Figure 5A). miR-128 expression was reduced under epidermal differentiation conditions (Figure S5D), providing further evidence for an opposite response. We conclude that the repression of NMD is a conserved and specific response that occurs during neural development.
Figure 5. Conservation of the UPF1-miR-128 Regulatory Circuit.

(A, B) qPCR analysis of isolated X. laevis ectoderm tissue derived from embryos injected with noggin (nog) and constitutive activated bmp receptor (cabr) mRNA to induce neural and epidermal differentiation. β-galactosidase mRNA serves as the injection control. smad7 and axin2 are NMD target transcripts. Keratin is an epidermal (Epi) marker. The muscle (m)-actin mesoderm marker is not detectable (N.D.), indicating no mesodermal tissue contamination.
(C–G) Evidence that miR-128 drives X. laevis neural differentiation by repressing UPF1 levels. (C) Diagram depicting the target protector (TP) morpholinos (MO) that prevent miR-128 binding to the UPF1 3′ UTR and the upf1 MO that blocks UPF1 translation. (D) qPCR analysis of isolated ectodermal tissue derived from embryos injected with the MOs indicated. (E) Luciferase analysis of embryos injected with the indicated molecules and cultured until stage (st) 12 (TP-C is a negative control TP MO). (F) Western blot analysis of isolated X. laevis ectoderm tissues derived from embryos injected with the indicated morpholinos (5 embryos per samples, normalized against β-Actin). (G) qPCR analysis of isolated X. laevis ectoderm tissues treated as in panel F.
(H) Model: conservation of the UPF1-miR-128 regulatory circuit.
Quantification and statistical analysis of all data panels was performed as in Figure 1.
To assess the functional relevance of this NMD downregulatory response, we manipulated Upf1 levels in X. laevis embryos. First, we inhibited Upf1 expression by injecting two-cell embryos with a morpholino (MO) complementary with the translation initiation region of upf1 mRNA (Figure 5C). Consistent with the ability of MOs to only block translation, the Upf1 MO decreased Upf1 protein level, not upf1 mRNA level (Figures 5D and S5E), which led to reduced NMD magnitude, based on the upregulation of 2 NMD target transcripts we tested: axin2 and smad7 (Figure 5D). The upf1 MO also increased the expression of neural markers (Figure 5D), providing evidence that downregulation of Upf1 is sufficient to initiate the early stages of neural differentiation in X. laevis, just we showed it does in mammalian cells (Figure 1G and 1H). While X. laevis embryos treated with the upf1 MO were viable in early stages, at the late gastrula stage they exhibited dose-dependent lethality (Table S4). Lethality at the gastrula stage was also elicited by modest overexpression of UPF1 (Table S4). Together, these results suggested that while the Upf1 downregulatory response promotes X. laevis neural -differentiation, its expression must be fine-tuned to allow for the survival and development of early X. laevis embryos.
To investigate whether the UPF1 downregulatory response that occurs during X. laevis presumptive neural tissue development (Figure S5C) promotes neural differentiation just as it does in mammalian cells (Figures 1G and 1H), we elected to use a strategy that interferes with the ability of neurally induced miR-128 to downregulate UPF1. Thus, we designed 2 overlapping MOs that compete with miR-128 for binding to the upf1 3′ UTR (Figure 5C). These upf1 target protectors (TPs) blocked the ability of miR-128 to regulate an artificial miR-128 target substrate, pLmiR-xU3m, but not a mutant version with a debilitated miR-128-binding site (Figure 5E). We next examined whether the upf1 TPs inhibited the downregulation of UPF1 that normally occurs during X. laevis development and found that, indeed, both TPs increased upf1 mRNA and Upf1 protein levels in the anterior ectoderm region of stage-19 embryos (Figure 5F and data not shown).
The ability of the upf1 TPs to prevent the downregulation of Upf1 that normally occurs during neural development allowed us to ask whether this Upf1 downregulatory response has the same role in neural maturation and proliferation in X. laevis embryonic development as it does in mammalian neural cells. We found that both upf1 TPs reduced the expression of neural markers and both upregulated proliferation markers (Figure 5G), providing molecular evidence that the downregulation of UPF1 is required for terminating proliferation and inducing neuronal differentiation during neural development. To morphologically evaluate the effect of UPF1 modulation, we performed unilateral injections in 2 cells at the 4-cell embryo stage. As shown in Figure 6A, injection of the upf1 TP elicited increased Upf1 protein expression in the side injected, as demonstrated by immunohistochemical analysis (particularly evident in the anterior region). Consistent with our finding that Upf1 promotes proliferation in mammalian cells (Figures 1I–L and S1H), we found that the side injected with the upf1 TP exhibited tissue expansion (Figure 6A). This was likely the result of increased cellular proliferation, based on finding a considerably wider band of BrdU labeling on the upf1 TP-injected side relative to the control side (Figure 6B). The upf1 TP-injected side exhibited considerable cell proliferation in all epidermal regions, while the uninjected side only exhibited high proliferation in the anterior and neural fold edge areas. The upf1 TP-injected side also exhibited repressed formation of neural tissues, including complete absence of lens and cement gland in the anterior region of embryos, as judged by whole-mount immuno-staining with the neural-marker Ncam (Figures 6C and D). As further evidence of repressed neural differentiation, immunofluorescence analysis showed that the particular regions of embryos that had increased Upf1 staining in response to upf1 TP injection were the regions with decreased neural differentiation, as judged by Ncam staining (Figure 6E). Reduced Ncam staining was most prominent in the dorsal region of the neural tube (Figure 6E).
Figure 6. The UPF1/miR-128 Circuit Controls X. laevis Cell Proliferation and Differentiation.

(A, B) miR-128 inhibits X. laevis cellular proliferation by repressing UPF1. (A) St 33 embryos stained for UPF1 expression (brown) unilaterally injected with a MO blocking miR-128 binding to the upf1 3′ UTR (TP-1 [see Figure 5C]). The TP-1 injected side had elevated UPF1 levels and more extensive tissue expansion (white arrow-head) than the non-injected side (similar results were obtained with TP-II [data not shown]). (B) BrdU labeling of embryos unilaterally injected as in panel A (red denotes BrdU-labeled cells). Increased cell proliferation was observed on the TP-II injected side.
(C–E) miR-128 promotes X. laevis neural differentiation by repressing UPF1. (C) Diagram of embryo injected with upf1 TPs. (D) St 33 (left) and st 25 (right) embryos unilaterally injected and stained for Ncam (Red) and Upf1 (Brown) expression. The side injected with upf1 TPs had greater Upf1 expression/tissue growth (yellow asterisks) and lower Ncam expression (yellow arrow-heads) than the non-injected side. (E) Dorsal-ventral cross-section of a st 25 embryo unilaterally injected and stained for Upf1 (green) and Ncam (red) expression.
(F, G) Upf1 promotes neural proliferation. (F) St 25 (left) and st 28 (right) embryos unilaterally injected at the 4-cell stage with the upf1 MO (Figure 5C) and stained for Upf1 expression (brown). The upf1 MO-injected side had lower UPF1 expression (white arrow-heads) and failed to expand (red asterisks) as much as the non-injected side. (G) Anterior-posterior cross section of a st 28 embryo unilaterally injected and stained for Upf1 (green) and Ncam (red) expression. The upf1 MO-injected side had lower Upf1 expression, higher Ncam expression, and disorganized neural tissue (white arrow-head).
An, anterior; b, brain; c.g., cement gland; n.f., neural fold; n.t., neural tube; o.c., optical cup; po: posterior; s.c., spinal cord.
As a reciprocal test, we examined whether depressing UPF1 levels caused the converse effect: decreased cell proliferation and increased neural differentiation. Indeed, we found that the upf1 MO triggered tissue shrinkage on the injected side (Figure 6F), consistent with decreased proliferation, and it increased Ncam staining, particularly in the regions with decreased Upf1 staining, such as the posterior region of the spinal cord (Figure 6G). The upf1 MO also reduced the size of the spinal cord and disrupted the organization of the neural tissue, which normally form stacked, tightly patterned structures (Figure 6G). Taken together, these results indicated that Upf1 has a conserved role in promoting cellular proliferation and that its downregulation is required for X. laevis neural cells to exit the cell cycle and undergo differentiation.
DISCUSSION
The mechanisms underlying the decision whether an immature cell remains in an undifferentiated, proliferative cell state or commits to the post-mitotic differentiated cell state is an intriguing biological problem. In this paper, we provide evidence that this decision is controlled by an elaborate post-transcriptional circuit revolving around the NMD RNA degradation pathway (Figure 7). In particular, our results support the notion that the undifferentiated, stem-like cell state is stabilized by NMD’s propensity to rapidly degrade mRNAs encoding pro-differentiation factors and proliferation inhibitors transcribed from genes not fully repressed by transcriptional mechanisms (Figures 2 and S2). In response to neural differentiation signals, NMD is downregulated (Figures 1A–C and S1A–C), which stabilizes these mRNAs, allowing for neural differentiation (Figures 2B and S2A). In support of this model, we found that preventing the downregulation of the key NMD factor, UPF1, inhibited neural differentiation and maintained the proliferative state (Figures 1D–F, K, and L). Furthermore, knockdown of UPF1 using RNAi was sufficient to trigger neural differentiation, promote neural maturation, and inhibit the proliferation of pluripotent cells (Figures 1G and 1H). Together, our results demonstrate that NMD is a crucial post-transcriptional mechanism controlling the switch between the pluripotent and differentiated cell states.
Figure 7.
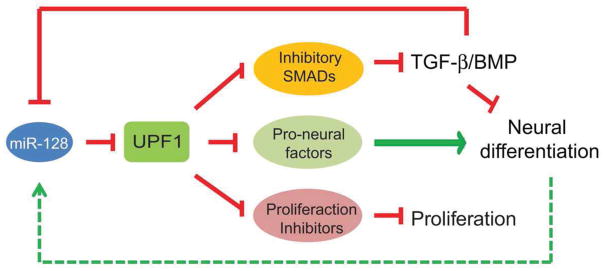
Model: A Post-Transcriptional Switch that Controls Neural Stem Cell Fate
Our finding that NMD acts through the TGF-β signaling pathway to maintain the undifferentiated cell state (Figure 3) mechanistically connects the well-studied TGF-β signaling pathway with a post-transcriptional mechanism. Given the wealth of evidence that a blockade of TGF-β signaling is required for neural differentiation (Watabe and Miyazono, 2009), our discovery that NMD strongly promotes TGF-β signaling provides a mechanism by which NMD blocks neural differentiation. In particular, we found that the NMD downregulatory response triggered by neural differentiation cues cause stabilization of Smad7 mRNA, which, in turn, leads to increased levels of SMAD7 protein, inhibited TGF-β signaling, and, consequently, the induction of neural differentiation (Figures 3 and S3A–B). To our knowledge, this is the first NMD circuit shown to control a specific biological outcome in higher eukaryotes. This is important since it has not been clear whether the ability of NMD to alter the levels of normal transcripts is physiologically significant. The many defects that have been described occurring in NMD-deficient organisms (Vicente-Crespo and Palacios, 2010) could, in principal, be entirely the result of toxicity emanating from the expression of abnormal proteins translated from aberrant PTC-containing mRNAs (e.g., generated by alternative splicing) that which would accumulate if NMD were not functioning (Chang et al., 2007; Nicholson et al., 2010)). Complementing our discovery of a NMD circuit that operates in mammals, it was recently shown that the ability of NMD to destabilize the mRNA encoding the copper transporter CTR2 is responsible for increasing the sensitivity of Saccharomyces cerevisiae to copper toxicity (Wang et al., 2011b).
Another non-mutually exclusive mechanism by which NMD may promote the undifferentiated cell state is by stimulating cell proliferation. Indeed our loss-of-function studies performed in both mouse cell lines and X. laevis embryos indicated that UPF1 is required for normal cell growth (Figures 1I–L, S1H, 6A, 6B, 6D, and 6F). This is consistent with previous loss-of-function studies that obtained evidence that NMD promotes cell proliferation (Avery et al., 2011; Weischenfeldt et al., 2008). Interestingly, studies have differed as to the phase of the cell cycle that they assign as being targeted by NMD. D. melanogaster cell lines depleted of various NMD factors were shown to be arrested at the G2/M phase of the cell cycle (Rehwinkel et al., 2005), depletion of UPF1 was found to inhibit the growth of HeLa cells at S phase (Azzalin and Lingner, 2006), and we found that depletion of UPF1 in P19 cells inhibited G1/S progression (Figures 1L and S1H). While the data from these loss-of-function studies support the notion that NMD promotes proliferation, an alternative possibility is that loss of NMD causes general toxicity, leading to depressed proliferation merely as a downstream consequence. We obtained two lines of evidence supporting a role for UPF1 in proliferation, rather than merely being required for cell survival. First, our gain-of-function studies showed that modest overexpression of UPF1 increased cellular proliferation in both mouse P19 cells and X. laevis embryos (Figures 1J–L, S1H, 6A, and 6B). Second, we showed that NMD selectively decreases the levels of mRNAs encoding proliferation inhibitor proteins, many of which we obtained evidence are direct NMD targets (Figures 2 and S2). This suggested that NMD not only promotes proliferation but it does so by acting directly on proliferation regulators.
We demonstrated that depletion of the NMD factor UPF1 was sufficient to both inhibit proliferation and trigger cellular neural differentiation in both mouse cells in vitro and X. laevis embryos in vivo (Figures 1G–I, 1L, 5D, 6F, 6G, and S1H). This suggests that the UPF1 downregulatory response that normally occurs during neural development is a critical rate-limiting step for neural differentiation (Figures 1A and S1A). Recently, another case in which withdrawal of a single factor triggers neural differentiation was reported: knockdown of the RNA-binding protein, PTB, was shown to reprogram differentiated non-neuronal cells into neurons (Xue et al., 2013). Interestingly, we identified other NMD factors—in addition to UPF1—that are downregulated during neural maturation (Figure 1A), raising the possibility that their downregulation may also contribute to neural development. However, we do not know whether these other factors are rate limiting for NMD in neural stem or progenitor cells. Indeed, a previous study showed that most NMD factors are not rate limiting for NMD in HeLa cells (Huang et al, 2011). Another consideration is that NMD is a branched pathway, each branch of which degrades different sets of mRNA substrates. Two of the NMD factors that we found were downregulated during neural maturation—UPF2 and UPF3B (Figure 1A)—are required for specific branches of the NMD pathway (Gehring et al., 2005; Chan et al., 2007; Huang et al., 2011). Thus the downregulation of these two NMD factors during neural maturation would be predicted to lead to stabilization of only a specific subset of NMD target mRNAs (assuming that UPF2 and UPF3B are rate limiting for NMD in neural precursor cells). Finally, we note that some NMD factors may have complex roles in which they promote some developmental steps and inhibit others. As a case in point, depletion of UPF3B was recently shown to inhibit the differentiation of neural progenitor cells (Jolly et al., 2013), while we obtained evidence that loss of UPF3B promotes the early differentiation of neural stem cells (Figure S1G). In the future, it will be important to determine whether modulation of specific NMD factors has clinical applications. Given that mutations in UPF3B—a gene essential for a branch of NMD—cause intellectual disability and are strongly associated with schizophrenia and autism in humans (Tarpey et al., 2007), this raises the possibility that modulation of the UPF3B-dependent branch of NMD could benefit patients with brain disorders.
We demonstrated that UPF1 functions in a conserved circuit with the miRNA, miR-128, in determining whether a cell proliferates or differentiates (Figures 4–6). A unique layer of regulation that we uncovered within this miR-128/UPF1 circuit is a negative feedback loop that we suggest stabilizes the output of the circuit. We found that UPF1 strongly represses miR-128 expression (Figures 4B and 4G), which coupled with the ability of miR-128 to repress UPF1 expression, creates mutually reinforcing negative feedback loops that would be predicted to form a bistable circuit (Figures 4A and F). In an undifferentiated cell, NMD is high, leading to suppressed miR-128 expression, which in turn perpetuates a high magnitude of NMD, thereby maintaining a stable undifferentiated cell state. In response to a neural differentiation signal that represses NMD, miR-128 is induced, which in turn further decreases the magnitude of NMD and reinforces miR-128 expression, thereby stabilizing the differentiated cell state. This circuitry also allows versatility since a neural differentiation signal whose primary action is to induce miR-128 rather than downregulate NMD (e.g., through repressed TGF-β signaling [Figure 4A]) would lead to the same outcome. We propose that this circuitry is reinforced by two other neurally expressed miRNAs: miR-9 and -124. We obtained evidence that, like miR-128, these two miRNAs repress the expression of NMD factors and are induced in response to repressed NMD (Figures 4C–E and G). In addition, both these miRNAs are primarily expressed in the nervous system and there is evidence that both regulate several events in neurons (Sun et al., 2013; Krichevsky et al., 2006). Another miRNA that may contribute to this regulation is miR-125, a neurally expressed miRNA that was recently shown to repress the expression of the NMD factor SMG1 (Wang et al., 2013) and promote the early neural specification of human embryonic stem cells (Boissart et al., 2012). Thus, there is growing constellation of miRNAs that are candidates to collaborate with miR-128 to repress NMD in neural precursor cells and thereby drive their differentiation.
In conclusion, our results support a model in which a conserved post-transcriptional circuit comprised of neural differentiation-inducing miRNAs, the TGF-β signaling pathway, and an RNA decay mechanism with selectivity for specific mRNAs, serves to help dictate the balance between stemness and differentiation. In the absence of any input, this circuit locks in the undifferentiated, proliferative cellular state. In response to neural differentiation signals, this circuit switches to a differentiation mode by stabilizing mRNAs that promote the non-proliferative, differentiated cell state. It will be of future interest to identify the nature of the input signals that switch this circuit between its two modes and whether approaches can be developed to modulate this circuit for the purposes of regenerative medicine.
EXPERIMENTAL PROCEDURES
Mammalian Cell Culture and Transfection
P19 cells were transiently transfected using Lipofectamine 2000 (Invitrogen). Unless otherwise noted, they were differentiated 8 hrs after transfection by culturing in the presence of RA (5×10⁻⁷ M) for 3 days. Primary mNSCs were isolated from E14 mouse brains and grown as neurospheres. They were differentiated by withdrawing the hormones, as described (Bruno et al., 2011; Yuan et al., 2011).
RNA, Luciferase, Protein Analysis, and Vectors
Total cellular RNA was isolated as described (Chan et al., 2007). qPCR analysis was done in triplicate as described (Chan et al., 2007). TaqMan-qPCR was performed using the TaqMan microRNA assay (Applied Biosystems). NMD activity was measured using the NMD reporter plasmids, pCI-NEO-WT PTC (−) and pCI-NEO-NS39 PTC (+), which both express Renilla luciferase (Boelz et al). They were cotransfected with pCI-NEO-FLY, a Firefly luciferase control plasmid, two times within a 24 h interval in P19 cells. To measure NMD activity using the tetracycline (tet) promoter-based NMD reporters β-PTC (+) or β-PTC (−) (Singh et. al., 2008), these plasmids were co-transfected into P19 cells with pTet.tTAK, which expresses the TRE activator tTA. The cells were incubated with doxycycline (which blocks tTA activity) for the times shown 3 days after treatment with RA or the diluent (EtOH) alone. The cells were treated with RA (5×10⁻⁷ M) 8 hrs after the second transfection. To determine RNA half-life of endogenous mRNAs, P19 cells were treated with Actinomycin D (5 μg/ml) 48 hours after transfection. To determine the effect of cloned mRNA sequences on RNA stability, we used a tetracycline promoter-based NMD reporter system previously described in Yamashita and Ohno, 2010 (Yamashita and Ohno, 2010). Western blot analysis was performed as described (Chan et al., 2007). Immunofluorescence analysis of P19 cells was performed following the Cell Signaling Technologies protocol. Microscopic analysis and quantification of co-localized protein intensity was calculated using the Leica Acquisition Software (LAS) Colocalization AF6000. Vectors are described in the Extended Experimental Procedures. All primers sequences are provided in Table S5.
Identification of NMD-inducing Features
The following criteria were used to identify transcript with NMD-inducing features from the Ensemble database: (i) uORF defined by a ATG start site that encodes at least 10 amino acids; (ii) a 3′ UTR at least 0.7 kb in length (based on the finding that >0.5 kb 3′UTR can trigger NMD [Singh et al. 2008]); (iii) an intron >55 nt from the 5′ end of the 3′UTR. We only considered transcripts defined as full length in the database; e.g., those with an initiator ATG, valid stop codon, no frameshifts within the main reading frame, and consensus splice sites.
Cell-Cycle and Cell Count Analyses
For cell count analysis, cell counts were made with Trypan Blue using a hemocytometer. For cell-cycle analysis, cells were stained with propidium iodide and analyzed by flow cytometry.
X. laevis Procedures
The preparation of X. laevis embryos, their microinjection, and their culture was performed as described (Uzgare et al., 1998). Whole embryo injections were performed at the two-cell stage. Unilateral injections were performed in 2 cells at the 4-cell stage. BrdU labeling was performed following the Abcam BrdU labeling kit protocol (Abcam). Whole-mount staining was performed as described (Becker and Gard, 2006).
Supplementary Material
Figure S1. Evidence that the NMD Downregulatory Response Terminates the Stem Cell Program and Induces Neural Differentiation
(A) qPCR analysis of the mouse brain cortex and the indicated cell lines treated as described in the Extended Experimental Procedures (n=3). The data show that Upf1 expression is repressed during cortical brain development and neural differentiation in vitro.
(B, C) The magnitude of NMD is repressed during neural differentiation. (B) qPCR analysis of known NMD target transcripts in P19 cells differentiated with RA, as described in the Experimental Procedure (n=3). (C) Luciferase expression from P19 cells transfected with either the PTC (+): pCI-Neo-NS39 or the PTC (−): pCI-Neo-WT Renilla luciferase-based NMD reporter vectors and co-transfected with the Firefly luciferase reporter, pCI-Neo-FLY, as a normalization control (Boelz et. al. 2006) (n=3). The elevation in PTC+ reporter levels is indicative of a decreased magnitude of NMD. It is not known why there is a modest decrease in PTC- reporter levels. See also Experimental Procedures and Figure 1B.
(D, E) Upf1 promotes the expression of stem cell markers. (D) Western blot analysis of P19 cells transfected with a UPF1 expression vector (Ev-Upf1) or the empty vector (Ev-C), as described in the Experimental Procedures. The quantification is the mean of three experiments, normalized against β-ACTIN; error bars represent standard deviation (SD). (E) Western blot analysis of P19 cells transfected with siRNAs against Upf1 (siUfp1) or luciferase (siLuc; the negative control). The quantification is the mean of three experiments, normalized against β-ACTIN; error bars represent standard deviation (SD).
(F) SMD downregulation does not promote neural maturation. qPCR analysis of mNSCs transfected with an shRNA construct against the essential SMD factor STAU1 (shStau1) (n=3). mNSCs transfected with the empty vector is the negative control; its mRNA levels are set to 1.
(G) qPCR analysis of mNSCs lacking the NMD factor UPF3B reveals these cells have elevated levels of neural maturation markers relative to littermate control mNSCs. The data are from mNSC lines derived from 2 Upf3b+/Y male mice and 2 Upf3b−/y male mice.
(H) Cell-cycle analysis of P19 cells treated and transfected as indicated (n=3) and in Figure 1L. Error bars represent SD.
For all data panels, statistical analysis was done using the paired Student’s t test (asterisks denote statistically significant differences; p < 0.05). Unless otherwise noted, error bars depict standard error mean (SEM). For all qPCR experiments, transcript levels were normalized to the level of L19 RNA.
Figure S2. UPF1 Destabilizes mRNAs Encoding Anti-Proliferation and Pro-neural Differentiation Factors
(A and B) qPCR analysis of P19 cells incubated with actinomycin D (5 μg/ml) for the times shown 48 hrs after the indicated siRNAs were transfected. Best-fitting mRNA decay kinetics were calculated using linear regression analysis. Transcripts levels were normalized to the level of Gapdh mRNA, which is relatively stable. Error bars depict SEM. Statistical analysis performed as in Figure S1A (n = 3).
Figure S3. The Upf1 Downregulatory Response Inhibits TGF-β Signaling and Stabilizes Neural mRNAs
(A) Likely direct NMD target mRNAs encoding pro-neural factors are upregulated in response to loss of the NMD factor UPF3B. qPCR analysis of Upf3b-null and littermate control mNSCs. The data are from mNSC lines derived from 2 Upf3b+/Y male mice and 2 Upf3b−/y male mice.
(B) Preventing the UPF1 downregulatory response during neural differentiation prevents TGF-β signaling downregulation, as measured by SMAD2 phosphorylation. Western blot analysis of P19 cells transfected and treated as shown (see Extended Experimental Procedures for details).
Quantification is the mean of three experiments, normalized against β-ACTIN; error bars depict SD.
(C) Overexpression of Upf1 does not significantly affect TGF-β signaling in undifferentiated P19 cells. qPCR analysis of the mRNAs encoding TGF-β downstream effectors (CDX4 and LHX1) and the TGF-β inhibitor, SMAD7, in P19 cells transfected with a UPF1 expression vector or empty vector. Statistical analysis was performed as in Figure S1A (n=3).
(D–F) Upf1 does not promote P19 cellular proliferation by destabilizing Smad7 mRNA. (D) Cell counting experiment performed on P19 transfected as in Figure 4H (n=6). (E, F) Cell-cycle analysis of P19 cells transfected as in panel D (n=3). Error bars depict SD.
For all data panels, statistical analysis was done using the paired Student’s t test (asterisks denote statistically significant differences; p < 0.05). Unless otherwise noted, error bars depict SEM. For all qPCR experiments, transcript levels were normalized to the level of L19 RNA.
Figure S4. MIR-128 Represses Cell Proliferation through its Ability to Repress UPF1 Expression
(A) Evidence that miR-128 promotes neural differentiation by repressing UPF1. qPCR analysis of P19 cells transfected with the miRNA mimics and expression vectors shown. Oct4 is a stem cell marker; Nestin and Tubb3 are neural maturation markers.
(B and G) Evidence that miR-128 inhibits neural cell proliferation by repressing UPF1. (B) Cell-cycle analysis of P19 cells transfected as in panel A (n=3). (G) Cell counting experiments performed on P19 transfected as in panel A (n=6).
(C–F) miR-128 inhibits the proliferation and promotes the neural differentiation of P19 cells. (C) Cell counting experiment performed in P19 cells transfected with the miRNA mimics shown (n=6). (D) Sequence and structure of miR-128 Decoy. (E) qPCR analysis of P19 cells transfected and treated as shown. The results indicate that the induction of miR-128 in response to the neural differentiation agent RA (Bruno et. al. 2011) contributes to neural differentiation. (F) Cell counting experiment performed in P19 cells transfected as in panel D (n=6).
(H) Neurally expressed miRNAs predicted to target NMD factors, based on using the following miRNA prediction programs: MicroCosm (score >15), Targetscan (Context+ score percentile >50), or MiRANDA (mirSVR score <−0.2). (Lewis et al., 2005; Griffiths-Jones et al., 2008; Betel et. al., 2010)
For all data panels, statistical analysis was done using the paired Student’s t test (asterisks denote statistically significant differences; p < 0.05). Unless otherwise noted, error bars depict SEM. For all qPCR experiments, transcript levels were normalized to the level of L19 RNA.
Figure S5. Upf1 is Conserved in Vertebrates
(A) Predicted UPF1 protein sequence deduced from cDNA sequences from the species shown. Identical amino acids are shown against green, whereas similar amino acids are shown against orange. The alignment was performed using Clustal W. Human, Homo sapien; mouse, Mus musculus; zebra fish, Danio rerio; frog, Xenopus tropicalis; chicken, Gallus gallus; fruit fly, Drosophila melanogaster; sea squirt, Ciona intestinalis; plant, Arabidopsis thaliana; and budding yeast, Schizosaccharomyces pombe (NP_002902.2, NP_001116301.1, NP_998639.1, XP_002938872.1, XP_418237.3, NP_572767, XP_002122130.1, NP_199512.2, and NP_593080.1, respectively).
(B and C) NMD targets are upregulated during neural maturation in both mice and frogs. qPCR analysis of Upf1 mRNA and NMD target mRNA levels in mouse brain and embryonic X. laevis anterior-ectodermal tissue. Mouse mRNA levels were normalized to the level of L19 mRNA. Xenopus mRNAs were normalized to the level of gapdh mRNA.
(D) The expression of miR-128 is upregulated in neuralized isolated ectoderm. Taqman-qPCR analysis of miR-128 levels in st. 19 X. laevis ectoderm tissue isolated from st. 12 embryos developed in vitro from two-cell embryos that were injected with the indicated RNAs, as described in the Experimental Procedures. miR-128 levels were normalized to U6 snRNA. Error bars depict SEM (n = 3).
(E) upf1 MO functions to blocked the translation of Upf1. Western blot analysis of Upf1 level in samples isolated from st. 12 X. laevis whole embryos that were injected with the indicated morpholinos or mRNAs at the cell stage embryos. β-Actin is the loading control.
Highlights.
The NMD/RNA decay factor, UPF1, promotes the undifferentiated cell state
UPF1 acts in a conserved circuit with specific miRNAs and TGFβ signaling components
Neural differentiation is promoted by UPF1 downregulation
Negative feedback loops stabilize the stem-like and differentiated cell states
Acknowledgments
We are grateful to Amy Sater (University of Houston) and Christopher Kinter (Salk Institute) for providing X. laevis embryos and expression vectors. We also thank Xiaoyan Liao (UCSD) for bioinformatic support and Jens Lykke-Anderson (UCSD) for providing NMD factor expression vectors and antiserum. Finally, we thank Wilkinson laboratory members, Madhuvanthi Ramaiah, Hye-won Song, and Mimi H. Phan (UCSD), for their valuable experimental assistance and intellectual contributions. This work was supported by the NIH grant GM-58595 and CIRM grant RB4-06345.
Footnotes
Publisher's Disclaimer: This is a PDF file of an unedited manuscript that has been accepted for publication. As a service to our customers we are providing this early version of the manuscript. The manuscript will undergo copyediting, typesetting, and review of the resulting proof before it is published in its final citable form. Please note that during the production process errors may be discovered which could affect the content, and all legal disclaimers that apply to the journal pertain.
References
- Avery P, Vicente-Crespo M, Francis D, Nashchekina O, Alonso CR, Palacios IM. Drosophila Upf1 and Upf2 loss of function inhibits cell growth and causes animal death in a Upf3-independent manner. RNA. 2011;17:624–638. doi: 10.1261/rna.2404211. [DOI] [PMC free article] [PubMed] [Google Scholar]
- Azzalin CM, Lingner J. The human RNA surveillance factor UPF1 is required for S phase progression and genome stability. Curr Biol. 2006;16:433–439. doi: 10.1016/j.cub.2006.01.018. [DOI] [PubMed] [Google Scholar]
- Bak M, Silahtaroglu A, Moller M, Christensen M, Rath MF, Skryabin B, Tommerup N, Kauppinen S. MicroRNA expression in the adult mouse central nervous system. RNA. 2008;14:432–444. doi: 10.1261/rna.783108. [DOI] [PMC free article] [PubMed] [Google Scholar]
- Becker BE, Gard DL. Visualization of the cytoskeleton in Xenopus oocytes and eggs by confocal immunofluorescence microscopy. Methods Mol Biol. 2006;322:69–86. doi: 10.1007/978-1-59745-000-3_6. [DOI] [PubMed] [Google Scholar]
- Boelz S, Neu-Yilik G, Gehring NH, Hentze MW, Kulozik AE. A chemiluminescence-based reporter system to monitor nonsense-mediated mRNA decay. Biochem Biophys Res Commun. 2006;349:186–191. doi: 10.1016/j.bbrc.2006.08.017. [DOI] [PubMed] [Google Scholar]
- Briones-Orta MA, Tecalco-Cruz AC, Sosa-Garrocho M, Caligaris C, Macias-Silva M. Inhibitory Smad7: emerging roles in health and disease. Curr Mol Pharmacol. 2011;4:141–153. [PubMed] [Google Scholar]
- Bruno IG, Karam R, Huang L, Bhardwaj A, Lou CH, Shum EY, Song HW, Corbett MA, Gifford WD, Gecz J, et al. Identification of a microRNA that activates gene expression by repressing nonsense-mediated RNA decay. Mol Cell. 2011;42:500–510. doi: 10.1016/j.molcel.2011.04.018. [DOI] [PMC free article] [PubMed] [Google Scholar]
- Chan WK, Huang L, Gudikote JP, Chang YF, Imam JS, MacLean JA, 2nd, Wilkinson MF. An alternative branch of the nonsense-mediated decay pathway. Embo J. 2007;26:1820–1830. doi: 10.1038/sj.emboj.7601628. [DOI] [PMC free article] [PubMed] [Google Scholar]
- Chang YF, Imam JS, Wilkinson MF. The nonsense-mediated decay RNA surveillance pathway. Annu Rev Biochem. 2007;76:51–74. doi: 10.1146/annurev.biochem.76.050106.093909. [DOI] [PubMed] [Google Scholar]
- Dostie J, Dreyfuss G. Translation is required to remove Y14 from mRNAs in the cytoplasm. Curr Biol. 2002;12:1060–1067. doi: 10.1016/s0960-9822(02)00902-8. [DOI] [PubMed] [Google Scholar]
- Gehring NH, Kunz JB, Neu-Yilik G, Breit S, Viegas MH, Hentze MW, Kulozik AE. Exon-junction complex components specify distinct routes of nonsense-mediated mRNA decay with differential cofactor requirements. Mol Cell. 2005 Oct;Jul;20(1):65–75. doi: 10.1016/j.molcel.2005.08.012. [DOI] [PubMed] [Google Scholar]
- Gong C, Kim YK, Woeller CF, Tang Y, Maquat LE. SMD and NMD are competitive pathways that contribute to myogenesis: effects on PAX3 and myogenin mRNAs. Genes Dev. 2009;23:54–66. doi: 10.1101/gad.1717309. [DOI] [PMC free article] [PubMed] [Google Scholar]
- Halder SK, Beauchamp RD, Datta PK. A specific inhibitor of TGF-beta receptor kinase, SB-431542, as a potent antitumor agent for human cancers. Neoplasia. 2005;7:509–521. doi: 10.1593/neo.04640. [DOI] [PMC free article] [PubMed] [Google Scholar]
- Huang L, Lou CH, Chan W, Shum EY, Shao A, Stone E, Karam R, Song HW, Wilkinson MF. RNA homeostasis governed by cell type-specific and branched feedback loops acting on NMD. Mol Cell. 2012;43:950–961. doi: 10.1016/j.molcel.2011.06.031. [DOI] [PMC free article] [PubMed] [Google Scholar]
- Huang L, Wilkinson MF. Regulation of nonsense-mediated mRNA decay. Wiley Interdiscip Rev RNA. 2012;3:807–828. doi: 10.1002/wrna.1137. [DOI] [PubMed] [Google Scholar]
- Jolly LA, Homan CC, Jacob R, Barry S, Gecz J. The UPF3B gene, implicated in intellectual disability, autism, ADHD and childhood onset schizophrenia regulates neural progenitor cell behaviour and neuronal outgrowth. Hum Mol Genet. 2013;22:4673–4687. doi: 10.1093/hmg/ddt315. [DOI] [PubMed] [Google Scholar]
- Karam R, Wengrod J, Gardner LB, Wilkinson MF. Regulation of nonsense-mediated mRNA decay: Implications for physiology and disease. Biochim Biophys Acta. 2012 doi: 10.1016/j.bbagrm.2013.03.002. [DOI] [PMC free article] [PubMed] [Google Scholar]
- Kim KM, Cho H, Kim YK. The upstream open reading frame of cyclin-dependent kinase inhibitor 1A mRNA negatively regulates translation of the downstream main open reading frame. Biochem Biophys Res Commun. 2012;424:469–475. doi: 10.1016/j.bbrc.2012.06.135. [DOI] [PubMed] [Google Scholar]
- Lamb TM, Knecht AK, Smith WC, Stachel SE, Economides AN, Stahl N, Yancopolous GD, Harland RM. Neural induction by the secreted polypeptide noggin. Science. 1993;262:713–718. doi: 10.1126/science.8235591. [DOI] [PubMed] [Google Scholar]
- Liu Z, Lin X, Cai Z, Zhang Z, Han C, Jia S, Meng A, Wang Q. Global identification of SMAD2 target genes reveals a role for multiple co-regulatory factors in zebrafish early gastrulas. J Biol Chem. 2011;286:28520–28532. doi: 10.1074/jbc.M111.236307. [DOI] [PMC free article] [PubMed] [Google Scholar]
- Massague J, Xi Q. TGF-beta control of stem cell differentiation genes. FEBS Lett. 2012;586:1953–1958. doi: 10.1016/j.febslet.2012.03.023. [DOI] [PMC free article] [PubMed] [Google Scholar]
- Melton C, Blelloch R. MicroRNA Regulation of Embryonic Stem Cell Self-Renewal and Differentiation. Adv Exp Med Biol. 2010;695:105–117. doi: 10.1007/978-1-4419-7037-4_8. [DOI] [PubMed] [Google Scholar]
- Nakaya K, Murakami M, Funaba M. Regulatory expression of Brachyury and Goosecoid in P19 embryonal carcinoma cells. J Cell Biochem. 2008;105:801–813. doi: 10.1002/jcb.21883. [DOI] [PubMed] [Google Scholar]
- Nicholson P, Joncourt R, Muhlemann O. Analysis of nonsense-mediated mRNA decay in mammalian cells. Curr Protoc Cell Biol. 2012;Chapter 27(Unit 27):24. doi: 10.1002/0471143030.cb2704s55. [DOI] [PubMed] [Google Scholar]
- Orford KW, Scadden DT. Deconstructing stem cell self-renewal: genetic insights into cell-cycle regulation. Nat Rev Genet. 2008;9:115–128. doi: 10.1038/nrg2269. [DOI] [PubMed] [Google Scholar]
- Ozair MZ, Noggle S, Warmflash A, Krzyspiak JE, Brivanlou AH. SMAD7 directly converts human embryonic stem cells to telencephalic fate by a default mechanism. Stem Cells. 2013;31:35–47. doi: 10.1002/stem.1246. [DOI] [PMC free article] [PubMed] [Google Scholar]
- Popp MW, Maquat LE. Organizing principles of Mammalian nonsense-mediated mRNA decay. Annu Rev Genet. 2013 Nov 23;47:139–65. doi: 10.1146/annurev-genet-111212-133424. [DOI] [PMC free article] [PubMed] [Google Scholar]
- Rehwinkel J, Letunic I, Raes J, Bork P, Izaurralde E. Nonsense-mediated mRNA decay factors act in concert to regulate common mRNA targets. RNA. 2005;11:1530–1544. doi: 10.1261/rna.2160905. [DOI] [PMC free article] [PubMed] [Google Scholar]
- Schweingruber C, Rufener SC, Zund D, Yamashita A, Muhlemann O. Nonsense-mediated mRNA decay - Mechanisms of substrate mRNA recognition and degradation in mammalian cells. Biochim Biophys Acta. 2013 doi: 10.1016/j.bbagrm.2013.02.005. [DOI] [PubMed] [Google Scholar]
- Seuntjens E, Umans L, Zwijsen A, Sampaolesi M, Verfaillie CM, Huylebroeck D. Transforming Growth Factor type beta and Smad family signaling in stem cell function. Cytokine Growth Factor Rev. 2009;20:449–458. doi: 10.1016/j.cytogfr.2009.10.005. [DOI] [PubMed] [Google Scholar]
- Singh G, Rebbapragada I, Lykke-Andersen J. A competition between stimulators and antagonists of Upf complex recruitment governs human nonsense-mediated mRNA decay. PLoS Biol. 2008;6:e111. doi: 10.1371/journal.pbio.0060111. [DOI] [PMC free article] [PubMed] [Google Scholar]
- Smirnova L, Grafe A, Seiler A, Schumacher S, Nitsch R, Wulczyn FG. Regulation of miRNA expression during neural cell specification. Eur J Neurosci. 2005;21:1469–1477. doi: 10.1111/j.1460-9568.2005.03978.x. [DOI] [PubMed] [Google Scholar]
- Sun AX, Crabtree GR, Yoo AS. MicroRNAs: regulators of neuronal fate. Curr Opin Cell Biol. 2013;25:215–221. doi: 10.1016/j.ceb.2012.12.007. [DOI] [PMC free article] [PubMed] [Google Scholar]
- Suzuki A, Kaneko E, Ueno N, Hemmati-Brivanlou A. Regulation of epidermal induction by BMP2 and BMP7 signaling. Dev Biol. 1997;189:112–122. doi: 10.1006/dbio.1997.8652. [DOI] [PubMed] [Google Scholar]
- Tani H, Torimura M, Akimitsu N. The RNA degradation pathway regulates the function of GAS5 a non-coding RNA in mammalian cells. PLoS One. 2013;8:e55684. doi: 10.1371/journal.pone.0055684. [DOI] [PMC free article] [PubMed] [Google Scholar]
- Tarpey PS, Raymond FL, Nguyen LS, Rodriguez J, Hackett A, Vandeleur L, Smith R, Shoubridge C, Edkins S, Stevens C, et al. Mutations in UPF3B, a member of the nonsense-mediated mRNA decay complex, cause syndromic and nonsyndromic mental retardation. Nat Genet. 2007;39:1127–1133. doi: 10.1038/ng2100. [DOI] [PMC free article] [PubMed] [Google Scholar]
- Uzgare AR, Uzman JA, El-Hodiri HM, Sater AK. Mitogen-activated protein kinase and neural specification in Xenopus. Proc Natl Acad Sci U S A. 1998;95:14833–14838. doi: 10.1073/pnas.95.25.14833. [DOI] [PMC free article] [PubMed] [Google Scholar]
- van der Heyden MA, Defize LH. Twenty one years of P19 cells: what an embryonal carcinoma cell line taught us about cardiomyocyte differentiation. Cardiovasc Res. 2003;58:292–302. doi: 10.1016/s0008-6363(02)00771-x. [DOI] [PubMed] [Google Scholar]
- Vicente-Crespo M, Palacios IM. Nonsense-mediated mRNA decay and development: shoot the messenger to survive? Biochem Soc Trans. 2010;38:1500–1505. doi: 10.1042/BST0381500. [DOI] [PMC free article] [PubMed] [Google Scholar]
- Wang D, Zavadil J, Martin L, Parisi F, Friedman E, Levy D, Harding H, Ron D, Gardner LB. Inhibition of nonsense-mediated RNA decay by the tumor microenvironment promotes tumorigenesis. Mol Cell Biol. 2011a;31:3670–3680. doi: 10.1128/MCB.05704-11. [DOI] [PMC free article] [PubMed] [Google Scholar]
- Wang X, Okonkwo O, Kebaara BW. Physiological basis of copper tolerance of Saccharomyces cerevisiae nonsense-mediated mRNA decay mutants. Yeast. 2011b;30:179–190. doi: 10.1002/yea.2950. [DOI] [PubMed] [Google Scholar]
- Wang G, Jiang B, Jia C, Chai B, Liang A. MicroRNA 125 represses nonsense-mediated mRNA decay by regulating SMG1 expression. Biochem Biophys Res Commun. 2013;435:16–20. doi: 10.1016/j.bbrc.2013.03.129. [DOI] [PubMed] [Google Scholar]
- Watabe T, Miyazono K. Roles of TGF-beta family signaling in stem cell renewal and differentiation. Cell Res. 2009;19:103–115. doi: 10.1038/cr.2008.323. [DOI] [PubMed] [Google Scholar]
- Weischenfeldt J, Damgaard I, Bryder D, Theilgaard-Monch K, Thoren LA, Nielsen FC, Jacobsen SE, Nerlov C, Porse BT. NMD is essential for hematopoietic stem and progenitor cells and for eliminating by-products of programmed DNA rearrangements. Genes Dev. 2008;22:1381–1396. doi: 10.1101/gad.468808. [DOI] [PMC free article] [PubMed] [Google Scholar]
- Xue K, Ng JH, Ng HH. Mapping the networks for pluripotency. Philos Trans R Soc Lond B Biol Sci. 2011;366:2238–2246. doi: 10.1098/rstb.2011.0005. [DOI] [PMC free article] [PubMed] [Google Scholar]
- Yepiskoposyan H, Aeschimann F, Nilsson D, Okoniewski M, Muhlemann O. Autoregulation of the nonsense-mediated mRNA decay pathway in human cells. RNA. 2011;17:2108–2118. doi: 10.1261/rna.030247.111. [DOI] [PMC free article] [PubMed] [Google Scholar]
- Yamashita A, Ohno S. Analysis of nonsense-mediated mRNA decay by monitoring mRNA half-lives in mammalian cells. Cold Spring Harb Protoc. 2010 doi: 10.1101/pdb.prot5386. pdb prot5386. [DOI] [PubMed] [Google Scholar]
- Yuan SH, Martin J, Elia J, Flippin J, Paramban RI, Hefferan MP, Vidal JG, Mu Y, Killian RL, Israel MA, et al. Cell-surface marker signatures for the isolation of neural stem cells, glia and neurons derived from human pluripotent stem cells. PLoS One. 2011;6:e17540. doi: 10.1371/journal.pone.0017540. [DOI] [PMC free article] [PubMed] [Google Scholar]
Associated Data
This section collects any data citations, data availability statements, or supplementary materials included in this article.
Supplementary Materials
Figure S1. Evidence that the NMD Downregulatory Response Terminates the Stem Cell Program and Induces Neural Differentiation
(A) qPCR analysis of the mouse brain cortex and the indicated cell lines treated as described in the Extended Experimental Procedures (n=3). The data show that Upf1 expression is repressed during cortical brain development and neural differentiation in vitro.
(B, C) The magnitude of NMD is repressed during neural differentiation. (B) qPCR analysis of known NMD target transcripts in P19 cells differentiated with RA, as described in the Experimental Procedure (n=3). (C) Luciferase expression from P19 cells transfected with either the PTC (+): pCI-Neo-NS39 or the PTC (−): pCI-Neo-WT Renilla luciferase-based NMD reporter vectors and co-transfected with the Firefly luciferase reporter, pCI-Neo-FLY, as a normalization control (Boelz et. al. 2006) (n=3). The elevation in PTC+ reporter levels is indicative of a decreased magnitude of NMD. It is not known why there is a modest decrease in PTC- reporter levels. See also Experimental Procedures and Figure 1B.
(D, E) Upf1 promotes the expression of stem cell markers. (D) Western blot analysis of P19 cells transfected with a UPF1 expression vector (Ev-Upf1) or the empty vector (Ev-C), as described in the Experimental Procedures. The quantification is the mean of three experiments, normalized against β-ACTIN; error bars represent standard deviation (SD). (E) Western blot analysis of P19 cells transfected with siRNAs against Upf1 (siUfp1) or luciferase (siLuc; the negative control). The quantification is the mean of three experiments, normalized against β-ACTIN; error bars represent standard deviation (SD).
(F) SMD downregulation does not promote neural maturation. qPCR analysis of mNSCs transfected with an shRNA construct against the essential SMD factor STAU1 (shStau1) (n=3). mNSCs transfected with the empty vector is the negative control; its mRNA levels are set to 1.
(G) qPCR analysis of mNSCs lacking the NMD factor UPF3B reveals these cells have elevated levels of neural maturation markers relative to littermate control mNSCs. The data are from mNSC lines derived from 2 Upf3b+/Y male mice and 2 Upf3b−/y male mice.
(H) Cell-cycle analysis of P19 cells treated and transfected as indicated (n=3) and in Figure 1L. Error bars represent SD.
For all data panels, statistical analysis was done using the paired Student’s t test (asterisks denote statistically significant differences; p < 0.05). Unless otherwise noted, error bars depict standard error mean (SEM). For all qPCR experiments, transcript levels were normalized to the level of L19 RNA.
Figure S2. UPF1 Destabilizes mRNAs Encoding Anti-Proliferation and Pro-neural Differentiation Factors
(A and B) qPCR analysis of P19 cells incubated with actinomycin D (5 μg/ml) for the times shown 48 hrs after the indicated siRNAs were transfected. Best-fitting mRNA decay kinetics were calculated using linear regression analysis. Transcripts levels were normalized to the level of Gapdh mRNA, which is relatively stable. Error bars depict SEM. Statistical analysis performed as in Figure S1A (n = 3).
Figure S3. The Upf1 Downregulatory Response Inhibits TGF-β Signaling and Stabilizes Neural mRNAs
(A) Likely direct NMD target mRNAs encoding pro-neural factors are upregulated in response to loss of the NMD factor UPF3B. qPCR analysis of Upf3b-null and littermate control mNSCs. The data are from mNSC lines derived from 2 Upf3b+/Y male mice and 2 Upf3b−/y male mice.
(B) Preventing the UPF1 downregulatory response during neural differentiation prevents TGF-β signaling downregulation, as measured by SMAD2 phosphorylation. Western blot analysis of P19 cells transfected and treated as shown (see Extended Experimental Procedures for details).
Quantification is the mean of three experiments, normalized against β-ACTIN; error bars depict SD.
(C) Overexpression of Upf1 does not significantly affect TGF-β signaling in undifferentiated P19 cells. qPCR analysis of the mRNAs encoding TGF-β downstream effectors (CDX4 and LHX1) and the TGF-β inhibitor, SMAD7, in P19 cells transfected with a UPF1 expression vector or empty vector. Statistical analysis was performed as in Figure S1A (n=3).
(D–F) Upf1 does not promote P19 cellular proliferation by destabilizing Smad7 mRNA. (D) Cell counting experiment performed on P19 transfected as in Figure 4H (n=6). (E, F) Cell-cycle analysis of P19 cells transfected as in panel D (n=3). Error bars depict SD.
For all data panels, statistical analysis was done using the paired Student’s t test (asterisks denote statistically significant differences; p < 0.05). Unless otherwise noted, error bars depict SEM. For all qPCR experiments, transcript levels were normalized to the level of L19 RNA.
Figure S4. MIR-128 Represses Cell Proliferation through its Ability to Repress UPF1 Expression
(A) Evidence that miR-128 promotes neural differentiation by repressing UPF1. qPCR analysis of P19 cells transfected with the miRNA mimics and expression vectors shown. Oct4 is a stem cell marker; Nestin and Tubb3 are neural maturation markers.
(B and G) Evidence that miR-128 inhibits neural cell proliferation by repressing UPF1. (B) Cell-cycle analysis of P19 cells transfected as in panel A (n=3). (G) Cell counting experiments performed on P19 transfected as in panel A (n=6).
(C–F) miR-128 inhibits the proliferation and promotes the neural differentiation of P19 cells. (C) Cell counting experiment performed in P19 cells transfected with the miRNA mimics shown (n=6). (D) Sequence and structure of miR-128 Decoy. (E) qPCR analysis of P19 cells transfected and treated as shown. The results indicate that the induction of miR-128 in response to the neural differentiation agent RA (Bruno et. al. 2011) contributes to neural differentiation. (F) Cell counting experiment performed in P19 cells transfected as in panel D (n=6).
(H) Neurally expressed miRNAs predicted to target NMD factors, based on using the following miRNA prediction programs: MicroCosm (score >15), Targetscan (Context+ score percentile >50), or MiRANDA (mirSVR score <−0.2). (Lewis et al., 2005; Griffiths-Jones et al., 2008; Betel et. al., 2010)
For all data panels, statistical analysis was done using the paired Student’s t test (asterisks denote statistically significant differences; p < 0.05). Unless otherwise noted, error bars depict SEM. For all qPCR experiments, transcript levels were normalized to the level of L19 RNA.
Figure S5. Upf1 is Conserved in Vertebrates
(A) Predicted UPF1 protein sequence deduced from cDNA sequences from the species shown. Identical amino acids are shown against green, whereas similar amino acids are shown against orange. The alignment was performed using Clustal W. Human, Homo sapien; mouse, Mus musculus; zebra fish, Danio rerio; frog, Xenopus tropicalis; chicken, Gallus gallus; fruit fly, Drosophila melanogaster; sea squirt, Ciona intestinalis; plant, Arabidopsis thaliana; and budding yeast, Schizosaccharomyces pombe (NP_002902.2, NP_001116301.1, NP_998639.1, XP_002938872.1, XP_418237.3, NP_572767, XP_002122130.1, NP_199512.2, and NP_593080.1, respectively).
(B and C) NMD targets are upregulated during neural maturation in both mice and frogs. qPCR analysis of Upf1 mRNA and NMD target mRNA levels in mouse brain and embryonic X. laevis anterior-ectodermal tissue. Mouse mRNA levels were normalized to the level of L19 mRNA. Xenopus mRNAs were normalized to the level of gapdh mRNA.
(D) The expression of miR-128 is upregulated in neuralized isolated ectoderm. Taqman-qPCR analysis of miR-128 levels in st. 19 X. laevis ectoderm tissue isolated from st. 12 embryos developed in vitro from two-cell embryos that were injected with the indicated RNAs, as described in the Experimental Procedures. miR-128 levels were normalized to U6 snRNA. Error bars depict SEM (n = 3).
(E) upf1 MO functions to blocked the translation of Upf1. Western blot analysis of Upf1 level in samples isolated from st. 12 X. laevis whole embryos that were injected with the indicated morpholinos or mRNAs at the cell stage embryos. β-Actin is the loading control.