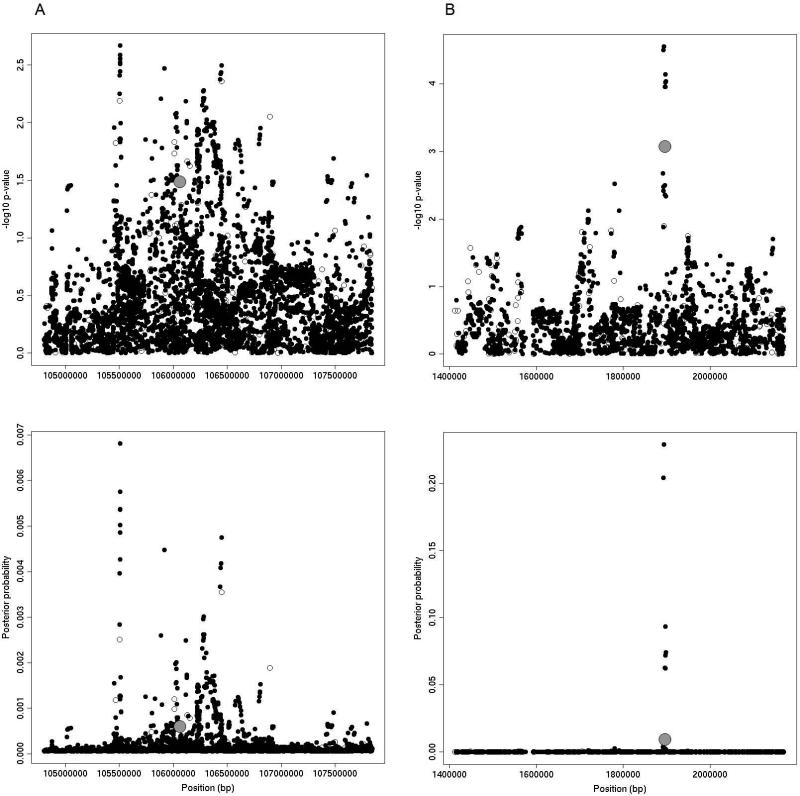
FIGURE 4.
Results from 2cm windows around TET2 (A) and IRX4 (B) regions on chromosome 4q24 and chromosome 5p15, respectively. The top panels show –log10 association p-values for each tested variant. The bottom panels display posterior probabilities from the approximate posterior Bayesian approach. Genotyped variants are indicated by open circles, imputed variants are solid circles, and previously published loci are shown in gray.

