

Abstract
Liquid chromatography-tandem mass spectrometry (LC-MS/MS) is highly sensitive, selective, and enables extensive detection of metabolites within a sample. The result allows us to characterize comprehensive metabolite accumulation patterns without dependence on authentic standard compounds and isolation of the individual metabolites. A reference database search is essential for the structural assignment process of un-targeted MS and MS/MS data. Moreover, the characterization of unknown metabolites is challenging, since these cannot be assigned a candidate structure by using a reference database. In this case study, integrated LC-MS/MS based plant metabolomics allows us to detect several hundred metabolites in a sample; and integrated omics analyses, e.g., large-scale reverse genetics, linkage mapping, and association mapping, provides a powerful tool for candidate structure selection or rejection. We also examine emerging technology and applications for LC-MS/MS-based un-targeted plant metabolomics. These activities promote the characterization of massive extended detectable metabolites.
Keywords: MS/MS, selected reaction monitoring, Q-TOF-MS, TQ-MS, quantitative trait locus analysis
Introduction
Liquid chromatography-tandem mass spectrometry (LC-MS/MS) based un-targeted metabolomics is a challenging activity in the characterization of detectable metabolites. The description of metabolite accumulation patterns is desirable in many fields of research; e.g. fuel, lead chemicals for pharmaceuticals, safety assessment, and breeding [1–12]. Using the LC-MS/MS strategy, a few hundreds to thousands of metabolites can be detected in an organism [13]. In model organisms, gene annotations in whole genome sequence are assigned to representative biosynthesis enzyme classes (hydroxylation, methylation, glycosylation, acetylation, etc.), and these modification reactions generate a huge number of derivatives from a core structure, which has diverse chemical properties and specific bioactivities [14–17]. Plants are the largest producer of phytochemicals— metabolites that play essential roles in the interactions between plant and other organisms. Moreover, when ingested, phytochemicals are metabolized in the body of the predator and it undergoes further changes [18, 19]. Thus, massive extended metabolite detection is quite important for elucidating the complex metabolic systems among organisms. Recent advances in hardware and software enable the comprehensive analysis of these biological samples.
In general, the isolation and complete identification of a detectable metabolite is the first step in metabolic systems research. However, classical instrumental analyses (MS, MS/MS, UV, and NMR) can be used for investigating very few metabolites in model organisms [20] that have established research infrastructures (e.g. genomics, transcriptomics, and proteomics). Metabolomics can be integrated with other omics approaches based on metabolic pathways [21–42], but the connections between metabolites and gene functions have too large gaps for interpreting the un-targeted data [43]. This is because metabolite levels in an organism are dynamically changed by the effects of multiple levels (e.g., genome, transcript, protein, and metabolite).
In this mini review, we focus on recent advances in LC-MS/MS based un-targeted metabolomics by characterizing detectable metabolites and by multi-type MS integration for practical quantification and qualification of metabolites in a few hundred bioresources. As previous research, electron ionization (EI), used in gas chromatography (GC)-MS are highly reproducible, and standard mass spectrum databases of GC-MS data have reported [44].
Characterization of un-targeted data
Identification of metabolites depends on authentic compounds and isolation, as described above. MS-based un-targeted detection of metabolites is an innovative methodology that does not depend on the following classical identification process: prepared biological samples, acquisition of extracted samples, data alignment, and generation of a data matrix (samples versus metabolites), multivariate analysis, and characterization of significantly changed metabolite structure. The description of all detectable metabolite candidates in an organism is likely to include novel biological findings, and the goal is the elucidation of complex metabolic systems for biosynthesis and metabolite structure-activity relationships. To identify the structure of detectable metabolite, the un-targeted methodology should integrate with classical validation. In the characterization of metabolite structure, the Metabolomics Standards Initiative (MSI, http://msi-workgroups.sourceforge.net/) has defined the compliance for validation of non-novel compounds [45, 46].
Validation of the isolated metabolites by using multiple instruments is the most reliable evidence, but this time-intensive process is a major bottleneck in the interpretation of un-targeted metabolomics data. LC-MS, combined with solid phase extraction-NMR, will be an efficient tool in de novo structural narrowing down [47, 48]. Using accurate high-resolution m/z values, detectable metabolites can be annotated as elemental compositions by using a metabolites database [21, 49, 50]. However, the monoisotopic mass of the metabolite cannot be assigned its elemental composition, even at less than 1 ppm of mass error of FT-MS data [51]. Thus, accurate mass data combined with the natural abundance of the isotopic ion are used for elemental composition analysis [52], and stable isotope labeling is also effective for elemental composition analysis [53, 54].
The coverage of annotation was improved by the establishment of large-scale reference MS and MS/MS databases, including a query data search algorithm [55–62]. In the search system, the m/z values of query data are compared with the reference data derived from the acquisition data of authentic compounds, and the matched data is returned within the user's defined tolerance for unit and high resolution m/z values. The MS/MS search can use m/z values combined with intensities for scoring the probability between query and reference data. Un-targeted data have tolerance both in chromatographic retention time and m/z value, and these drifts are adjusted across measurements by using alignment software [63–68]. As advanced web-based platforms, automated workflows from processing to analysis have been established; e.g., peak alignment of row data, annotations, statistical analysis, and visualization [69–72]. These web applications can annotate thousands of MS data, and these tools are designed to enable easy access for a broad range of investigators, regardless of informatics expertise.
MS/MS data derived from the literature are a very valuable data resource that are not dependent on available authentic compounds, and a few hundred metabolites can be collected from the literature each year. Using a hybrid MS/MS data resource, our acquisition data of authentic compounds and manually curated literature data, we successfully established an MS/MS web database and a new search algorithm. Confidence levels can be managed by MS/MS fragmentation association rules—an algorithm for discovering common fragmentations in MS/MS data (ReSpect: http://spectra.psc.riken.jp/) [73, 74]. ReSpect is the first fully downloadable MS/MS data resource under a Creative Commons Attribution - Noncommercial 2.1 Japan License. However, the other public databases are presented as a showcase, which cannot be reused for the development of new methodology. We expect that users of bioinformatics and metabolomics will be able to develop novel algorithms and methodologies by using our reusable data resources.
More than one-million un-targeted MS/MS tags (MS2T) can be collected by high-speed scanning by LC-Q-TOF-MS [43, 73], but we only have a few thousand reference data. Given the sensitivity and extension of detectable metabolites in advanced MS instruments, the gap between detected and reference information will spread further. Because of the large gap between query and reference MS/MS, more than 90% of the detectable metabolites are unknown. Unfortunately, no de novo identification methodology for unknown metabolites exists in MS-based metabolomics, as described above. Thus, integrated omics approaches incorporating genomics and metabolomics are thought to possess great potential for effectively narrowing down the candidate structure of unknown metabolites [75]. As a genetic resource for the integrated omics approach, recombinant inbred lines (RILs) have been established in model and non-model plant species. In this review, we show recent methodologies for un-targeted metabolite quantitative trait locus (QTL) analysis by linkage mapping.
A large-scale SRM assay system for biological validation
The metabolite accumulation pattern in an organism is a quantitative phenotype, and the regulatory genes have been identified by QTL analysis [76, 77]. To elucidate detectable phenotype QTL, a few hundred recombinant inbred lines, along with molecular marker information, have been distributed to bioresource projects [78]. Such QTL analyses require a few hundred to a thousand acquisitions; e.g., 100 recombinant inbred lines × 3 replicates × 2 years × 2 mode acquisitions (positive ion mode/negative ion mode) = 1200 acquisitions. Thus, targeted analysis is suitable for biological validations based on the statistically significant difference among metabolite accumulation patterns, because of the relatively small data size, high sensitivity detection, and high-speed data analysis (Table 1). A few thousand targeted analyses for amino acid and derived secondary metabolites using large scale gene knockout lines have been reported [79–82].
Table 1.
Applications based on the MS type. Q, quadrupole MS; TOF, time of flight MS; FT, Fourier transform MS.
| MS type | Sample size | Data size | Analysis scope | Specialty of instrument |
|---|---|---|---|---|
| Q | 10–1000 | 1–10 MB | Quant. | High sensitivity |
| TOF | 10–100 | 1–10 GB | Quant./Quali. | High-speed mass scan |
| FT | 1–10 | 100 GB | Quali. | High mass resolution |
In MS/MS-based targeted analysis, selected reaction monitoring (SRM) using tandem quadrupole MS (TQ-MS) has high sensitivity and a wide dynamic range. To extend detectable metabolites using SRM, we have established a new methodology: widely targeted analysis based on large-scale MS/MS data of authentic compounds [83]. Using this methodology, more than 500 SRM conditions and retention time sets can be managed, and the annotation rate of collected data is 100% [84–86]. To extend detectable targets without dependence on reference MS/MS data, we have tried to establish a large-scale SRM assay system for incorporation of un-targeted data. As shown in Fig. 1A, LC-QTOF-MS can detect all detectable chromatographic peaks at acquisition, and all peaks can be characterized by retention time, MS (precursor ion), and MS/MS (product ions) [43, 87]. As shown in Fig. 2B, SRM conditions for metabolite candidates can be selected by an in silico predicted precursor ion and its product ion with MS peak intensity. Using LC-TQ-MS, six steps collision energy (10–60 eV) can be used for optimization (Fig. 1B). The data size of few hundred SRM assays in a sample is less than 10 megabyte.
Figure 1.

Workflow of integrated metabolomics by LC-Q-TOF-MS and LC-TQ-MS. (A) LC-Q-TOF-MS can detect information of MS and MS/MS in all detectable chromatographic peaks. (B) LC-TQ-MS can optimize fragmentation conditions based on the LC-Q-TOF-MS data. The arrow shows the optimized collision energy in triplicate experiments.
Figure 2.
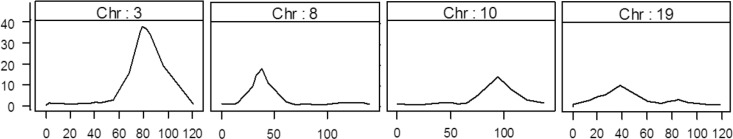
mQTL of TK780 (G. max) × B01167 (G. soja) RILs. The maximum logarithm of odds (LOD) score values obtained from triplicate experiments were plotted in each chromosome (Chr: 1–20). The major mQTLs were estimated based on the LOD scores (<10).
This case study of a large-scale SRM assay system was introduced as follows. All data can be downloaded at DROP Met in our web site (http://prime.psc.riken.jp/). We collected 46,717 un-targeted MS/MS data for Glycine max: GMA01, GMA02 (MS2T viewer at http://prime.psc.riken.jp/); and then metabolite candidates were selected with MS peak intensity, and 384 SRM conditions were successfully optimized based on the threshold (relative standard deviation < 10% in triplicate experiments and peak area value > 100). Using these SRM conditions, we carried out the mQTL analysis for G. max and G. soja as distributed in the LegumeBase (http://www.legumebase.brc.miyazaki-u.ac.jp). First, the 48 known and 60 unknown metabolite candidates were selected as significantly different between parent lines, and these SRMs were measured using 279 samples (93 soybean RILs x 3 biological replicates). Using 288 gene markers, we successfully identified significant associations between 4 mQTL and 17 SRM (Fig. 2). The 17 SRMs were derived from 4 standard compounds and 13 MS2Ts, and only one SRM was annotated using MS2T data and the ReSpect database in Table 2 and the Supplemental data in DROP Met at RIKEN PRIMe (http://prime.psc.riken.jp/).
Table 2.
Summary of identified mQTLs in soybean.
| mQTL1 | Methods2 | Annotations (number of SRMs) |
|---|---|---|
| 1 | UT | Unknown (2) |
| 2 | UT, WT | Flavonoid (3), Phenolic compound (1), Unknown (6) |
| 3 | WT | Flavonoid (1) |
| 4 | UT | Unknown (4) |
The number of mQTL corresponds to Fig. 2
UT, un-targeted metabolomics of MS2T; WT, widely targeted metabolomics of SRM
Concluding remarks
In this review, we describe the characterization of MS-based un-targeted data by analytical and biological methods. Using large-scale reference data derived from acquisition data for authentic compounds and reports in the literature, the coverage of annotations in un-targeted data will be dramatically improved in future metabolomics activities. Web-based integration among databases is also effective, and can be achieved by the reuse of the fully downloadable data resource or the establishment of an application-programming interface in each database. The genomics guided characterization of un-targeted data (e.g., large-scale reverse genetics, linkage mapping, and association mapping) has proven to be a powerful tool for candidate structure selection and rejection.
Acknowledgements
This work was supported by the RIKEN Plant Science Center, Japan Science and Technology Agency (CREST grant), Japan Advanced Plant Science Research Network, and Fuji Foundation for Protein Research. The RILs of G. max and G. soja were constructed by Hokkaido University. The RILs were distributed by the National BioResource Project (Legume Base). We thank Dr. Ryo Nakabayashi (RIKEN), Mrs. Makoto Suzuki (RIKEN), Akane Sakata (RIKEN), Yutaka Yamada (RIKEN), Tetsuya Mori (RIKEN), and Muneo Sato (JST GRENE NC-CARP) for their useful comments and LC-MS/MS analysis of the metabolomics technologies.
Competing Interests
The authors have declared that no competing interests exist.
References
- 1.Weckwerth W (2003) Metabolomics in systems biology. Annual review of plant biology 54: 669–689 [DOI] [PubMed] [Google Scholar]
- 2.Fernie AR, Trethewey RN, Krotzky AJ, Willmitzer L (2004) Metabolite profiling: from diagnostics to systems biology. Nature reviews Molecular cell biology 5: 763–769 [DOI] [PubMed] [Google Scholar]
- 3.Fiehn O, Kopka J, Dormann P, Altmann T, Trethewey RN, et al. (2000) Metabolite profiling for plant functional genomics. Nature biotechnology 18: 1157–1161 [DOI] [PubMed] [Google Scholar]
- 4.Sumner LW, Mendes P, Dixon RA (2003) Plant metabolomics: large-scale phytochemistry in the functional genomics era. Phytochemistry 62: 817–836 [DOI] [PubMed] [Google Scholar]
- 5.Schauer N, Fernie AR (2006) Plant metabolomics: towards biological function and mechanism. Trends in plant science 11: 508–516 [DOI] [PubMed] [Google Scholar]
- 6.Guy C, Kopka J, Moritz T (2008) Plant metabolomics coming of age. Physiologia plantarum 132: 113–116 [DOI] [PubMed] [Google Scholar]
- 7.Hall RD, Brouwer ID, Fitzgerald MA (2008) Plant metabolomics and its potential application for human nutrition. Physiologia plantarum 132: 162–175 [DOI] [PubMed] [Google Scholar]
- 8.Saito K, Matsuda F (2010) Metabolomics for functional genomics, systems biology, and biotechnology. Annual review of plant biology 61: 463–489 [DOI] [PubMed] [Google Scholar]
- 9.Last RL, Jones AD, Shachar-Hill Y (2007) Towards the plant metabolome and beyond. Nat Rev Mol Cell Biol 8: 167–174 [DOI] [PubMed] [Google Scholar]
- 10.Patti GJ, Yanes O, Siuzdak G (2012) Metabolomics: the apogee of the omics trilogy. Nature Reviews Molecular Cell Biology 13: 263–269 [DOI] [PMC free article] [PubMed] [Google Scholar]
- 11.Surh YJ (2003) Cancer chemoprevention with dietary phytochemicals. Nature reviews Cancer 3: 768–780 [DOI] [PubMed] [Google Scholar]
- 12.Milo R, Last RL (2012) Achieving diversity in the face of constraints: lessons from metabolism. Science 336: 1663–1667 [DOI] [PubMed] [Google Scholar]
- 13.Chrysanthopoulos PK, Goudar CTKlapa MI Metabolomics for high-resolution monitoring of the cellular physiological state in cell culture engineering. Metab Eng 12: 212–222 [DOI] [PubMed] [Google Scholar]
- 14.Kelly JW (1999) Comprehensive Natural Products Chemistry: Amino acids, Peptides, Porphyrins, and Alkaloids; Barton SD, Nakanishi K, Meth-Cohn O, editors. Oxford: Pergamon [Google Scholar]
- 15.Pinto BM (1999) Comprehensive Natural Products Chemistry: Carbohydrates and Their Derivatives Including Tannins, Cellulose, and related Lignins; Barton SD, Nakanishi K, Meth-Cohn O, editors. Oxford: Pergamon [Google Scholar]
- 16.Cane DE (1999) Comprehensive Natural Products Chemistry: Isoprenoids Including Carotenoids and Steroids; Barton SD, Nakanishi K, Meth-Cohn O, editors. Oxford: Pergamon [Google Scholar]
- 17.Sankawa U (1999) Comprehensive Natural Products Chemistry: Polyketides and Other Secondary Metabolites Including Fatty Acids and Their Derivatives; Barton SD, Nakanishi K, Meth-Cohn O, editors. Oxford: Pergamon [Google Scholar]
- 18.Barrett LG, Heil M (2012) Unifying concepts and mechanisms in the specificity of plant-enemy interactions. Trends in plant science 17: 282–292 [DOI] [PubMed] [Google Scholar]
- 19.Ali JG, Agrawal AA (2012) Specialist versus generalist insect herbivores and plant defense. Trends in plant science 17: 293–302 [DOI] [PubMed] [Google Scholar]
- 20.Nakabayashi R, Kusano M, Kobayashi M, Tohge T, Yonekura-Sakakibara K (2009) Metabolomics-oriented isolation and structure elucidation of 37 compounds including two anthocyanins from Arabidopsis thaliana. Phytochemistry 70: 1017–1029 [DOI] [PubMed] [Google Scholar]
- 21.Kanehisa M, Goto S, Sato Y, Furumichi M, Tanabe M (2012) KEGG for integration and interpretation of large-scale molecular data sets. Nucleic Acids Research 40: D109–114 [DOI] [PMC free article] [PubMed] [Google Scholar]
- 22.Kanehisa M, Goto S, Kawashima S, Okuno Y, Hattori M (2004) The KEGG resource for deciphering the genome. Nucleic Acids Research 32: D277–280 [DOI] [PMC free article] [PubMed] [Google Scholar]
- 23.Kanehisa M, Goto S, Kawashima S, Nakaya A (2002) The KEGG databases at GenomeNet. Nucleic Acids Research 30: 42–46 [DOI] [PMC free article] [PubMed] [Google Scholar]
- 24.Kanehisa M, Goto S, Hattori M, Aoki-Kinoshita KF, Itoh M, et al. (2006) From genomics to chemical genomics: new developments in KEGG. Nucleic Acids Research 34: D354–357 [DOI] [PMC free article] [PubMed] [Google Scholar]
- 25.Kanehisa M, Goto S, Furumichi M, Tanabe M, Hirakawa M (2010) KEGG for representation and analysis of molecular networks involving diseases and drugs. Nucleic Acids Research 38: D355–360 [DOI] [PMC free article] [PubMed] [Google Scholar]
- 26.Kanehisa M, Goto S (2000) KEGG: kyoto encyclopedia of genes and genomes. Nucleic Acids Research 28: 27–30 [DOI] [PMC free article] [PubMed] [Google Scholar]
- 27.Kanehisa M, Araki M, Goto S, Hattori M, Hirakawa M, et al. (2008) KEGG for linking genomes to life and the environment. Nucleic Acids Research 36: D480–484 [DOI] [PMC free article] [PubMed] [Google Scholar]
- 28.Kanehisa M (2002) The KEGG database. Novartis Foundation symposium 247: 91–101; discussion 101-103, 119-128, 244-152 [PubMed] [Google Scholar]
- 29.Caspi R, Altman T, Dreher K, Fulcher CA, Subhraveti P, et al. (2012) The MetaCyc database of metabolic pathways and enzymes and the BioCyc collection of pathway/genome databases. Nucleic Acids Research 40: D742–753 [DOI] [PMC free article] [PubMed] [Google Scholar]
- 30.Caspi R, Altman T, Dale JM, Dreher K, Fulcher CA, et al. (2010) The MetaCyc database of metabolic pathways and enzymes and the BioCyc collection of pathway/genome databases. Nucleic Acids Research 38: D473–479 [DOI] [PMC free article] [PubMed] [Google Scholar]
- 31.Caspi R, Foerster H, Fulcher CA, Kaipa P, Krummenacker M, et al. (2008) The MetaCyc Database of metabolic pathways and enzymes and the BioCyc collection of Pathway/Genome Databases. Nucleic Acids Research 36: D623–631 [DOI] [PMC free article] [PubMed] [Google Scholar]
- 32.Usadel B, Poree F, Nagel A, Lohse M, Czedik-Eysenberg A, et al. (2009) A guide to using MapMan to visualize and compare Omics data in plants: a case study in the crop species, Maize. Plant. cell & environment 32: 1211–1229 [DOI] [PubMed] [Google Scholar]
- 33.Usadel B, Nagel A, Thimm O, Redestig H, Blaesing OE, et al. (2005) Extension of the visualization tool MapMan to allow statistical analysis of arrays, display of corresponding genes, and comparison with known responses. Plant physiology 138: 1195–1204 [DOI] [PMC free article] [PubMed] [Google Scholar]
- 34.Urbanczyk-Wochniak E, Usadel B, Thimm O, Nunes-Nesi A, Carrari F, et al. (2006) Conversion of MapMan to allow the analysis of transcript data from Solanaceous species: effects of genetic and environmental alterations in energy metabolism in the leaf. Plant molecular biology 60: 773–792 [DOI] [PubMed] [Google Scholar]
- 35.Thimm O, Blasing O, Gibon Y, Nagel A, Meyer S, et al. (2004) MAPMAN: a user-driven tool to display genomics data sets onto diagrams of metabolic pathways and other biological processes. The Plant journal: for cell and molecular biology 37: 914–939 [DOI] [PubMed] [Google Scholar]
- 36.Sreenivasulu N, Usadel B, Winter A, Radchuk V, Scholz U, et al. (2008) Barley grain maturation and germination: metabolic pathway and regulatory network commonalities and differences highlighted by new MapMan/PageMan profiling tools. Plant physiology 146: 1738–1758 [DOI] [PMC free article] [PubMed] [Google Scholar]
- 37.Rotter A, Usadel B, Baebler S, Stitt M, Gruden K (2007) Adaptation of the MapMan ontology to biotic stress responses: application in solanaceous species. Plant Methods 3: 10. [DOI] [PMC free article] [PubMed] [Google Scholar]
- 38.Rotter A, Camps C, Lohse M, Kappel C, Pilati S, et al. (2009) Gene expression profiling in susceptible interaction of grapevine with its fungal pathogen Eutypa lata: extending MapMan ontology for grapevine. Bmc Plant Biology 9: 104. [DOI] [PMC free article] [PubMed] [Google Scholar]
- 39.Klie S, Nikoloski Z (2012) The Choice between MapMan and Gene Ontology for Automated Gene Function Prediction in Plant Science. Frontiers in genetics 3: 115. [DOI] [PMC free article] [PubMed] [Google Scholar]
- 40.Goffard N, Weiller G (2006) Extending MapMan: application to legume genome arrays. Bioinformatics 22: 2958–2959 [DOI] [PubMed] [Google Scholar]
- 41.Tokimatsu T, Sakurai N, Suzuki H, Ohta H, Nishitani K, et al. (2005) KaPPA-view: a web-based analysis tool for integration of transcript and metabolite data on plant metabolic pathway maps. Plant physiology 138: 1289–1300 [DOI] [PMC free article] [PubMed] [Google Scholar]
- 42.Sakurai N, Ara T, Ogata Y, Sano R, Ohno T, et al. (2011) KaPPA-View4: a metabolic pathway database for representation and analysis of correlation networks of gene co-expression and metabolite co-accumulation and omics data. Nucleic Acids Research 39: D677–684 [DOI] [PMC free article] [PubMed] [Google Scholar]
- 43.Matsuda F, Hirai MY, Sasaki E, Akiyama K, Yonekura-Sakakibara K, et al. (2010) AtMetExpress development: a phytochemical atlas of Arabidopsis development. Plant physiology 152: 566–578 [DOI] [PMC free article] [PubMed] [Google Scholar]
- 44.Hummel J, Selbig J, Walther D, Kopka J (2007) The Golm Metabolome Database: a database for GC-MS based metabolite profiling In: Jewett MC, Nielsen JH, editors. Metabolomics a powerful tool in systems biology. Berlin: Springer; pp. 75–95 [Google Scholar]
- 45.Sumner LW, Amberg A, Barrett D, Beale MH, Beger R, et al. (2007) Proposed minimum reporting standards for chemical analysis. Metabolomics 3: 211–221 [DOI] [PMC free article] [PubMed] [Google Scholar]
- 46.Neumann S, Bocker S (2010) Computational mass spectrometry for metabolomics: identification of metabolites and small molecules. Analytical and Bioanalytical Chemistry 398: 2779–2788 [DOI] [PubMed] [Google Scholar]
- 47.van der Hooft JJ, Mihaleva V, de Vos RC, Bino RJ, Vervoort J (2011) A strategy for fast structural elucidation of metabolites in small volume plant extracts using automated MS-guided LC-MS-SPE-NMR. Magnetic resonance in chemistry: MRC 49(Suppl 1), S55–60 [DOI] [PubMed] [Google Scholar]
- 48.Castro A, Moco S, Coll J, Vervoort J (2010) LC-MS-SPE-NMR for the isolation and characterization of neo-clerodane diterpenoids from Teucrium luteum subsp. flavovirens (perpendicular). Journal of natural products 73: 962–965 [DOI] [PubMed] [Google Scholar]
- 49.Iijima Y, Nakamura Y, Ogata Y, Tanaka K, Sakurai N, et al. (2008) Metabolite annotations based on the integration of mass spectral information. Plant Journal 54: 949–962 [DOI] [PMC free article] [PubMed] [Google Scholar]
- 50.Afendi FM, Okada T, Yamazaki M, Hirai-Morita A, Nakamura Y, et al. (2012) KNApSAcK family databases: integrated metabolite-plant species databases for multifaceted plant research. Plant & cell physiology 53: e1. [DOI] [PubMed] [Google Scholar]
- 51.Kind T, Fiehn O (2006) Metabolomic database annotations via query of elemental compositions: mass accuracy is insufficient even at less than 1 ppm. Bmc Bioinformatics 7: 234. [DOI] [PMC free article] [PubMed] [Google Scholar]
- 52.Miura D, Tsuji Y, Takahashi K, Wariishi H, Saito K (2010) A strategy for the determination of the elemental composition by fourier transform ion cyclotron resonance mass spectrometry based on isotopic peak ratios. Analytical chemistry 82: 5887–5891 [DOI] [PubMed] [Google Scholar]
- 53.Giavalisco P, Li Y, Matthes A, Eckhardt A, Hubberten HM, et al. (2011) Elemental formula annotation of polar and lipophilic metabolites using (13) C, (15) N and (34) S isotope labelling, in combination with high-resolution mass spectrometry. The Plant journal: for cell and molecular biology 68: 364–376 [DOI] [PubMed] [Google Scholar]
- 54.Nakabayashi R, Sawada Y, Yamada Y, Suzuki M, Hirai MY, et al. (2013) Combination of Liquid Chromatography-Fourier Transform Ion Cyclotron Resonance-Mass Spectrometry with (13)C-Labeling for Chemical Assignment of Sulfur-Containing Metabolites in Onion Bulbs. Anal chem 85: 1310–1315 [DOI] [PubMed] [Google Scholar]
- 55.Smith CA, O'Maille G, Want EJ, Qin C, Trauger SA, et al. (2005) METLIN: a metabolite mass spectral database. Ther Drug Monit 27: 747–751 [DOI] [PubMed] [Google Scholar]
- 56.Fiehn O, Wohlgemuth G, Scholz M, Kind T, Lee do Y, et al. (2008) Quality control for plant metabolomics: reporting MSI-compliant studies. Plant J 53: 691–704 [DOI] [PubMed] [Google Scholar]
- 57.Fiehn O, Wohlgemuth G, Scholz M (2005) Setup and Annotation of Metabolomic Experiments by Integrating Biological and Mass Spectrometric Metadata. Proc Lect Notes Bioinformatics 3615: 224–239 [Google Scholar]
- 58.Wishart DS, Tzur D, Knox C, Eisner R, Guo AC, et al. (2007) HMDB: the Human Metabolome Database. Nucleic Acids Res 35: D521–526 [DOI] [PMC free article] [PubMed] [Google Scholar]
- 59.Wishart DS, Knox C, Guo AC, Eisner R, Young N, et al. (2009) HMDB: a knowledgebase for the human metabolome. Nucleic Acids Res 37: D603–610 [DOI] [PMC free article] [PubMed] [Google Scholar]
- 60.Cui Q, Lewis IA, Hegeman AD, Anderson ME, Li J, et al. (2008) Metabolite identification via the Madison Metabolomics Consortium Database. Nat Biotechnol 26: 162–164 [DOI] [PubMed] [Google Scholar]
- 61.Horai H, Arita M, Kanaya S, Nihei Y, Ikeda T, et al. (2010) MassBank: a public repository for sharing mass spectral data for life sciences. J Mass Spectrom 45: 703–714 [DOI] [PubMed] [Google Scholar]
- 62.Mylonas R, Mauron Y, Masselot A, Binz PA, Budin N, et al. (2009) X-Rank: a robust algorithm for small molecule identification using tandem mass spectrometry. Analytical chemistry 81: 7604–7610 [DOI] [PubMed] [Google Scholar]
- 63.Smith CA, Want EJ, O'Maille G, Abagyan R, Siuzdak G (2006) XCMS: Processing mass spectrometry data for metabolite profiling using Nonlinear peak alignment, matching, and identification. Analytical chemistry 78: 779–787 [DOI] [PubMed] [Google Scholar]
- 64.Lommen A, Kools HJ (2012) MetAlign 3.0: performance enhancement by efficient use of advances in computer hardware. Metabolomics: Official journal of the Metabolomic Society 8: 719–726 [DOI] [PMC free article] [PubMed] [Google Scholar]
- 65.Lommen A (2012) Data (pre-)processing of nominal and accurate mass LC-MS or GC-MS data using MetAlign. Methods in molecular biology 860: 229–253 [DOI] [PubMed] [Google Scholar]
- 66.Lommen A (2009) MetAlign: interface-driven, versatile metabolomics tool for hyphenated full-scan mass spectrometry data preprocessing. Analytical chemistry 81: 3079–3086 [DOI] [PubMed] [Google Scholar]
- 67.Pluskal T, Castillo S, Villar-Briones A, Oresic M (2010) MZmine 2: modular framework for processing, visualizing, and analyzing mass spectrometry-based molecular profile data. Bmc Bioinformatics 11: 395. [DOI] [PMC free article] [PubMed] [Google Scholar]
- 68.Katajamaa M, Miettinen J, Oresic M (2006) MZmine: toolbox for processing and visualization of mass spectrometry based molecular profile data. Bioinformatics 22: 634–636 [DOI] [PubMed] [Google Scholar]
- 69.Xia J, Wishart DS (2011) Web-based inference of biological patterns, functions and pathways from metabolomic data using MetaboAnalyst. Nature Protocols 6: 743–760 [DOI] [PubMed] [Google Scholar]
- 70.Tautenhahn R, Patti GJ, Rinehart D, Siuzdak G (2012) XCMS Online: A Web-Based Platform to Process Untargeted Metabolomic Data. Analytical chemistry 84: 5035–5039 [DOI] [PMC free article] [PubMed] [Google Scholar]
- 71.Tautenhahn R, Cho K, Uritboonthai W, Zhu Z, Patti GJ, et al. (2012) An accelerated workflow for untargeted metabolomics using the METLIN database. Nature biotechnology 30: 826–828 [DOI] [PMC free article] [PubMed] [Google Scholar]
- 72.Sakurai T, Yamada Y, Sawada Y, Matsuda F, Akiyama Ket al. (2013) PRIMe Update: Innovative Content for Plant Metabolomics and Integration of Gene Expression and Metabolite Accumulation. Plant & cell physiology. [DOI] [PMC free article] [PubMed] [Google Scholar]
- 73.Matsuda F, Nakabayashi R, Sawada Y, Suzuki M, Hirai MY, et al. (2011) Mass spectra-based framework for automated structural elucidation of metabolome data to explore phytochemical diversity. Frontiers in plant science 2: 40. [DOI] [PMC free article] [PubMed] [Google Scholar]
- 74.Sawada Y, Nakabayashi R, Yamada Y, Suzuki M, Sato M, et al. (2012) RIKEN tandem mass spectral database (ReSpect) for phytochemicals: a plant-specific MS/MS-based data resource and database. Phytochemistry 82: 38–45 [DOI] [PubMed] [Google Scholar]
- 75.Tohge T, Fernie AR (2010) Combining genetic diversity, informatics and metabolomics to facilitate annotation of plant gene function. Nature Protocols 5: 1210–1227 [DOI] [PubMed] [Google Scholar]
- 76.Hill WG, Mackay TF (2004) D. S. Falconer and Introduction to quantitative genetics. Genetics 167: 1529–1536 [DOI] [PMC free article] [PubMed] [Google Scholar]
- 77.Kearsey MJ (1998) The principles of QTL analysis (a minimal mathematics approach). Journal of experimental botany 49: 1619–1623 [Google Scholar]
- 78.Yamazaki Y, Akashi R, Banno Y, Endo T, Ezura H, et al. (2010) NBRP databases: databases of biological resources in Japan. Nucleic Acids Research 38: D26–32 [DOI] [PMC free article] [PubMed] [Google Scholar]
- 79.Hanada K, Sawada Y, Kuromori T, Klausnitzer R, Saito K, et al. (2010) Functional compensation of primary and secondary metabolites by duplicate genes in Arabidopsis thaliana . Molecular biology and evolution 28: 377–382 [DOI] [PMC free article] [PubMed] [Google Scholar]
- 80.Hirai MY, Sawada Y, Kanaya S, Kuromori T, Kobayashi M, et al. (2010) Toward genome-wide metabolotyping and elucidation of metabolic system: metabolic profiling of large-scale bioresources. J Plant Res 123: 291–298 [DOI] [PubMed] [Google Scholar]
- 81.Bell SM, Burgoon LD, Last RL (2012) MIPHENO: data normalization for high throughput metabolite analysis. Bmc Bioinformatics 13: 10. [DOI] [PMC free article] [PubMed] [Google Scholar]
- 82.Bais P, Moon SM, He K, Leitao R, Dreher K, et al. (2010) PlantMetabolomics.org: A Web Portal for Plant Metabolomics Experiments. Plant physiology 152: 1807–1816 [DOI] [PMC free article] [PubMed] [Google Scholar]
- 83.Sawada Y, Akiyama K, Sakata A, Kuwahara A, Otsuki H, et al. (2009) Widely targeted metabolomics based on large-scale MS/MS data for elucidating metabolite accumulation patterns in plants. Plant Cell Physiol 50: 37–47 [DOI] [PMC free article] [PubMed] [Google Scholar]
- 84.Sawada Y, Kuwahara A, Nagano M, Narisawa T, Sakata A, et al. (2009) Omics-based approaches to methionine side chain elongation in Arabidopsis: characterization of the genes encoding methylthioalkylmalate isomerase and methylthioalkylmalate dehydrogenase. Plant Cell Physiol 50: 1181–1190 [DOI] [PMC free article] [PubMed] [Google Scholar]
- 85.Sawada Y, Toyooka K, Kuwahara A, Sakata A, Nagano M, et al. (2009) Arabidopsis bile acid:sodium symporter family protein 5 is involved in methionine-derived glucosinolate biosynthesis. Plant Cell Physiol 50: 1579–1586 [DOI] [PMC free article] [PubMed] [Google Scholar]
- 86.Izawa T, Mihara M, Suzuki Y, Gupta M, Itoh H, et al. (2011) Os-GIGANTEA confers robust diurnal rhythms on the global transcriptome of rice in the field. The Plant cell 23: 1741–1755 [DOI] [PMC free article] [PubMed] [Google Scholar]
- 87.Matsuda F, Yonekura-Sakakibara K, Niida R, Kuromori T, Shinozaki K, et al. (2009) MS/MS spectral tag-based annotation of non-targeted profile of plant secondary metabolites. Plant J 57: 555–577 [DOI] [PMC free article] [PubMed] [Google Scholar]