

Abstract
The visualization of β-amyloid plaque deposition in brain, a key feature of Alzheimer’s disease (AD), is important for the evaluation of disease progression and the efficacy of therapeutic interventions. In this study, β-amyloid plaques in the PS/APP transgenic mouse brain, a model of human AD pathology, were detected using MR microscopy without contrast reagents. β-Amyloid plaques were clearly visible in the cortex, thalamus, and hippocampus of fixed brains of PS/APP mice. The distribution of plaques identified by MRI was in excellent agreement with those found in the immunohistological analysis of the same brain sections. It was also demonstrated that image contrast for β-amyloid plaques was present in freshly excised nonfixed brains. Furthermore, the detection of β-amyloid plaques was achieved with a scan time as short as 2 hr, approaching the scan time considered reasonable for in vivo imaging. Magn Reson Med 52:538–544, 2004.
Keywords: MR microscopy, transgenic mouse, Alzheimer’s disease, β-amyloid plaques
Alzheimer’s disease (AD) is characterized by the presence of β-amyloid (Aβ) plaques, neurofibrillary tangles, and neuronal deficits. The presence of Aβ plaques is one of the major pathogenic features of the disease, and imaging these plaques would greatly improve early diagnosis and accurate clinical evaluation of AD. Early identification of the Aβ plaques is also important in understanding the pathogenic progression of AD and in studying possible therapeutic interventions such as vaccination to prevent and/or reduce the cerebral deposition of amyloid β-peptide (1).
There exist several transgenic mouse models that mimic various aspects of human AD. The PS/APP mouse is one example that overexpresses both mutant amyloid precursor protein (mAPP) and mutant presenilin-1 (mPS1) and initially develops Aβ plaques at ~9–10 weeks of age. Aβ plaques increase rapidly in number and size, and the degree of compact plaques composed of fibrillar (thioflavin S-positive) Aβ increases with age (2). By 1 year of age, compact and diffuse plaques are extensive throughout the cortex and hippocampus. Neurofibrillary pathology is limited to enhanced phospho-tau accumulation around plaques (3), but tangles do not form. Although overt cell loss is not apparent, neuronal numbers are reduced in the immediate vicinity of plaques and neuronal damage is associated with increasing amyloid load. Furthermore, there is an extensive inflammatory response and activated astrocytes and microglia cluster around plaques (2).
Aβ plaques can be identified using single photon emission computed tomography (SPECT) (4,5) and positron emission tomography (PET) (6-8) in conjunction with various agents targeted for amyloid β-peptide or histological dyes such as Congo red (9) or thioflavin S (8). However, the development of amyloid-imaging agents, which are Aβ specific and can cross the blood–brain barrier, has been a major challenge. In addition, both SPECT and PET suffer relatively low spatial resolution, which inhibits their ability to distinguish individual Aβ plaques that are at least one or two orders of magnitude smaller (20–150 μm) than the resolution of these techniques.
MRI can provide much higher spatial resolution than SPECT or PET without ionizing radiation. The detection of Aβ plaques using -weighted MRI has been reported in postmortem human brain tissue (10). In that study, immunohistologically confirmed plaque-like structures were identified in the gradient echo images acquired with a spatial resolution of 40 × 40 × 40 μm3 in ~20 hr. MR imaging of Aβ plaques has also been reported in a transgenic mouse model of AD following an injection of targeted MR contrast reagents (11,12). However, these methods are either relatively invasive, requiring contrast reagent delivery across the blood–brain barrier, or require prohibitively long scan times for in vivo applications.
The focus of the present work was to image Aβ plaques without exogenous contrast reagents and within relatively short scan times, compatible with in vivo applications.
MATERIALS AND METHODS
Transgenic Mice
Hemizygous transgenic mice expressing mutant human APPK670N,M671L protein (line Tg2576) (13) and a homozygous line of mice expressing human mutant PS1M146V protein (line 8.9) were crossed to generate off-spring including parental type singly transgenic (PS1) off-spring, doubly transgenic PS/APP animals (14). A total of seven 17–19-month-old mice were used in this study: four doubly transgenic mice (PS/APP), one singly transgenic mouse (PS), and two nontransgenic (NTg) mice. The PS/APP mice begin to deposit Aβ at ~12 weeks of age. The Aβ deposition accumulates progressively and forms plaque-like lesions throughout the life span of the PS/APP mice. At 17–19 months of age, these mice exhibit numerous dense-cored plaques containing Aβ peptide within the cortex and hippocampus. Contrary to the PS/APP mice, the PS mice have elevated Aβ-42 peptide, but do not form any amyloid deposits (14).
Brain Preparation and Histology
Two PS/APP mice, one PS mouse and one NTg mouse were perfused with phosphate-buffered saline (PBS) (pH 7.4) through the left cardiac ventricle, followed by 10% buffered formalin. After perfusion fixation, the top of the cranium was removed and the heads of the mice were stored in 10% buffered formalin at room temperature. To investigate the influence of blood and blood vessels on image contrast, brains from one PS/APP mouse and one NTg mouse were fixed by removing the top of the cranium of the head and immersing the head in 10% buffered formalin without any perfusion. Overall fixation duration for all fixed brains was between 6 days and 40 days, which is long enough to complete the fixation process (15). To characterize the effects of the fixation process on image contrast and visualization of Aβ plaques, an additional PS/APP mouse was imaged immediately after death, without any perfusion or fixation procedures, to characterize the effects of the fixation process.
The mouse heads were positioned at the center of a plastic tube filled with 10% buffered formalin and tightly sealed for MR measurements. After MR imaging, fixed brains from each genotype were carefully removed from the head and the posterior part of the brain was placed on a stand, maintaining as much as possible the same spatial orientation as in the MR imaging experiments. Each brain was then cut serially in 50-μm-thick coronal sections using a vibratome (series 1000) and collected at 150-μm intervals. To visualize the Aβ plaques, immunohistopathology was performed using antibody 6E10 at 1:1000 (Sigma, St. Louis, MO). Sections were immunostained by a standard avidin-biotin complex method using diaminobenzidine as chromogen. To identify the iron presence of Aβ plaques, brain sections from two PS/APP mouse brains, fixed with methacarn or formalin, were stained with Perl’s reaction following 3,3–diaminobenzidine (DAB) enhancement (16). The staining is based on the formation of ferric ferrocyanide (Prussian blue) when ferric ion (Fe3+), released from iron-containing compounds by hydrochloric acid (HCl), reacts with potassium ferrocyanide. The ferric ferrocyanide then catalyzes the oxidation of DAB with formation of a brown precipitate.
Immunolabeled sections were digitized at a resolution of 1200 dpi using a scanner or a CCD camera (AxiCam HRc, Carl Zeiss Microimaging, Thornwood, NY) attached to a microscope. All digitized histological sections and MR images were examined using PhotoShop 7.0 (Adobe Systems, San Jose, CA). MR images and histological images of the PS/APP mice were matched based on anatomical landmarks. Due to differences between slice thickness in MRI (200 μm) and histology (50 μm), each MR image had at least three corresponding histological images.
NMR Methods
All experiments were performed on a 7 T, 40 cm bore horizontal magnet (Magnex Scientific, UK) with a 10-cm gradient insert capable of 1000 mT/m in 400 μs interfaced to an SMIS (Guilford, UK) console. Mouse brain specimens in plastic tubes were placed in a 1.5-cm-diameter 8-element-birdcage RF coil. T2-weighted MR images were acquired using a multislice fast spin-echo (FSE) sequence with navigator correction for the Nyquist-ghost reduction. The data acquisition parameters for high-resolution images were FOV = 13.8 mm × 13.8 mm, image matrix = 256 × 240, base echo time (TE) = 10 ms, repetition time (TR) = 5–6 sec, flip angle = 85–90°, number of slices = 20, sweep width = 100 kHz, and echo train length = 4. For low-resolution images, imaging parameters were FOV = 13.8 mm × 13.8 mm, image matrix = 196 × 180, base echo time (TE) = 9.3 ms, repetition time (TR) = 0.6–1 sec, flip angle = 46–50°, number of slices = 5–6. Data were acquired in time blocks of 65–80 min and averaged together in complex mode after Fourier transformation to minimize the effect of B0 magnetic field drift due to temperature changes of magnets during prolonged MR scanning. To reduce the magnetic field inhomogeneity, automatic shimming was performed using FASTMAP (17) and the resulting water linewidths were 13–17 Hz from a 5 × 5 × 6 mm3 volume.
To maximize the signal-to-noise (SNR) ratio of MR images, the TR and flip angle of the RF excitation pulse were optimized using the following equation describing SNR for total MR scan time assuming complete dephasing of transverse magnetization before the next RF excitation:
| [1] |
where A is a proportionality constant and M0 the equilibrium magnetization of water protons, T1 the longitudinal relaxation time, and θ, the flip angle of the RF excitation pulse. Although SNR values reach the maximum as TR approaches zero, experimentally achievable TR values are limited by factors such as gradient duty cycle, data acquisition time, and RF pulse durations. Based on numerical calculations of SNR using Eq. 1 and T1 of water proton of 1.7 sec, SNR values are ~95% and ~78% of the maximum theoretical SNR at TR of 2 and 5 sec, respectively. TE of the FSE sequence was optimized to provide the best visibility of Aβ plaques by varying effective echo-positions of FSE echo trains with a fixed base TE of 9.3 ms.
MRI data were processed with a program written in IDL (RSI, Boulder, CO) for Fourier transformation and navigator echo phase correction. Images were reconstructed to 256 × 256 and 192 × 192 matrices by zero-padding phase encoding dimension for high-resolution and low-resolution data, respectively. Similar windowing of image intensity was applied to the images of all genotypes.
RESULTS
MR microscopy of Aβ plaques was achieved with careful adjustment of MR parameters of the FSE sequence for high SNR and contrast of the plaques. Immunolabeled histological images are shown in Fig. 1 from PS/APP (1a), PS (1b), and NTg (1c) mouse brains. Numerous dark spots, corresponding to Aβ plaques, are visible throughout the PS/APP mouse brain, including the cortex and hippocampus. However, the immunolabeled histological images of PS and NTg mice did not show any dark spots, which is consistent with the absence of Aβ plaques in those mice.
FIG. 1.
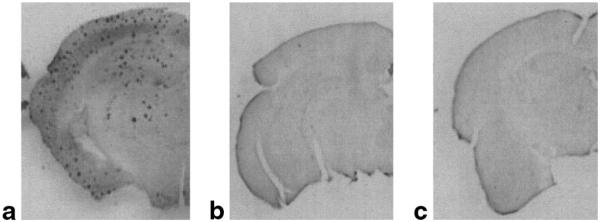
Histological sections of mouse brains stained with Aβ antibody. Representative histological sections of a PS/APP (a), a PS (b), and an NTg mouse (c) brains stained with Aβ antibody. In the PS/APP mouse brain (a), numerous dark spots, corresponding to Aβ plaques, are visible throughout the brain, whereas neither PS mouse nor NTg mouse shows any similar dark spots.
Shown in Fig. 2 are MR microscopy images (54 × 58 × 200 μm3) from PS/APP (2a), PS (2b), and NTg (2c) mouse brains, acquired after PBS perfusion and formalin fixation. For each mouse brain five levels of slices covering the hippocampus, from approximately bregma −1.22 mm to −2.70 mm, were shown. In the PS/APP mouse brain (Fig. 2a), numerous circular signal hypointensities were visible in cortical areas and hippocampus. In contrast to the PS/APP mouse brain, the PS mouse brain (Fig. 2b) and the NTg mouse brain (Fig. 2c) did not show any similar signal hypointensities in cortical areas or hippocampus.
FIG. 2.

MR microscopy of fixed mouse brains with PBS perfusion. MR microscopy images of fixed brains of a PS/APP mouse (a) and a PS mouse (b) and an NTg mouse (c) with spatial resolution of 54 × 58 × 200 μm3 (TR = 5–6 sec, TE = 10 ms, total scan time = 10–11 hr). Numerous circular signal hypointensities can be seen in the areas of cortex and hippocampus of the PS/APP mouse brain (a), whereas no distinctive signal hypointensities are visible in PS (b) and NTg (c) mouse brains.
The influence of blood in blood vessels on plaque image contrast is shown in Fig. 3a,b. The formalin-fixed PS/APP mouse brain even without PBS perfusion for blood removal (Fig. 3a) showed similar signal hypointensities as seen in the PBS-perfused PS/APP mouse brain (Fig. 2a). In contrast to the PS/APP brain, NTg brain with the same preparation did not show any signal hypointensities (Fig. 3b), suggesting that the presence of blood in the blood vessels alone does not significantly affect the plaque contrast. Figure 3c shows MR images (54 × 58 × 200 μm3) of the PS/APP mouse brain taken immediately after death without PBS perfusion or formalin fixation. Circular signal hypointensities similar to those from the fixed brain were observed in the MR images (Fig. 3c), although the visibility of Aβ plaques was somewhat reduced.
FIG. 3.

Effect of PBS perfusion and formalin fixation on plaque contrast. High-resolution MR images (54 × 58 × 200 μm3) were acquired from the brains of a PS/APP mouse (a) and an NTg mouse (b) with formalin-fixation but without PBS perfusion, and a PS/APP mouse (c) without either process. Similar patterns of circular signal hypointensities as the perfused PS/APP mouse brain in Fig. 2a can be seen in the areas of cortex and hippocampus of the PS/APP mouse brain (a), whereas no distinctive signal hypointensities are visible in the NTg brain (b). Again, similar patterns of signal hypointensities are identifiable in the nonfixed and nonperfused PS/APP mouse brain (c).
For further validation that these MR signal hypointensities correspond to the presence of Aβ plaques, MR images were compared with corresponding immunolabeled images. Co-registered high-resolution MR images and corresponding immunolabeled images from an 18-month-old PS/APP mouse brain are shown in Fig. 4a,b. Similar constellations of MR signal hypointensities and Aβ plaques can be seen from the magnified images of corresponding insets from MR and histology images. To verify the presence of iron in Aβ plaques, neighboring brain sections were stained with either an Aβ antibody (Fig. 5a) or DAB-enhanced Perl’s reaction (Fig. 5b). A similar pattern of distribution of Aβ plaques and iron staining can be seen in both sections (Fig. 5, black arrows), which serves to support the presence of iron in Aβ plaques. There was no positive staining for iron or Aβ plaques in the negative control sections (NTg) or sections stained only with DAB, indicating the specificity of the staining method.
FIG. 4.
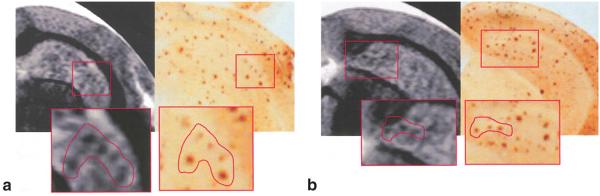
Co-registration of MR microscopy and histology of a PS/APP mouse brain. Two expanded MR images (54 × 58 × 200 μm3) of a PS/APP mouse brain and their corresponding histological sections stained with Aβ antibodies. Boxes and drawings indicate groups of Aβ plaques identified from both MRI and histology. Although there is general agreement in the pattern of plaque distribution, not all Aβ plaques apparent in the histology sections appear in the MR images, possibly due to differences between slice thickness of MRI (200 μm) and histology (50 μm), as well as misalignment of axes of MRI and histological sections.
FIG. 5.
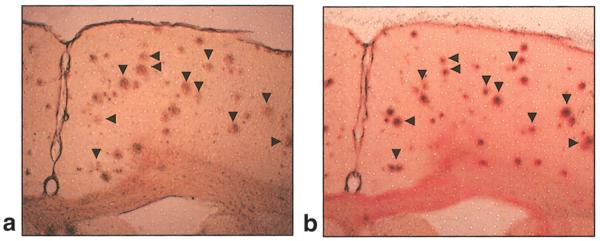
Co-registration of Aβ plaques and iron. Brain sections from a PS/APP mouse brain fixed with formalin and stained with an Aβ antibody (a) or Perl’s reaction following 3,3–diaminobenzidine (DAB) enhancement (16) (b). The iron staining is based on the formation of ferric ferrocyanide (Prussian blue) when ferric ion (Fe3+), released from iron-containing compounds by hydrochloric acid (HCl), reacts with potassium ferrocyanide. The ferric ferrocyanide then catalyzes the oxidation of DAB with formation of a brown precipitate. Clear staining of iron (Fe3+) can be seen in Aβ plaques (b). Arrowheads indicate the co-registered plaques.
The feasibility of MR imaging of Aβ plaques in a relatively short MR scan time of 2 hr was examined (data not shown). Similar circular signal hypointensities as seen in Fig. 2a were clearly visible in the areas of cortex and hippocampus on the MR images acquired with spatial resolution of 72 × 78 × 200 μm3 and an MR scan time of 2 hr, which is approaching reasonable in vivo MR scan times.
DISCUSSION
In this study, we report the visualization of Aβ plaques using MR microscopy (54 × 58 × 200 μm3) without any exogenous contrast reagent. Aβ plaques in the cortex and hippocampus of PS/APP mouse brain were visualized on T2-weighted MR images using an FSE sequence.
When T2-weighted MRI is used in the absence of a plaque-specific contrast reagent, some of the signal hypointensities seen in the brain may not be attributable to Aβ plaques alone, since blood vessels, microhemorrhage, and local axonal fibers may also cause signal losses. Recently, it has been reported that senile plaques in human AD brain samples do not induce susceptibility effects in T2*-weighted images (18). Most of the signal hypointensities in that study were attributed to blood vessels present in the tissue. However, in the present study the contribution from the blood vessels to the MR signal hypointensities is thought to be minimal, since very similar distributions of signal hypointensities are observable in the PS/APP mouse brains regardless of PBS perfusion. The fact that NTg mice with the same preparation showed no signal hypointensities in the brain regardless of PBS perfusion further supports the conclusion that signal hypointensities were not caused by the contribution of blood in vessels.
With respect to the contribution of large axonal fibers, white matter appears dark in the T2-weighted images and can complicate the identification of Aβ plaques. Considering that major axonal fibers are found in the areas of corpus callosum and thalamus, and can be clearly distinguished from other circular signal hypointensities in the areas of cortex and hippocampus, the observed circular signal hypointensities in cortex and hippocampus is unlikely from axonal fibers. However, the ability to identify Aβ plaques in the regions containing white matter tracts was limited due to similar signal characteristics.
The specificity of MR contrast of Aβ plaques can be improved using targeted MR contrast reagents. However, only a few contrast reagents suitable for MR studies have been reported to date, e.g., putrescine-Gd-Aβ (11), Gd-DTPA-Aβ, and MION-Aβ (12). Additionally, the toxicity of contrast reagents has yet to be established for in vivo studies.
One possible mechanism of the reduction of MR signal intensities in Aβ plaques observed in this study is shortening of T2 values due to the presence of iron in the plaques. Previous studies using biochemical, immunohistochemical, and analytical methods have demonstrated the presence of metal ions, including iron, associated with amyloid plaques (19-21). It is reported that large Aβ plaques with iron accumulation in thalamic areas of a different transgenic mouse model of AD (APP 717I, London mutation) were detectable using T2*-weighted MR images (22). In that study, smaller plaques in the cortex and hippocampus were not visible. In comparison, our study shows the presence of MRI signal hypointensities in the thalamic regions as well as in the cortex and hippocampus of PS/APP mice (Figs. 2a, 3a,c), which is consistent with histological sections. However, the direct comparison of their results with our current observations is difficult due to the differences in pulse sequences, imaging resolution, and other MR parameters, and transgenic animal models. To demonstrate the presence of iron in the plaques, we performed histological staining of iron (Fe3+) using the DAB-enhanced Perl’s reaction counterstained with nuclear fast red (16). Histological sections fixed with methacarn (data not shown) or formalin showed the presence of iron in Aβ plaques (Fig. 5), which is consistent with previous observation in humans (23-25) and in another transgenic mouse model of AD pathology (16). Our data show a close resemblance of distribution of iron staining and Aβ staining in neighboring sections of a PSAPP mouse brain. Although not all Aβ plaques were stained with iron, many Aβ plaques were colocalized with iron. Considering the fact that these are neighboring slices, along with the thickness of sections and the size of the plaques, it is likely that a majority of Aβ plaques contain iron. However, further study is needed to investigate the extent of colocalization of iron and Aβ plaques.
Iron has been associated with lower T2 values in areas associated with high iron concentration, such as globus pallidum and red nucleus, compared to surrounding areas (26-28). Therefore, it is likely that the signal hypointensities in the current T2-weighted images are caused by reduction of T2 values associated with increased iron content in Aβ plaques. This observation is also consistent with our previous study demonstrating short T2 values in cortex and hippocampus of PS/APP mice in vivo compared to those of nontransgenic mice (29). Further studies are needed to characterize the colocalization of Aβ plaques and iron and the effect of the presence of iron in the plaques on the MRI contrast. However, the current study cannot exclude the possibility that the reduction of MR signal intensity may be due to the reduction of water content in Aβ plaques.
Similar constellations of MR signal hypointensities and Aβ plaques in the corresponding histology sections were identified (Fig. 4); however, it was rather difficult to achieve co-registration of each plaque in MRI and histology point by point. Direct superposition of the two images could not be performed, as the histological preparation procedures caused nonisotropic size changes, and the orientation of histological sectioning did not exactly coincide with that of MRI. Slice thickness differences between MR images (200 μm) and histology sections (50 μm) posed additional difficulties in co-registration. With careful histological preparation and further improved MR methods such as 3D data acquisition with isotropic resolution and the use of image co-registration software, direct comparison may be achievable. In the co-registered MR and Aβ histological images, the size of the MR signal hypointensities did not always appear to match Aβ plaques in corresponding histological sections. The size mismatch may be explained partly by the difference in slice thickness between MR and histology. This mismatch may also be the result of microscopic susceptibility effects caused by paramagnetic particles such as iron in Aβ plaques, which would effectively extend the MR signal hypointensities beyond the size of actual plaques.
Although many circular signal hypointensities were clearly identifiable in the MR images of PS/APP mouse brain, overall cortical areas and hippocampus showed much higher signal variations compared to similar regions in the brains of PS or NTg mice. The higher signal inhomogeneity in MR images of PS/APP mouse brain compared with those of PS or NTg mouse brains with similar overall SNR may reflect the presence of numerous smaller size Aβ plaques (see Fig. 4 histology sections), which could not be identified individually but contributed to the overall MR signal of the much larger image voxels (i.e., partial volume effects). This observation suggests that the signal variations in homogeneous tissue areas such as cortex may be used to quantify plaque burden without requiring very high spatial resolution.
The formalin fixation process alters tissue characteristics by forming cross-links between proteins and/or proteins and nucleic acids, and creating hydroxymethylene bridges and binding of calcium ions (30). For MR imaging, the fixation process enhances gray-white matter contrast (15), which can also be seen in Figs. 2 and 3. However, the fixation process did not alter the plaque contrast for MRI, as demonstrated in Figs. 2a and 3c, indicating that the plaque contrast observed in the fixed PS/APP mouse brains was not due to the effect of the formalin fixation process.
The presence of plaque contrast in nonfixed brain tissue opens the possibility of in vivo plaque imaging. To date, most MR studies that have attempted to visualize Aβ plaques have been achieved with substantially long MR scan times of over 10 hr, which is not compatible with in vivo studies. In the present study, we achieved a reduction of the MR scan time to ~2 hr at 7 T for imaging Aβ plaques of fixed transgenic mouse brain with careful optimization of MR parameters. Although this scan time is approaching a range acceptable to in vivo imaging, further reduction is necessary. This may be possible by the use of more sensitive RF coils, such as a volume-transmit and surface-receive coil set, higher field strength, and more time-efficient pulse sequence design with reduced base TE and increased signal sampling time. Another important factor for in vivo Aβ plaque imaging is the reduction of artifacts and blurring caused by physiological motion, such as breathing and cardiac pulsation, which can be alleviated by improved immobilization of the mouse head in conjunction with cardiac and/or respiratory gating.
In this study, we visualized Aβ plaques using a T2-weighted imaging sequence in formalin-fixed PS/APP mouse brain and demonstrated the presence of the Aβ plaque contrast in a nonfixed brain. The Aβ plaques in the MR images were confirmed by comparing the immunohistological analysis of the same brain sections. MR parameters were then optimized, allowing the visualization of Aβ plaques within a relatively short scan time of ~2 hr, compatible with in vivo imaging. Having shown that plaque contrast and MR scan times are compatible with in vivo applications, further technical development will be required to minimize cardiac and respiratory motion artifacts.
ACKNOWLEDGMENT
NIA
P01 AG17617-02
NINDS
R01 NS30899-06
Wyeth
The authors thank Kayte Gaynor and Andrew Klein for technical assistance in sectioning and staining histological sections.
REFERENCES
- 1.Schenk D, Barbour R, Dunn W, Gordon G, Grajeda H, Guido T, Hu K, Huang J, Johnson-Wood K, Khan K, Kholodenko D, Lee M, Liao Z, Lieberburg I, Motter R, Mutter L, Soriano F, Shopp G, Vasquez N, Vandevert C, Walker S, Wogulis M, Yednock T, Games D, Seubert P. Immunization with amyloid-beta attenuates Alzheimer-disease-like pathology in the PDAPP mouse. Nature. 1999;400:173–177. doi: 10.1038/22124. [DOI] [PubMed] [Google Scholar]
- 2.Matsuoka Y, Picciano M, Malester B, LaFrancois J, Zehr C, Daeschner JM, Olschowka JA, Fonseca MI, O’Banion MK, Tenner AJ, Lemere CA, Duff K. Inflammatory responses to amyloidosis in a transgenic mouse model of Alzheimer’s disease. Am J Pathol. 2001;158:1345–1354. doi: 10.1016/S0002-9440(10)64085-0. [DOI] [PMC free article] [PubMed] [Google Scholar]
- 3.Takeuchi A, Irizarry MC, Duff K, Saido TC, Hsiao Ashe K, Hasegawa M, Mann DM, Hyman BT, Iwatsubo T. Age-related amyloid beta deposition in transgenic mice overexpressing both Alzheimer mutant presenilin 1 and amyloid beta precursor protein Swedish mutant is not associated with global neuronal loss. Am J Pathol. 2000;157:331–339. doi: 10.1016/s0002-9440(10)64544-0. [DOI] [PMC free article] [PubMed] [Google Scholar]
- 4.Kung MP, Hou C, Zhuang ZP, Skovronsky DM, Zhang B, Gur TL, Trojanowski JQ, Lee VM, Kung HF. Radioiodinated styrylbenzene derivatives as potential SPECT imaging agents for amyloid plaque detection in Alzheimer’s disease. J Mol Neurosci. 2002;19:7–10. doi: 10.1007/s12031-002-0003-9. [DOI] [PubMed] [Google Scholar]
- 5.Zhuang ZP, Kung MP, Hou C, Plossl K, Skovronsky D, Gur TL, Trojanowski JQ, Lee VM, Kung HF. IBOX(2-(4′-dimethylaminophenyl)-6-iodobenzoxazole): a ligand for imaging amyloid plaques in the brain. Nucl Med Biol. 2001;28:887–894. doi: 10.1016/s0969-8051(01)00264-5. [DOI] [PubMed] [Google Scholar]
- 6.Shoghi-Jadid K, Small GW, Agdeppa ED, Kepe V, Ercoli LM, Siddarth P, Read S, Satyamurthy N, Petric A, Huang SC, Barrio JR. Localization of neurofibrillary tangles and beta-amyloid plaques in the brains of living patients with Alzheimer disease. Am J Geriatr Psychiatry. 2002;10:24–35. [PubMed] [Google Scholar]
- 7.Bacskai BJ, Kajdasz ST, Christie RH, Carter C, Games D, Seubert P, Schenk D, Hyman BT. Imaging of amyloid-beta deposits in brains of living mice permits direct observation of clearance of plaques with immunotherapy. Nat Med. 2001;7:369–372. doi: 10.1038/85525. [DOI] [PubMed] [Google Scholar]
- 8.Mathis CA, Bacskai BJ, Kajdasz ST, McLellan ME, Frosch MP, Hyman BT, Holt DP, Wang Y, Huang GF, Debnath ML, Klunk WE. A lipophilic thioflavin-T derivative for positron emission tomography (PET) imaging of amyloid in brain. Bioorg Med Chem Lett. 2002;12:295–298. doi: 10.1016/s0960-894x(01)00734-x. [DOI] [PubMed] [Google Scholar]
- 9.Klunk WE, Bacskai BJ, Mathis CA, Kajdasz ST, McLellan ME, Frosch MP, Debnath ML, Holt DP, Wang Y, Hyman BT. Imaging Abeta plaques in living transgenic mice with multiphoton microscopy and methoxy-X04, a systemically administered Congo red derivative. J Neuropathol Exp Neurol. 2002;61:797–805. doi: 10.1093/jnen/61.9.797. [DOI] [PubMed] [Google Scholar]
- 10.Benveniste H, Einstein G, Kim KR, Hulette C, Johnson GA. Detection of neuritic plaques in Alzheimer’s disease by magnetic resonance microscopy. Proc Natl Acad Sci U S A. 1999;96:14079–14084. doi: 10.1073/pnas.96.24.14079. [DOI] [PMC free article] [PubMed] [Google Scholar]
- 11.Poduslo JF, Wengenack TM, Curran GL, Wisniewski T, Sigurdsson EM, Macura SI, Borowski BJ, Jack CR., Jr Molecular targeting of Alzheimer’s amyloid plaques for contrast-enhanced magnetic resonance imaging. Neurobiol Dis. 2002;11:315–329. doi: 10.1006/nbdi.2002.0550. [DOI] [PubMed] [Google Scholar]
- 12.Wadghiri YZ, Sigurdsson EM, Sadowski M, Elliott JI, Li Y, Scholtzova H, Tang CY, Aguinaldo G, Pappolla M, Duff K, Wisniewski T, Turnbull DH. Detection of Alzheimer’s amyloid in transgenic mice using magnetic resonance microimaging. Magn Reson Med. 2003;50:293–302. doi: 10.1002/mrm.10529. [DOI] [PubMed] [Google Scholar]
- 13.Hsiao K, Chapman P, Nilsen S, Eckman C, Harigaya Y, Younkin S, Yang F, Cole G. Correlative memory deficits, Abeta elevation, and amyloid plaques in transgenic mice. Science. 1996;274:99–102. doi: 10.1126/science.274.5284.99. [DOI] [PubMed] [Google Scholar]
- 14.Holcomb L, Gordon MN, McGowan E, Yu X, Benkovic S, Jantzen P, Wright K, Saad I, Mueller R, Morgan D, Sanders S, Zehr C, O’Campo K, Hardy J, Prada CM, Eckman C, Younkin S, Hsiao K, Duff K. Accelerated Alzheimer-type phenotype in transgenic mice carrying both mutant amyloid precursor protein and presenilin 1 transgenes. Nat Med. 1998;4:97–100. doi: 10.1038/nm0198-097. [DOI] [PubMed] [Google Scholar]
- 15.Benveniste H, Blackband S. MR microscopy and high resolution small animal MRI: applications in neuroscience research. Prog Neurobiol. 2002;67:393–420. doi: 10.1016/s0301-0082(02)00020-5. [DOI] [PubMed] [Google Scholar]
- 16.Smith MA, Hirai K, Hsiao K, Pappolla MA, Harris PL, Siedlak SL, Tabaton M, Perry G. Amyloid-beta deposition in Alzheimer transgenic mice is associated with oxidative stress. J Neurochem. 1998;70:2212–2215. doi: 10.1046/j.1471-4159.1998.70052212.x. [DOI] [PubMed] [Google Scholar]
- 17.Gruetter R. Automatic, localized in vivo adjustment of all first- and second-order shim coils. Magn Reson Med. 1993;29:804–811. doi: 10.1002/mrm.1910290613. [DOI] [PubMed] [Google Scholar]
- 18.Dhenain M, Privat N, Duyckaerts C, Jacobs RE. Senile plaques do not induce susceptibility effects in T2*-weighted MR microscopic images. NMR Biomed. 2002;15:197–203. doi: 10.1002/nbm.760. [DOI] [PubMed] [Google Scholar]
- 19.Connor JR, Menzies SL, St Martin SM, Mufson EJ. A histochemical study of iron, transferrin, and ferritin in Alzheimer’s diseased brains. J Neurosci Res. 1992;31:75–83. doi: 10.1002/jnr.490310111. [DOI] [PubMed] [Google Scholar]
- 20.Bush AI. The metallobiology of Alzheimer’s disease. Trends Neurosci. 2003;26:207–214. doi: 10.1016/S0166-2236(03)00067-5. [DOI] [PubMed] [Google Scholar]
- 21.Atwood CS, Martins RN, Smith MA, Perry G. Senile plaque composition and posttranslational modification of amyloid-beta peptide and associated proteins. Peptides. 2002;23:1343–1350. doi: 10.1016/s0196-9781(02)00070-0. [DOI] [PubMed] [Google Scholar]
- 22.Vanhoutte G, Dewachter I, Borghgraef P, Van Leuven F, Van der Linden A. In vivo MRI can discern amyloid plaques in the Alzheimer APP[V717I] mouse model; Proc 10th Scientific Meeting ISMRM, Honolulu; 2002. p. 1205. [Google Scholar]
- 23.LeVine SM. Iron deposits in multiple sclerosis and Alzheimer’s disease brains. Brain Res. 1997;760:298–303. doi: 10.1016/s0006-8993(97)00470-8. [DOI] [PubMed] [Google Scholar]
- 24.Smith MA, Harris PL, Sayre LM, Perry G. Iron accumulation in Alzheimer disease is a source of redox-generated free radicals. Proc Natl Acad Sci U S A. 1997;94:9866–9868. doi: 10.1073/pnas.94.18.9866. [DOI] [PMC free article] [PubMed] [Google Scholar]
- 25.Bartzokis G, Sultzer D, Cummings J, Holt LE, Hance DB, Henderson VW, Mintz J. In vivo evaluation of brain iron in Alzheimer disease using magnetic resonance imaging. Arch Gen Psychiatry. 2000;57:47–53. doi: 10.1001/archpsyc.57.1.47. [DOI] [PubMed] [Google Scholar]
- 26.Drayer B, Burger P, Darwin R, Riederer S, Herfkens R, Johnson GA. MRI of brain iron. AJR Am J Roentgenol. 1986;147:103–110. doi: 10.2214/ajr.147.1.103. [DOI] [PubMed] [Google Scholar]
- 27.Schenck JF. Imaging of brain iron by magnetic resonance: T2 relaxation at different field strengths. J Neurol Sci. 1995;134(Suppl):10–18. doi: 10.1016/0022-510x(95)00203-e. [DOI] [PubMed] [Google Scholar]
- 28.Brooks RA, Vymazal J, Bulte JW, Baumgarner CD, Tran V. Comparison of T2 relaxation in blood, brain, and ferritin. J Magn Reson Imag. 1995;5:446–450. doi: 10.1002/jmri.1880050414. [DOI] [PubMed] [Google Scholar]
- 29.Helpern JA, Lee SP, Falangola MF, Dyakin VV, Bogart A, Ardekani B, Duff K, Branch C, Wisniewski T, de Leon MJ, Wolf O, O’Shea J, Nixon RA. MRI assessment of neuropathology in a transgenic mouse model of Alzheimer’s disease. Magn Reson Med. 2004;51:794–798. doi: 10.1002/mrm.20038. [DOI] [PubMed] [Google Scholar]
- 30.Werner M, Chott A, Fabiano A, Battifora H. Effect of formalin tissue fixation and processing on immunohistochemistry. Am J Surg Pathol. 2000;24:1016–1019. doi: 10.1097/00000478-200007000-00014. [DOI] [PubMed] [Google Scholar]