Abstract
Purpose
To determine reproducibility of the femoral condyle cartilage volume (CV) in cross-sectional and longitudinal studies using various 3D imaging techniques at 1.5 T and 3T.
Materials and methods
In 21 subjects with osteoarthritis, MR images including four different sequences (sagittal 3D fat suppressed SPGR at 1.5T, fat suppressed FLASH at 3T, water-excitation DESS at 3T, and water-excitation MEDIC at 3T) were acquired at baseline and approximately one year later. The CV measured using semi-automated segmentation software by three readers was analyzed.
Results
The mean of interclass correlation coefficient between each reader from SPGR, FLASH, DESS, and MEDIC was 0.899, 0.948, 0.943, and 0.954, respectively. The mean CV (×104 mm3) measured by each reader from SPGR/FLASH/DESS/MEDIC sequences was the following in this order: 1.34/1.52/1.50/1.35, 1.21/1.43/1.40/1.27, 1.22/1.37/1.36/1.22, and 1.17/1.36/1.35/1.21 by readers 1, 2, 3 (first analysis), and 3(second analysis), respectively. There was no statistically significant difference in CV between any readers in any sequences. The CV measured on FLASH and DESS tended to be greater than that on SPGR or MEDIC.
Conclusion
Inter- and intra-observer reproducibility of cartilage segmentation using semi-automated software was validated. Although there is no statistical significance, there is a tendency of under- or overestimating CV by each sequence.
Keywords: magnetic resonance imaging, knee cartilage, segmentation, reproducibility
Introduction
Osteoarthritis (OA) is the most common type of arthritis and a frequent cause of pain and disability (1). There is no proven pharmacologic treatment that affects the progression of OA. A major problem with the development of a pharmacologic treatment for OA is the lack of a validated, non-invasive method that is both accurate and reproducible at measuring articular cartilage repeatedly over time to determine disease progression (2). Conventional radiography is limited by its inability to directly visualize articular cartilage - the tissue in which the earliest insults of osteoarthritis are thought to occur (3). MRI offers the distinct advantage of visualizing the articular cartilage directly. MRI can detect signal and morphological changes in the cartilage and has been used to detect cartilage surface fraying, fissuring and cartilage thinning (4–10). The standard techniques broadly used in clinical practice and scientific studies are the 2D fast spin-echo (2D FSE) and the 3D spoiled gradient-echo (3D SPGR) sequence (10,11). Both sequences are available on most MRI systems. 2D FSE affords high contrast for evaluating articular cartilage (4–6,10–12). 2D FSE sequences have excellent signal-to-noise ratios, which help to achieve short scan times. The sequence has fewer artifacts than 3D SPGR (13). 3D SPGR sequences have been employed because of their ability to provide high-resolution 3D images (4–6,12). Fat suppression increases the dynamic range of signal intensities in cartilage. The 3D imaging capability of this sequence has helped transform it into the standard acquisition technique for quantitative cartilage assessment such as 3D volume or thickness measurements. Recent studies indicate, however, that 3D SPGR is hampered by significant image artifacts that can result in over- or underestimation of cartilage loss (13) and failure of cartilage segmentation for 3D analysis, due to poor contrast between cartilage and surrounding tissues (14).
The most promising novel MRI pulse sequences for cartilage imaging include water-excitation 3D spoiled gradient echo with spectral spatial pulses (3D SS-SPGR) (15–17), 3D steady state free precession (3D SSFP) (18,19), 3D dual echo steady state (DESS) (20), and 3D fastspin-echo (3D FSE) techniques (21). These sequences provide 3D coverage (unlike 2D FSE) while yielding superior CNR between cartilage and surrounding tissues (unlike 3D SPGR), and are likely to improve accuracy and reproducibility of cartilage MRI. 3D DESS imaging, which could obtain higher T2* weighting for high signal intensity in cartilage and synovial fluid, permitted accurate morphology and quantitative assessment of cartilage thickness and volume (22). 3D measurements of total cartilage volume and cartilage thickness have evolved as standard for quantitative MRI based assessment of cartilage loss. However, there is significant disagreement in the literature as to the reproducibility of MRI derived measurements of cartilage loss in the knee (23). On the other hand, novel high-resolution 3D imaging technology is likely to yield surrogate outcome measures for cartilage loss that are substantially more reproducible and accurate than current technology.
The aim of this study was to determine the reproducibility of quantitative measurements of femoral condylecartilage volume (CV) in cross-sectional and longitudinal studies using various 3D imaging techniques at 1.5 T and 3T.
Materials and Methods
Patients
Twenty-one subjects (7 men and 14 women; age, 47–81 years old; mean age 61 years old) with medial compartment osteoarthritis (Kellgren-Lawrence stage 1 and 2) were enrolled in this study.
Magnetic resonance imaging and pulse sequences
All 1.5T imaging was performed on a GE Signa Excite (GEMedical Systems, Milwaukee, WI) using an extremity coil (quadrature transmit, 4-coil phased-array receive) (Medical Advances, Milwaukee, WI). 3T imaging was performed on a Siemens Trio 3T scanner (Siemens Medical Solutions USA Inc., Malvern, PA) with an 8-channel transmit/receive phased array knee coil (Medical Advances, Milwaukee, WI).
Our protocol consisted of four different sequences: sagittal 3D 1) fat-suppressed SPGR at 1.5T (SPGR), 2) fat-suppressed fast low angle shot at 3T (FLASH), 3) water-excitation double-echo steady-state at 3T (DESS), and 4) water-excitation multi-echo data image combination at 3T (MEDIC) were acquired at baseline and approximately one year later. The scan parameters of each sequence were based on our preliminary work and are shown in Table 1.
Table 1.
Scan parameters of each sequences
| SPGR | FLASH | DESS | MEDIC | |
|---|---|---|---|---|
| Repetition time (ms) | 39 | 20 | 13.35 | 19 |
| Echo time (ms) | 6.9 | 7.57 | 4.05 | 10 |
| Flip angle (degree) | 45 | 12 | 25 | 45 |
| Slice thickness (mm) | 1.5 | 1 | 0.5 | 0.7 |
| Matrix | 512 × 512 | 448 × 448 | 384 × 384 | 512 × 512 |
| Field of view (mm) | 139.981 × 139.981 | 140 × 140 | 140 × 140 | 140 × 140 |
| Spatial resolution | 1.5 × 0.27 × 0.273 | 1 × 0.312 × 0.312 | 0.5 × 0.312 × 0.312 | 0.7 × 0.273 × 0.273 |
| Pixel volume (mm3) | 0.112 | 0.0973 | 0.0666 | 0.0522 |
SPGR, fat-suppressed 3D spoiled gradient-echo at 1.5T; FLASH, fat-suppressed fast low angle shot at 3T; DESS, water-excitation double echo steady state at 3T; MEDIC, water-excitation multi-echo data image combination at 3T
Segmentation of the knee cartilage
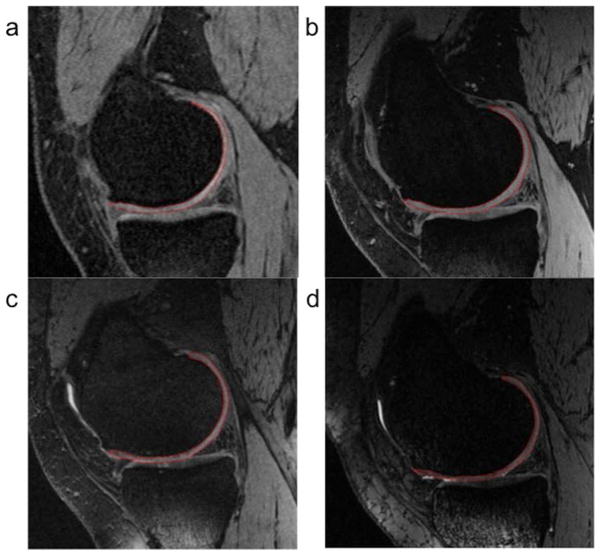
To measure CV of the knee femoral condyle, we used semi-automated segmentation software using an “active contour model” algorithm to refine the segmented margin on each slice of the 3D image series; this step serves to provide a more precise and objective segmentation (24,25). In this software, the reader first selected an image near the center of the cartilage plate and seeded the root point on the bone-cartilage interface. The software then employed an automated edge-tracking algorithm to attempt a segmentation of the cartilage on this slice (Fig. 1). The reader corrected segmented areas manually using a convenient editing tool, if it was needed. Once a central slice was segmented, the software proceeded to an adjacent slice using the computer-delineated margins from the previous slice and an active-contour edge-detection algorithm, to attempt an automated segmentation. This process continued on a slice-by-slice basis until the reader judged that the end of the cartilage plate had been reached. The second half of the cartilage plate was then segmented starting at the central slice and proceeding in the opposite direction. Finally, CVs were calculated by summation of segmented areas. Three readers (an orthopedist, an anesthesiologist, and a radiologist) were trained by one experienced musculoskeletal radiologist (HY) using sample images. All readers were exposed to the images until the group came to a consensus with the HY. Then they independently evaluated images. When there was a poorly visualized interface for defining cartilage, the agreed rationale was to assume continuity of cartilage surface from clear cartilage-soft tissue interface on the same slice or adjacent slices. All readers were blinded to patient identifiers and clinical information, and assessed image data sets randomly. Four weeks following the first evaluation sessions, one reader (reader 3; radiologist) performed segmentation again for intra-observer agreement analysis.
Figure 1.
Examples of segmentation of the femoral condyle cartilage. a: fat-suppressed 3D spoiled gradient-echo sequence (SPGR) at 1.5T. b: fat-suppressed fast low angle shot (FLASH) at 3T. c: water-excitation double-echo steady-state (DESS) at 3T. d: water-excitation multi-echo data image combination (MEDIC) at 3T. The segmentation area of cartilage is shown in a red line on each image.
Statistical analysis
We calculated intraclass correlation coefficient (ICC) for 3 readers to evaluate inter- and intra-observer agreement, and intra-observer agreement was also analyzed by Wilcoxon matched pairs signed rank test. In addition, we compared the knee cartilage volume using Kruskal-Wallis test and Dunn’s multiple comparison test. Differences with P<0.05 were regarded as statistically significant.
Results
The mean and range of interclass correlation coefficient (ICC) between each reader from SPGR, FLASH, DESS, and MEDIC are shown in Table 2. The ICC on SPGR was significantly lower than that on FLASH or MEDIC.
Table 2.
Interclass correlation coefficient value of each sequence
| Sequence | Mean | Range | SD | ||
|---|---|---|---|---|---|
| SPGR | 0.899 | 0.864–0.962 | 0.0297 |
|
|
| FLASH | 0.948 | 0.905–0.995 | 0.0253 | ||
| DESS | 0.943 | 0.924–0.988 | 0.0210 | ||
| MEDIC | 0.954 | 0.937–0.994 | 0.0192 |
SPGR, fat-suppressed 3D spoiled gradient-echo at 1.5T; FLASH, fat-suppressed fast low angle shot at 3T; DESS, water-excitation double echo steady state at 3T; MEDIC, water-excitation multi-echo data image combination at 3T; SD, standard deviation;
, P<0.05;
, P<0.01
The mean CV of the femoral condyle measured by each reader from each sequence is shown in Table 3. There is no significant change in the CV from baseline to one-year follow-up examinations in any sequences by any readers. The mean CV combined with baseline and one-year follow-up measured by each reader from SPGR/FLASH/DESS/MEDIC sequences was the following order: 1.34/1.52/1.50/1.35, 1.21/1.43/1.40/1.27, 1.22/1.37/1.36/1.22, 1.17/1.36/1.35/1.21 (×104 mm3) by readers 1, 2, 3 (first analysis), and 3(second analysis), respectively. In terms of inter-reader difference, there was no statistically significant difference in the CV between any readers in any sequences. Regarding intra-reader reproducibility measured by reader 3, there was no significant difference in the CV between first and second measurements in all sequences, except for SPGR at baseline.
Table 3.
Mean femoral condyle cartilage volume measured with each sequence
| SPGR (×104 mm3) | FLASH (×104 mm3) | DESS (×104 mm3) | MEDIC (×104 mm3) | ||
|---|---|---|---|---|---|
| Reader 1 | baseline | 1.29 | 1.5 | 1.49 | 1.36 |
| one-year follow-up | 1.34 | 1.54 | 1.53 | 1.29 | |
| baseline + one-year follow-up | 1.34 | 1.52 | 1.5 | 1.35 | |
| Reader 2 | baseline | 1.13 | 1.4 | 1.36 | 1.22 |
| one-year follow-up | 1.29 | 1.46 | 1.43 | 1.29 | |
| baseline + one-year follow-up | 1.21 | 1.43 | 1.4 | 1.27 | |
| Reader 3 (first measurement) | baseline | 1.26* | 1.35 | 1.36 | 1.22 |
| one-year follow-up | 1.17 | 1.39 | 1.38 | 1.22 | |
| baseline + one-year follow-up | 1.22 | 1.37 | 1.36 | 1.22 | |
| Reader 3 (second measurement) | baseline | 1.18* | 1.35 | 1.33 | 1.21 |
| one-year follow-up | 1.16 | 1.38 | 1.37 | 1.22 | |
| baseline + one-year follow-up | 1.17 | 1.36 | 1.35 | 1.21 | |
| Overall | 1.22 | 1.41 | 1.39 | 1.25 |
There is significant difference in the cartilage volume between first and second measurements by reader 3 at baseline (P<0.01). SPGR, 3D spoiled gradient-echo at 1.5T; FLASH, fast low angle shot at 3T; DESS, double-echo steady-state at 3T; MEDIC, multi-echo data image combination at 3T
Although no statistical significance was seen, the CV from each sequences demonstrated slightly different values. The CV measured on FLASH and DESS at 3T tended to be greater than that on SPGR at 1.5T or MEDIC at 3T at baseline, one-year follow-up, and in combined examinations (Fig. 2).
Figure 2.
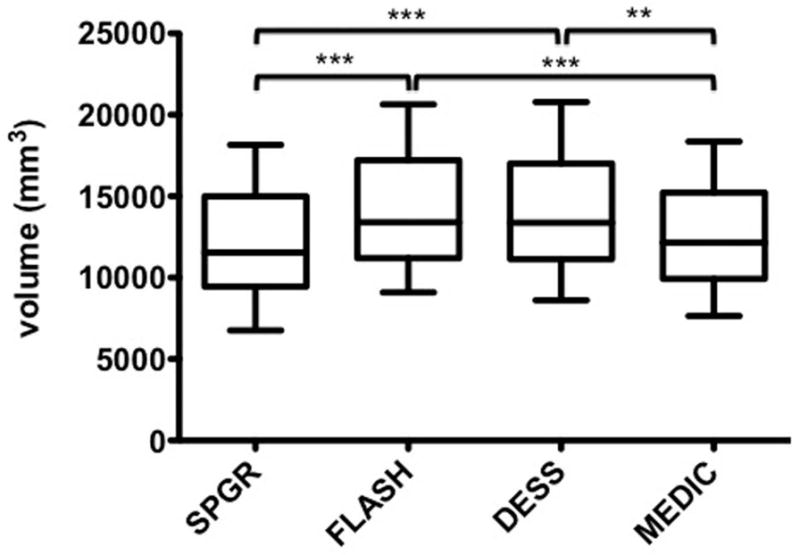
Overall mean and standard deviation of femoral condyle cartilage volume measured on each sequence. **, P<0.01; ***, P<0.001.
Discussion
In this study, ICC values of all sequences were very high. This indicates reproducibility of the CV of the femoral condyle in the knee was excellent in all sequences. Reproducibility of the CV measured on DESS images using the same semi-automated software has shown low root mean square coefficient of variation value and demonstrated acceptable results (24). Our results of the measured CV showed no significant difference among the readers, though the experience of diagnostic radiology varied among them. However, reproducibility on SPGR at 1.5T was slightly worse than on other sequences at 3T. We attributed that to thicker slice thickness on SPGR since a previous study reported change in slice thickness from 1 mm to 0.5 mm resulted on average in a 2% decrease in coefficient of variation (20). Difference of magnetic field strength might also contribute the result because signal-to-noise ratio is lower at lower magnetic field strength (26).
Clinically, MRI has played an important role with follow-up evaluation of the knee cartilage in patients with osteoarthritis, because MR findings are significantly correlated with arthroscopy findings (27) and bone marrow lesion size is associated with knee cartilage loss (28). Our results also supported usefulness of MRI to monitor the CV longitudinally due to the excellent reproducibility. However, there was a pitfall in the methods of segmentation, i.e. differences of the CV between the sequences.
The sequences in our study could be classified into two types, conventional sequences (SPGR and FLASH) and composite sequences (DESS and MEDIC). When the former sequences were compared, the CV from SPGR was smaller than that from FLASH. Cartilage is demonstrated as hyperintensity as opposed to adjacent hypointense joint effusion and bone marrow on these sequences. The CV was calculated by summation of segmented areas shown as hyperintensity on each image. Since slice thickness is a discrete value, its difference would affect a final CV. It seems that CV calculations with thicker slice thickness demonstrates more variations from true values, especially when the far medial or lateral aspect of the femoral condyle cartilage is segmented, and may result in smaller values due to larger partial volume effect (Fig. 3). The slice thickness on SPGR images was 1.5 mm, while that on FLASH images was 1 mm in this study. In addition to slice thickness effect, ambiguity of surface contour in posterior region of femoral condylar cartilage, linear area of high signal intensity in deep zone adjacent to subchondral bone of femoral condyle, and pseudolaminar structure due to truncation artifact were more significant on SPGR images as previously reported (Fig. 4)(13). The truncation artifact can result in an apparent, though fictitious, laminar appearance of cartilage and significant signal intensity variations (29). These factors influenced the difference in CV between SPGR and FLASH.
Figure 3.
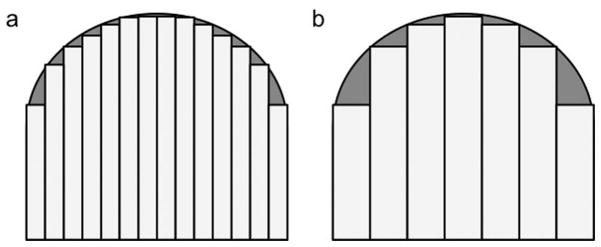
Schematic images of the femoral condyle cartilage segmentation on (a) thin and (b) thick slice images. The area of underestimation on thick slice images (gray area) is larger than that on thin slice images.
Figure 4.
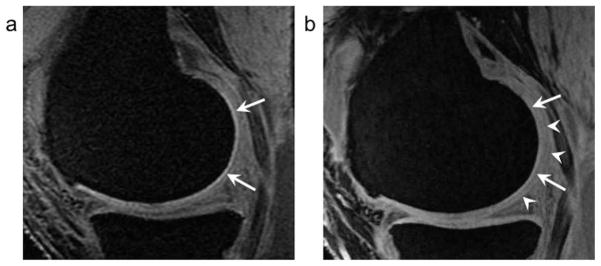
A 57-year old woman. a: On fat-suppressed 3D SPGR at 1.5T, a linear area of marked high signal intensity in deep zone adjacent to subchondral bone of the femoral condyle (arrows) is seen with resultant unclear contour of the knee cartilage.
b: Fat-suppressed FLASH at 3T demonstrates similar but lesser degree of a linear area of high signal intensity in deep zone adjacent to subchondral bone of the femoral condyle with unclear contour of the knee cartilage (arrow heads).
When DESS and MEDIC were compared, the CV calculated from MEDIC was smaller than that from DESS. The MEDIC sequence, one of the GRE sequences, is a useful method for detecting cartilage lesions because high-resolution images are available with a reasonable acquisition time. However, it addresses the same major limitations as other gradient-echo sequences, such as low signal-to-noise ratio, image degradation due to susceptibility gradients, and chemical shift (30). On MEDIC images, a low-intensity band at the surface of the knee cartilage was frequently seen (Fig. 5). This seemed to be due to a kind of artifact like chemical shift or susceptibility artifact. Readers might segment cartilage just deep to this surface low signal, which would result in underestimation of CV on MEDIC images. Lower signal-to-noise ratio of MEDIC also might have the potential for causing underestimation.
Figure 5.
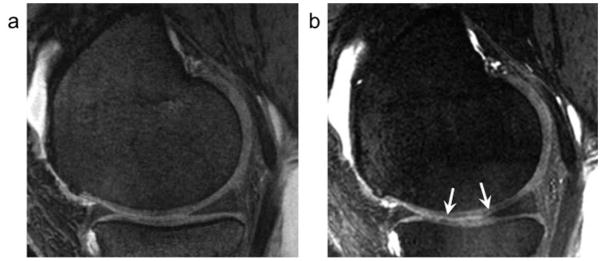
A 57-year old woman (same case in figure 4). a: On water-excitation DESS at 3T, there is no band-like low intensity in the knee cartilage. b: On water-excitation MEDIC at 3T, a band-like low signal intensity along the cartilage surface over the femoral condyle is clearly seen (arrows).
Some limitations in our study must be noted. First, number of the subjects in this study was small. However, our sample size was likely to be valid as the calculation was based on previous literature (27). Second, there was no gold standard of the CV in our study. We believed this would be a minor issue because the aim of this study was not to evaluate accurate measurement of cartilage volume, but to validate the reproducibility of our method in various 3D sequences. To verify the accuracy of longitudinal CV change by this semi-automated segmentation method, further long term follow-up studies are necessary. Third, reproducibility of the CV in the severe OA patients was not validated because the subjects in this study did not include patients with Kellgren-Lawrence stage 3 or 4. In these patients, assessment of meniscal injury, osteophyte, and subchondral bone cyst as well as cartilage injury is needed for staging.
Also, there may be more significant differences in the CV between 3D imaging sequences in patients with moderate or severe OA. Finally, we only measured the femoral condyle cartilage volume in this study because it is more challenging. Measuring the CV in the femoral condyle is more difficult than measuring the CV in the tibial plateau or the patella because of its thin and curved structure. The volume in the femoral condyle is also likely to be influenced by multiple factors, such as slice thickness, matrix size, imaging contrast, and measurement errors. However, it would be necessary to measure cartilage volume of all compartments, including the tibia and patella, to document change in disease.
In conclusion, the measurement of the CV of the femoral condyle with semi-automated segmentation technique is reproducible regardless of level of readers’ experience or type of 3D imaging sequences. The CV on SPGR at 1.5T and on MEDIC at 3T tends to be smaller than that of FLASH or DESS at 3T. We should know sequence dependent cartilage volume difference when we compare cartilage volume to previous studies, or conduct follow-up longitudinal studies.
Acknowledgments
Grant Support:
This study was supported in part by NIH/NIAMS: R01 AR51873-01, Novel High Resolution MRI Surrogates for Arthritis Trials.
References
- 1.Doherty M, Hutton C, Bayliss MT. Osteoarthritis. In: Maddison PJ, Isenberg DA, Woo P, Glass DN, editors. Oxford Textbook of Rheumatology. Oxford, New York, Tokyo: Oxford University Press; 1993. pp. 959–983. [Google Scholar]
- 2.Cicuttini F, Forbes A, Asbeutah A, Morris K, Stuckey S. Comparison and reproducibility of fast and conventional spoiled gradient-echo magnetic resonance sequences in the determination of knee cartilage volume. J Orthop Res. 2000;18(4):580–584. doi: 10.1002/jor.1100180410. [DOI] [PubMed] [Google Scholar]
- 3.Burgkart R, Glaser C, Hyhlik-Durr A, Englmeier KH, Reiser M, Eckstein F. Magnetic resonance imaging-based assessment of cartilage loss in severe osteoarthritis: accuracy, precision, and diagnostic value. Arthritis Rheum. 2001;44(9):2072–2077. doi: 10.1002/1529-0131(200109)44:9<2072::AID-ART357>3.0.CO;2-3. [DOI] [PubMed] [Google Scholar]
- 4.Disler DG. Fat-suppressed three-dimensional spoiled gradient-recalled MR imaging: assessment of articular and physeal hyaline cartilage. AJR Am J Roentgenol. 1997;169(4):1117–1123. doi: 10.2214/ajr.169.4.9308475. [DOI] [PubMed] [Google Scholar]
- 5.Disler DG, McCauley TR, Kelman CG, et al. Fat-suppressed three-dimensional spoiled gradient-echo MR imaging of hyaline cartilage defects in the knee: comparison with standard MR imaging and arthroscopy. AJR Am J Roentgenol. 1996;167(1):127–132. doi: 10.2214/ajr.167.1.8659356. [DOI] [PubMed] [Google Scholar]
- 6.Disler DG, McCauley TR, Wirth CR, Fuchs MD. Detection of knee hyaline cartilage defects using fat-suppressed three-dimensional spoiled gradient-echo MR imaging: comparison with standard MR imaging and correlation with arthroscopy. AJR Am J Roentgenol. 1995;165(2):377–382. doi: 10.2214/ajr.165.2.7618561. [DOI] [PubMed] [Google Scholar]
- 7.McCauley TR, Kier R, Lynch KJ, Jokl P. Chondromalacia patellae: diagnosis with MR imaging. AJR Am J Roentgenol. 1992;158(1):101–105. doi: 10.2214/ajr.158.1.1727333. [DOI] [PubMed] [Google Scholar]
- 8.Peterfy CG, Majumdar S, Lang P, van Dijke CF, Sack K, Genant HK. MR imaging of the arthritic knee: improved discrimination of cartilage, synovium, and effusion with pulsed saturation transfer and fat-suppressed T1-weighted sequences. Radiology. 1994;191(2):413–419. doi: 10.1148/radiology.191.2.8153315. [DOI] [PubMed] [Google Scholar]
- 9.Peterfy CG, van Dijke CF, Janzen DL, et al. Quantification of articular cartilage in the knee with pulsed saturation transfer subtraction and fat-suppressed MR imaging: optimization and validation. Radiology. 1994;192(2):485–491. doi: 10.1148/radiology.192.2.8029420. [DOI] [PubMed] [Google Scholar]
- 10.Potter HG, Linklater JM, Allen AA, Hannafin JA, Haas SB. Magnetic resonance imaging of articular cartilage in the knee. An evaluation with use of fast-spin-echo imaging. J Bone Joint Surg Am. 1998;80(9):1276–1284. doi: 10.2106/00004623-199809000-00005. [DOI] [PubMed] [Google Scholar]
- 11.Broderick LS, Turner DA, Renfrew DL, Schnitzer TJ, Huff JP, Harris C. Severity of articular cartilage abnormality in patients with osteoarthritis: evaluation with fast spin-echo MR vs arthroscopy. AJR Am J Roentgenol. 1994;162(1):99–103. doi: 10.2214/ajr.162.1.8273700. [DOI] [PubMed] [Google Scholar]
- 12.Recht MP, Piraino DW, Paletta GA, Schils JP, Belhobek GH. Accuracy of fat-suppressed three-dimensional spoiled gradient-echo FLASH MR imaging in the detection of patellofemoral articular cartilage abnormalities. Radiology. 1996;198(1):209–212. doi: 10.1148/radiology.198.1.8539380. [DOI] [PubMed] [Google Scholar]
- 13.Yoshioka H, Stevens K, Genovese M, Dillingham MF, Lang P. Articular cartilage of knee: normal patterns at MR imaging that mimic disease in healthy subjects and patients with osteoarthritis. Radiology. 2004;231(1):31–38. doi: 10.1148/radiol.2311020453. [DOI] [PubMed] [Google Scholar]
- 14.Gandy SJ, Dieppe PA, Keen MC, Maciewicz RA, Watt I, Waterton JC. No loss of cartilage volume over three years in patients with knee osteoarthritis as assessed by magnetic resonance imaging. Osteoarthritis Cartilage. 2002;10(12):929–937. doi: 10.1053/joca.2002.0849. [DOI] [PubMed] [Google Scholar]
- 15.Graichen H, Springer V, Flaman T, et al. Validation of high-resolution water-excitation magnetic resonance imaging for quantitative assessment of thin cartilage layers. Osteoarthritis Cartilage. 2000;8(2):106–114. doi: 10.1053/joca.1999.0278. [DOI] [PubMed] [Google Scholar]
- 16.Hyhlik-Durr A, Faber S, Burgkart R, et al. Precision of tibial cartilage morphometry with a coronal water-excitation MR sequence. Eur Radiol. 2000;10(2):297–303. doi: 10.1007/s003300050047. [DOI] [PubMed] [Google Scholar]
- 17.Yoshioka H, Stevens K, Hargreaves BA, et al. Magnetic resonance imaging of articular cartilage of the knee: comparison between fat-suppressed three-dimensional SPGR imaging, fat-suppressed FSE imaging, and fat-suppressed three-dimensional DEFT imaging, and correlation with arthroscopy. J Magn Reson Imaging. 2004;20(5):857–864. doi: 10.1002/jmri.20193. [DOI] [PubMed] [Google Scholar]
- 18.Hargreaves BA, Gold GE, Lang PK, et al. MR imaging of articular cartilage using driven equilibrium. Magn Reson Med. 1999;42(4):695–703. doi: 10.1002/(sici)1522-2594(199910)42:4<695::aid-mrm11>3.0.co;2-z. [DOI] [PubMed] [Google Scholar]
- 19.Reeder SB, Pelc NJ, Alley MT, Gold GE. Rapid MR imaging of articular cartilage with steady-state free precession and multipoint fat-water separation. AJR Am J Roentgenol. 2003;180(2):357–362. doi: 10.2214/ajr.180.2.1800357. [DOI] [PubMed] [Google Scholar]
- 20.Hardy PA, Recht MP, Piraino D, Thomasson D. Optimization of a dual echo in the steady state (DESS) free-precession sequence for imaging cartilage. J Magn Reson Imaging. 1996;6(2):329–335. doi: 10.1002/jmri.1880060212. [DOI] [PubMed] [Google Scholar]
- 21.Simon EM, McCaffery S, Rowley HA, Fischbein NJ, Shimikawa A, O’Brien JM. High-resolution 3D T2-weighted fast spin echo: new applications in the orbit. Neuroradiology. 2003;45(7):489–492. doi: 10.1007/s00234-003-0954-8. [DOI] [PubMed] [Google Scholar]
- 22.Eckstein F, Hudelmaier M, Wirth W, et al. Double echo steady state magnetic resonance imaging of knee articular cartilage at 3 Tesla: a pilot study for the Osteoarthritis Initiative. Annals of the rheumatic diseases. 2006;65(4):433–441. doi: 10.1136/ard.2005.039370. [DOI] [PMC free article] [PubMed] [Google Scholar]
- 23.Hardya PA, Newmark R, Liu YM, et al. The influence of the resolution and contrast on measuring the articular cartilage volume in magnetic resonance images. Magn Reson Imaging. 2000;18(8):965–972. doi: 10.1016/s0730-725x(00)00186-7. [DOI] [PubMed] [Google Scholar]
- 24.Duryea J, Neumann G, Brem MH, et al. Novel fast semi-automated software to segment cartilage for knee MR acquisitions. Osteoarthritis Cartilage. 2007;15(5):487–492. doi: 10.1016/j.joca.2006.11.002. [DOI] [PMC free article] [PubMed] [Google Scholar]
- 25.Brem MH, Lang PK, Neumann G, et al. Magnetic resonance image segmentation using semi-automated software for quantification of knee articular cartilage---initial evaluation of a technique for paired scans. Skeletal Radiol. 2009;38(5):505–511. doi: 10.1007/s00256-009-0658-1. [DOI] [PMC free article] [PubMed] [Google Scholar]
- 26.Bauer JS, Krause SJ, Ross CJ, et al. Volumetric cartilage measurements of porcine knee at 1.5-T and 3. 0-T MR imaging: evaluation of precision and accuracy. Radiology. 2006;241(2):399–406. doi: 10.1148/radiol.2412051330. [DOI] [PubMed] [Google Scholar]
- 27.Pessis E, Drape JL, Ravaud P, Chevrot A, Dougados M, Ayral X. Assessment of progression in knee osteoarthritis: results of a 1 year study comparing arthroscopy and MRI. Osteoarthritis Cartilage. 2003;11(5):361–369. doi: 10.1016/s1063-4584(03)00049-9. [DOI] [PubMed] [Google Scholar]
- 28.Driban JB, Lo GH, Lee JY, et al. Quantitative bone marrow lesion size in osteoarthritic knees correlates with cartilage damage and predicts longitudinal cartilage loss. BMC Musculoskelet Disord. 2011;12:217. doi: 10.1186/1471-2474-12-217. [DOI] [PMC free article] [PubMed] [Google Scholar]
- 29.Frank LR, Brossmann J, Buxton RB, Resnick D. MR imaging truncation artifacts can create a false laminar appearance in cartilage. AJR Am J Roentgenol. 1997;168(2):547–554. doi: 10.2214/ajr.168.2.9016245. [DOI] [PubMed] [Google Scholar]
- 30.Schmid MR, Pfirrmann CW, Koch P, Zanetti M, Kuehn B, Hodler J. Imaging of patellar cartilage with a 2D multiple-echo data image combination sequence. AJR Am J Roentgenol. 2005;184(6):1744–1748. doi: 10.2214/ajr.184.6.01841744. [DOI] [PubMed] [Google Scholar]


