

Abstract
Genome-wide association studies have identified a number of autoimmune disease-susceptibility genes. Whether or not these loci share any regulatory or functional elements, however, is an open question. Finding such common regulators is of considerable research interest in order to define systemic therapeutic targets. The growing amount of experimental genomic annotations, particularly those from the ENCODE project, provide a wealth of opportunities to search for such commonalities. We hypothesized that regulatory commonalities might not only delineate a regulatory landscape predisposing to autoimmune diseases, but also define functional elements distinguishing specific diseases. We further investigated if, and how, disease-specific epigenomic elements can identify novel genes yet to be associated with the diseases. We evaluated transcription factors, histone modifications, and chromatin state data obtained from the ENCODE project for statistically significant over- or under-representation in the promoters of genes associated with Systemic Lupus Erythematosus (SLE), Rheumatoid Arthritis (RA), and Systemic Sclerosis (SSc). We identified BATF, BCL11A, IRF4, NFkB, PAX5, and PU.1 as transcription factors over-represented in SLE- and RA-susceptibility gene promoters. H3K4me1 and H3K4me2 epigenomic marks were associated with SLE susceptibility genes, and H3K9me3 was common to both SLE and RA. In contrast to a transcriptionally active signature in SLE and RA, SSc-susceptibility genes were depleted in activating epigenomic elements. Using epigenomic elements enriched in SLE and RA, we identified additional immune and B cell signaling-related genes with the same elements in their promoters. Our analysis suggests common and disease-specific epigenomic elements that may define novel therapeutic targets for controlling aberrant activation of autoimmune susceptibility genes.
Keywords: epigenetics, genome, ENCODE, autoimmunity, GenomeRunner
Introduction
Complex traits are determined in part by genomic variants at multiple loci. Although most phenotype-associated variants discovered by genome-wide association studies (GWASs) are far from protein-coding regions, even appearing in gene deserts,1 they can affect disease-susceptibility genes by altering their expression, either directly or via distant enhancer loops.2,3 Encouragingly, these disease-susceptibility genes defined by GWASs are convincingly involved in coherent biological processes and molecular pathways.4 One critical challenge in defining disease biology is the absence of understanding which common factors regulate the expression of these disease-associated genes, and what is the cell- and/or tissue-specific origin of such regulation. Such knowledge may not only deepen our understanding of the causes of the diseases, but also provide new therapeutic targets in the era of epigenomic drug development.5,6
In recent years, there has been a rapid growth in experimentally obtained data about functional and regulatory regions across the human genome.7-9 In particular, the ENCODE project has provided a large amount of cell type-specific regulatory data across the entire genome, herein collectively referred to as epigenomic elements.10 The association of epigenomics with disease pathogenesis seems now indisputable,11-14 yet analyses are generally limited to a selected set of epigenomic elements, such as DNA methylation.11,15-17
In this study, we first selected three sets of genes implicated by GWAS as associated with each of three autoimmune disorders: Systemic Lupus Erythematosus (SLE), Rheumatoid Arthritis (RA), and Systemic Scleroderma (SSc). We then extracted and analyzed the promoter regions of these gene sets for enrichment or depletion in transcription factor binding sites (TFBSs), chromatin segmentation states, and histone modification marks. We identified the “strong enhancer” chromatin state as statistically significantly enriched in the promoters of SLE- and RA-susceptibility genes, as well as H3K4 mono- and di-methylation histone marks in Gm12878 EBV-transformed B lymphoblastoid cell line. Out of 148 TFBSs analyzed, only seven were enriched in the promoters of SLE- or RA-susceptibility genes. NFkB, PAX5, BATF, BCL11A, and IRF4 TFBSs were preferentially co-localized to the same promoter regions, while PU.1 and EBF binding sites were over-represented in SLE/RA but tended not to co-localize with the other TFBS. Presumably, if the presence of these epigenomic features in promoters play a role in regulating immune response, then it is reasonable to expect that other gene promoters (besides the ones analyzed) containing them would also tend to be associated with the immune response. Prioritizing genes with these features in their promoters confirmed their tendency to be immune-related and identified several novel candidates that may play a role in autoimmune diseases. Our results demonstrate how epigenomic data can be used to suggest common epigenomic denominators of autoimmune diseases that can be used as potential therapeutic targets, and to identify novel transcripts that may contribute to the development of autoimmune diseases.
Results
Autoimmune-related gene sets partially overlap
We extracted 38 RA-, 34 SLE-, and 32 SSc-associated gene sets from recent reviews of GWAS results (Fig. 1, see Methods).14,18 29% of RA-associated genes overlapped with other gene sets, while 41% and 34% of SLE- and SSc-associated gene sets, respectively, shared genes with other sets. This partial overlap (Table S1; Fig. S1) suggests gene sets may have common, as well as distinct epigenomic regulatory elements enriched in their promoters.

Figure 1. Schematic diagram of the analysis strategy. Disease-associated gene sets were obtained from GWAS reviews, and genomic coordinates of the promoters were extracted. They were tested for the enrichment in TFBSs, histone marks, chromatin segmentation states using GenomeRunner method. Disease-specific sets of epigenomic elements were identified. Additional disease-associated genes were prioritized by the presence of disease-specific epigenomic elements.
Expectedly, disease-specific gene sets shared similar autoimmune-related functions. Ingenuity Pathway Analysis (IPA) identified “quantity of lymphocytes” and “proliferation of T lymphocytes” as the most significant functions enriched among RA-susceptibility genes (P = 1.12 × 10⁻²² and 6.17 × 10⁻²⁰, respectively). “Systemic lupus erythematosus” was the most significant function among SLE-associated genes (P = 5.02 × 10⁻²⁵). “Activation of cells” and “function of leukocytes” were the most significant functions among SSc genes (Table S1). Thus, partially overlapping disease-associated gene sets exhibited immune-related but distinct functions.
Promoters of SLE- and RA-associated genes are enriched in 7 transcription factor binding sites
We began by examining whether or not any of the 148 transcription factor binding sites (TFBSs) obtained experimentally by ChIP-seq were enriched or depleted in our gene sets. First, GenomeRunner identified a distinct set of 7 TFBSs enriched in the promoters of SLE- and RA-susceptibility genes (Fig. 2A; Table S3). PU.1, a hematopoietic stem cell factor, was highly enriched in the promoters of SLE- susceptibility genes. NFkB, IRF4, and BATF were primarily enriched in SLE genes, while PAX5 and BCL11A were enriched in the promoters of SLE and RA genes. EBF was over-represented only in RA promoters. Despite overall picture of TFBS enrichment in the promoters of RA- and SLE- susceptibility genes, we observed marginal depletion of RNA polymerase II binding sites in the promoters of these genes.
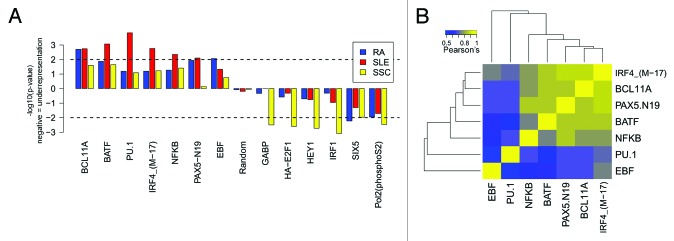
Figure 2. Enrichment of 7 transcription factor binding sites in the promoters of SLE- and RA-associated gene sets and depletion of 6 TFBSs in the promoters of SSc-associated gene set. Out of 148 TFBSs obtained with ChIP-seq by the ENCODE project, only TFBSs enriched/depleted in the promoters of autoimmune-related gene sets, and their co-localization tendency are shown. (A) Enrichment/depletion analysis in the promoters of autoimmune-associated gene sets. (B) Co-localization tendency among enriched TFBSs.
Second, we used another method able to perform similar type of TFBSs enrichment analysis,19 dubbed the ENCODE ChIP-seq significance tool. It also identified a similar set of transcription factors associated with the 2000 bp upstream—500 bp downstream regions around transcription start sites of those genes (Table S2), strengthening our findings. It did not, however, detect depleted associations for the RNA Polymerase II subunit.
Third, IPA identified NFκB (P = 1.42 × 10⁻⁸), BATF (P = 1.20 × 10⁻⁶), and IRF4 (P = 6.67 × 10⁻⁷) as the top transcription factors regulating the SLE gene set along with PAX5 (P = 1.07 × 10⁻³), further confirming the findings obtained with GenomeRunner. However, Ingenuity failed to detect BCL11A and PU.1, possibly due to lack of published experimental evidence. RA gene set showed enrichment of a similar set of transcription factors (Table S2). Overall, our results suggest similarity in regulation of RA- and SLE-associated gene sets, yet highlight PU.1, BATF, IRF4, and NFκB as transcription factors predominant binding in the promoters of SLE-associated genes.
SSc-associated genes are depleted in 6 TFBSs
In contrast to SLE and RA, GenomeRunner did not detect any TFBS to be enriched in the promoters of the SSc gene set. Instead, 5 TFBSs and RNA polymerase II large subunit were depleted in the promoters of SSc-associated genes (Fig. 2A; Table S3). Interestingly, IRF1, a well-known immune-related transcription factor, was depleted in the promoters of SSc associated genes. In addition, we observed depletion of non-specific development- and cell cycle-related TFs, such as GABP, E2F1, HEY1, SIX5.
Although the ENCODE ChIP-seq significance tool and IPA identified a set of transcription factors enriched in the promoters of SSc-associated genes (Table S2), they were largely non-overlapping with those enriched in SLE- and RA-susceptibility genes (Fig. S1). In summary, the common regulatory elements potentially relevant to SLE and RA were not shared by SSc.
SLE- and RA-associated TFBSs tend to co-localize
We tested a hypothesis that TFBS enriched in the promoters of SLE- and RA-susceptibility genes are co-localized within the same regions in the promoters. Pair-wise correlation analysis of the TFBSs within the promoters of our autoimmune-related genes (see Methods) identified that indeed binding sites for NFkB, BATF, PAX5, BCL11A, and IRF4 tend to overlap (Fig. 2B). The PU.1 and EBF TFBSs, on the other hand, tended not to overlap with other TFBSs. For example, the BLK promoter contains co-localized PAX5, NFkB, PU.1, BCL11A, BATF, and IRF4, and a separate group of PU.1-NFkB binding. This and other examples of TFBS localization within the promoters of autoimmune-related genes are shown in the Figure S2. Our results demonstrate that enriched TFBSs tend to cooperate (or compete) in regulation of autoimmune-related gene sets.
Under-represented TFBSs showed less coherent patterns of co-localization. Developmental HEY1 and cell cycle-related E2F1 tended to co-localize with RNAP II. We observed co-localization of GABP and IRF1 TFBSs, which are both associated with pro-inflammatory cytokine production,20,21 although no explicit relationship between the two has been reported. Similar to PU.1 and EBF, under-represented SIX5 did not co-localize with any other under-represented TFBSs (Fig. S3A). Expectedly, over- and under-represented TFBSs showed the antagonistic patterns of co-localization (Fig. S3B). Thus, co-localization analysis of under-represented TFBSs showed their differential binding patterns as compared with the enriched TFBSs.
Enhancer regions are associated with the promoters of SLE- and RA-associated genes
We then turned our analysis to cell type-specific epigenomic factors that control the accessibility of chromatin, such as chromatin states and histone marks. Among cell types used to collect these epigenomic data (Table S6), only the Gm12878 EBV transformed B-lymphoblastoid cell line was immune-related, also labeled as Tier 1, i.e., producing best quality data. An analysis of chromatin state segmentation in Gm12878 identified “strong enhancer” chromatin regions statistically enriched in the promoters of RA and SLE genes (Fig. 3A, P = 8.05 × 10⁻⁴ and 1.32 × 10⁻³, respectively), and, marginally with the promoters of SSc genes (P = 4.41 × 10⁻²). Since these enhancer elements are expected to be located in open chromatin regions, the promoters of RA-associated genes were expectedly depleted in the regions of compacted chromatin, or heterochromatin (P = 4.38 × 10⁻³, Fig. 3A). SLE-associated genes showed non-significant depletion in the heterochromatin regions (P = 2.43 × 10⁻¹). No statistically significant regions were detected in the promoters of SSc-associated genes. These findings suggest that altered expression of SLE- and RA-associated gene sets may occur through altered enhancer regions in the promoters of those genes.
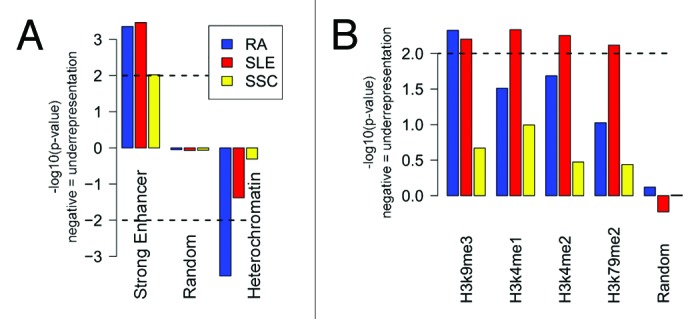
Figure 3. “Strong enhancer” chromatin state, H3K9me3, H3K4me1, H3K4me2, and H3K79me2 histone modification marks are enriched in the promoters of SLE- and RA-associated gene sets. In contrast, “heterochromatin” state was depleted. Chromatin segmentation states (A) and histone modification marks (B) from Gm12878 cell line enriched in the promoters of autoimmune-associated gene sets
Analysis of chromatin state segmentation in other cell lines (Fig. S4; Tables S3 and S6) identified repressed chromatin regions enriched in the promoters of SSc-associated genes in human Embryonic Stem Cells (hESC) and skeletal muscle myotubes (Hsmm) cell line. Furthermore, “active promoter” regions were depleted in SSc-associated genes in K562 chronic myelogenous leukemia cells and Hepg2 liver carcinoma cell lines, suggesting disruption of the transcriptionally inactive state of SSc-associated genes in these cell lines may be a factor in the disease.
SLE- and RA-associated promoters are enriched in activating histone marks, SSc – in repressing
Analysis of histone modification marks derived from the Gm12878 cell line identified activating H3K4me1, H3K4me2, and H3K79me2 marks22-24 specifically enriched in the promoters of SLE-associated genes. Surprisingly, the H3K9me3 repressive mark24 was also enriched in the promoters of both SLE- and RA-associated genes. No statistically significant enrichments were observed for the SSc gene set (Fig. 3B). Analysis of histone modification marks from Dnd41 (T cell leukemia with Notch mutation) and Jurkat (T lymphoblastoid derived from an acute T cell leukemia) cell lines did not identify any enrichment in any autoimmune disease-associated gene sets (data not shown). These findings highlight the role of B cell lineage in SLE and RA, and call for deeper investigation of histone methylation status in autoimmune diseases.
Analysis of histone marks from other cell types identified the repressive H3K27me3 mark24 to be enriched in the promoters of both RA- and SSc-associated gene sets (Fig. S4; Table S3). Surprisingly, this enrichment was mostly non-cell type-specific. H3K36me3, a mark found in actively transcribed gene regions, was depleted in RA-associated genes in Huvec and hESC cells. This mark was also depleted in SSc-associated genes in Hepg2 cell line, along with other activating marks, H3K27ac (K562, Hsmm, Hepg2) and H3K79me2 (K562, Hela). In summary, SSc-associated gene set tend to be associated with repressive epigenomic marks, which may be altered in the disease.
Reverse epigenomic analysis suggested novel autoimmune-related genes and miRNAs
Because our analysis indicated a set of epigenomic features tended to be enriched in SLE and RA promoters, we hypothesized that if these features did indeed reflect immune-relevant regulatory factors, then other genes with these features in their promoters would tend to be immune-relevant as well. We define the SLE- and RA-associated collection of enriched epigenomic elements (referred to as “the epigenomic set” hereafter) as a combination of 7 TFBSs (BATF, BCL11A, EBF, NFkB, PAX5, PU.1), 4 histone modification marks (H3K4me1, H3K4me2, H3K9me3, H3K79me2), enriched “strong enhancer” state and depleted “heterochromatin” states. We further hypothesized that prioritizing the promoters of all genes by the epigenomic set would detect known and suggest additional and/or novel transcripts yet to be associated with autoimmunity. We searched for this epigenomic set within the promoters of all genes, separately weighted each epigenomic element by the significance of their associations with SLE and RA (Reverse epigenomic analysis, see Methods, Table S4) and ranked the genes by the presence of SLE- and RA-weighted total numbers of epigenomic elements. Such a ranking scheme expectedly identified known SLE- and RA-associated genes, with IRF5 and PRDM1 being among the top 20 (Table 1). Interestingly, not all SLE- and RA-associated genes scored high, with many more other transcripts demonstrating stronger epigenomic set in their promoters (Table 1, Table S4). It remains to be determined whether these genes can be suggested by SNPs identified in GWASs.
Table 1. Top 20 genes/transcripts with the largest number of epigenomic elements enriched in the promoters of SLE- and RA-associated gene sets.
| Gene name | Description | SLE score | RA score |
|---|---|---|---|
| MIR663A | microRNA 663a | 68.90 | 39.25 |
| ITGAL | Integrin, α L (antigen CD11A (p180), lymphocyte function-associated antigen 1; α polypeptide) | 68.18 | 48.15 |
| FLJ40292 | Hypothetical LOC643210 | 53.93 | 39.87 |
| IRF5 | Interferon regulatory factor 5 | 52.65 | 35.30 |
| SCIMP | SLP adaptor and CSK interacting membrane protein | 51.73 | 36.99 |
| CIITA | Cass II, major histocompatibility complex, transactivator | 51.11 | 35.93 |
| CLEC17A | C-type lectin domain family 17, member A | 51.04 | 35.00 |
| SPN | Sialophorin | 50.56 | 36.81 |
| USP3 | Ubiquitin specific peptidase 3 | 49.78 | 33.07 |
| PPM1M | Protein phosphatase, Mg2+/Mn2+ dependent, 1M | 49.15 | 32.41 |
| BHLHE40 | Basic helix-loop-helix family, member e40 | 48.73 | 37.98 |
| WDR81 | WD repeat domain 81 | 46.82 | 34.22 |
| GPR55 | G protein-coupled receptor 55 | 46.57 | 32.10 |
| BIRC2 | Baculoviral IAP repeat containing 2 | 45.93 | 32.12 |
| MLL5 | Myeloid/lymphoid or mixed-lineage leukemia 5 (trithorax homolog, Drosophila) | 47.68 | |
| ZBTB32 | Zinc finger and BTB domain containing 32 | 47.27 | |
| PPM1M | Protein phosphatase, Mg2+/Mn2+ dependent, 1M | 46.95 | |
| LOC100506779 | NA | 46.68 | |
| PRDM1 | PR domain containing 1, with ZNF domain | 46.46 | |
| APOBR | Apolipoprotein B receptor | 46.21 | |
| SKIL | SKI-like oncogene | 36.26 | |
| SYTL3 | Synaptotagmin-like 3 | 34.83 | |
| NAPSB | Napsin B aspartic peptidase, pseudogene | 34.14 | |
| MIR4659B | microRNA 4659b | 32.72 | |
| SPN | Sialophorin | 32.28 | |
| CCL3 | Chemokine (C-C motif) ligand 3 | 31.79 |
The promoters of all genes were prioritized by the total number of epigenomic elements weighted by their significance in the promoters of SLE- and RA-associated genes (SLE and RA score, respectively). Larger scores indicate stronger presence of the epigenomic set, weighted by its disease-specific significance. Top 20 genes sorted by either SLE- or RA-weighted significance, are shown.
We then investigated whether genes identified by the epigenomic set would be relevant to autoimmunity and may provide novel targets relevant to SLE and RA. We performed gene set enrichment analysis (GSEA) on all genes prioritized by the average of SLE- and RA-weighted total numbers of epigenomic elements. Positional gene set enrichment analysis identified 111 genes highly enriched in the P22 region on chromosome 6 (P < 10−5, FDR = 0.166), better known as the HLA region, which is critically important in autoimmunity.25 Out of those, 47 histone cluster 1 genes were enriched in KEGG’s “systemic lupus erythematosus” pathway (P < 10−5, FDR < 0.000 01). The canonical pathway enrichment analysis added “primary immunodeficiency,” “intestinal immune network for IgA production,” and “B cell receptor signaling” to the list of the most significant canonical pathways. Overall, genes prioritized by the relative significance of the epigenomic set were enriched in several key immune-related gene ontology categories, and immunologic signatures (Table S5).
Transcription of target genes can be accurately predicted by transcription factor binding sites26 and epigenomic elements.27 We further investigated whether a set of autoimmune-associated transcription factors or histone modification marks alone can prioritize genes similarly or better that the epigenomic set. We prioritized genes by the presence of 7 TFBSs (Average TF score) or by the presence of 4 histone modification marks (Average histone score, Tables S4 and S5). GSEA revealed that genes prioritized by either the TF score or the histone score are less enriched in the immune-related functions and pathways, as compared with genes prioritized by the epigenomic set. For example, “Systemic lupus erythematosus” pathway was identified at nominal P value < 10−4, while genes prioritized using TFs or histone marks only predict this pathway at P values 0.01 and 0.001, respectively. Our results conform to current observations that a combination of transcription factors and epigenomic elements better predict gene expression changes,28,29 and strongly suggest the existence of a unifying regulatory scheme that can be used to define as yet unknown genes or transcripts potentially relevant to autoimmunity.
Discussion
Gene-centric bioinformatics methods allow an analysis of what functions and canonical pathways may be affected by a set of genes and can consider enrichments of known gene functions, protein-protein interactions, and canonical transcription factor binding sites (TFBSs) as well. However, there remains limited understanding of experimentally identified epigenomic regions involved in regulation of disease-specific gene sets. We provide statistical evidence for distinct epigenomic elements as a regulatory basis for pathways, functions, and cellular specificity of genes genetically associated with autoimmune diseases. Our findings provide a framework for understanding the role of epigenomics in complex diseases and phenotypes.
The transcription factors identified deserve further comment. PU.1, BCL11A, EBF, and PAX5 have been implicated in B cell lymphopoiesis30 and differentiation of specific cell types relevant to SLE pathogenesis.31 BCL11A functioning upstream of EBF and PAX5 in B cell development30 is essential in the differentiation to autoimmunity-related lineages such as B1 B-cells.31 The presence of these TFBSs in the promoters of SLE- and, to a lesser extent, RA-associated genes suggest these genes may be actively transcribed in B cells. Yet, they also may be activated in other cell lineages by the IRF4, an important modulator of autoimmunity that serves in the development of autoantibody-producing plasma cells32 and Th17 cells, known to be increased in SLE and are the producers of IL-17 and IL21 cytokines.33 Thus, enrichment, co-localization, and co-regulation of the TFs identified suggest common regulatory mechanisms that may drive autoimmune diseases.
We did not find TFBSs significantly enriched with the SSc gene set, instead, five TFs were significantly depleted in the promoters of SSc genes. This observation has several important implications. First, it suggests SSc may be regulated differently from SLE and RA, demonstrating that disease-specific gene sets can be driven by markedly different regulatory elements. Second, it emphasizes the need to consider under-represented associations, especially when it comes to studying regulatory elements. For example, Ingenuity Pathway analysis, and the ENCODE ChIP-seq Significance tool found enriched TFBSs in the promoters of SSc associated genes. These tools are not well suited to detect depletion, as their statistical models were developed predominantly for enrichment detection. Our method, on the other hand, was developed to detect unusual bias and directionality of enrichments, as compared with what could be observed by chance. It should be noted, however, that, in contrast with enrichments, depletions are harder to interpret. For example, depletion of the TFBSs in the promoters of SSc associated genes may indicate lack of active transcription in general. Alternatively, depleted TFBSs may be indicative of a very focused cell type-specific niche of activation, not yet captured by the existing ENCODE data.
Enriched histone modification marks showed expected combinations found in the “histone code”24. Mono- and di-methylation of histone H3K4, enriched in the promoters of SLE- and RA-associated genes, are linked to active transcription of highly expressed genes.22-24 Together with “strong enhancer” chromatin state, this suggests SLE- and RA-associated genes are actively transcribed in B lymphocytes, as suggested by the data obtained from the Gm12878 cell line (Fig. 3). Despite this, the SLE- and RA- gene sets showed enrichment of H3K9me3, a mark of transcriptional repression,24 in the Gm12878 cell line. However, this histone modification mark has been reported to be present at the transcribed regions of the genome,34 and in transcriptional elongation of HLA-DRA genes,35 which are pertinent to both SLE and RA.
Although we did not restrict our analysis to any given cell types, SLE- and RA-associated genes showed preferential enrichment with data obtained from the Gm12878 cell line, suggesting an important role of B cells in these diseases. While it may be argued that EBV transformation may hamper our ability to draw conclusions about normal immune cell behavior,36 and that we also observe an EBV-specific marks instead,37 the genes identified by GWA studies are disease-specific, not EBV-specific, and we have focused on the analysis of disease-, not EBV-, specific genes. However, the similarity between our epigenomic elements and the EBV-driven epigenomic program supports prior work suggesting the significance of EBV in SLE.38
Despite majority of statistically significant enrichments were found in Gm12878 cell line, enrichments in other cell lines should be noted. The H3K27me3 histone mark is generally associated with heterochromatin regions,24 but also contribute to the establishment of “bivalent domains” in embryonic stem cells that maintain the developmentally essential genes in a poised state for activation or repression.39 This mark was enriched in the promoters of SSc genes in Hsmm and Hmec cell lines, and in the promoters of RA genes in Nhdfad, Huvec, Hepg2, and Nhek cell lines. Conversely, the H3K36me3 mark that restricts the PRC2 mediated spread of H3K27 methylation40 was depleted in SSc genes (Hepg2 cell line) and in RA genes (H1hesc and Huvec cell lines). This underscores the importance of cell type-specific epigenomic data,41 as it can reveal a combination of cell type-specific epigenomic marks relevant to a phenotype. Because there are so many cellular subpopulations in blood, at this point it would be very difficult to propose a validation which would require a larger experimental set-up before making further conclusions; however the present work is exploratory and might help to guide future experiments and focus these toward just a few epigenomic elements or transcription factors.
The genes prioritized by the relative significance of the epigenomic elements confirmed our hypothesis about immune-related epigenomic scheme. For example, the top ranked ITGAL is a classic methylation-sensitive autoimmunity-related gene, with its promoter specifically hypomethylated in SLE.42 Some other examples of genes known to be associated with immune system processes included SPN (sialophorin, aka CD43), which promotes differentiation of Th2 cells,43 CLEC17A (C-type lectin domain family 17), a receptor for communication in dividing B-cells in germinal centers,44 SCIMP (SLP adaptor and CSK interacting membrane protein), is expressed in B1 cells and other antigen-presenting cells and is localized in the immunologic synapse. It is involved in signal transduction after major histocompatibility complex (MHC) II,45 and CIITA (class II, major histocompatibility complex, transactivator), controls MHC class II expression46 (see Table S3 for the complete list). Besides well-known immune-related genes prioritized by the epigenomic elements we identified new transcripts potentially important in autoimmunity. Examples include the microRNA 663a, which was one of five miRNAs found differentially expressed in SLE patients, across racial groups and specimen types analyzed47 and has been implicated in the inflammatory response of endothelial cells,48 an uncharacterized gene, FLJ40292 (hypothetical LOC643210), and others (Table 1). These results suggest candidate autoimmune-related genes that may be detected in future genome-wide association studies.
GSE analysis of the genes prioritized by the epigenomic elements suggested B cell specific processes altered in SLE and RA (Table S5, immunologic signatures analysis). In addition to “B cell receptor signaling” pathway, B cell involvement was further highlighted by the gene signatures upregulated in systemic lupus erythematosus B cells vs. normal B cells, and in B cells vs. plasmacytoid dendritic cells. Furthermore, gene signatures upregulated in LPS stimulated dendritic cells suggested activation of dendritic cells (Table S5). That is, the epigenomic signature points toward abnormal activation of dendritic cells and their interaction with B cells in SLE and RA.
This study leverages the growing amount of genome annotation data (epigenomic data) to reveal statistically significant regulatory elements in the promoters of autoimmune disease-associated gene sets. Our study identified a set of epigenomic elements enriched within SLE- and RA-susceptibility gene sets, to be contrasted with the absence of such enrichments in the promoters of SSc-susceptibility gene sets. We prioritized potential autoimmune-related genes based on the epigenomic elements and found cohesive functional enrichment of these genes in immune-related functions, pointing toward abnormal interaction of activated dendritic cells and B cells in SLE and RA. Our study suggests the existence of a set of epigenomic elements as a regulatory basis for common pathways, functions, and cellular specificity of genes genetically associated with autoimmune diseases.
Methods
Data acquisition
Autoimmune-associated gene sets
Genes associated with SLE, RA, and SSc were obtained from recently reviewed findings on genetics of systemic autoimmune diseases.14,18 Tables 1 and 2 from reference 18 provided SLE- and RA-associated gene lists, respectively; a paragraph 2.2 and a Table 2 from reference 14 were used to compile SSc gene list. Gene lists were further manually curated to reflect the latest confirmed associations of the genes with corresponding autoimmune diseases, and analyzed for functional enrichment using Ingenuity Pathway Analysis (Ingenuity Systems, Redwood City, CA). Overlaps among gene lists were visualized using Venny online tool.49 Gene lists, and a script for promoter region extraction are available at https://github.com/mdozmorov/promoter_extract.git. The complete outline of the analysis is shown on Figure 1.
Functional/Regulatory genome annotation data
As part of our interest in automating the search for biologically meaningful correlations among high-throughput and high-information data,50-52 we developed GenomeRunner (http://sourceforge.net/projects/genomerunner), a software program that searches for statistically significant co-localization between a set of genomic regions of interest (promoters of disease associated genes in this paper) and sets of annotated genomic features (epigenomic elements).53 We tested the promoters of each different set of disease associated genes to see if they were statistically significantly associated with or depleted in three groups of epigenomic elements: Chromatin State Segmentation by HMM from ENCODE/Broad, Histone Modifications by ChIP-seq from ENCODE/Broad Institute, and Transcription Factor obtained experimentally by ChIP-seq by the ENCODE project (Table S3). The data from multiple cell lines were used; the cell lines are described in Table S6. A total of 405 epigenomic elements were obtained from the UCSC genome database,8 stored in a local MySQL database accessible for the GenomeRunner community.
Epigenomic enrichment analysis
Briefly, the promoters of disease associated gene sets were tested for overlap of at least 1 nucleotide with each of the 405 epigenomic elements. We first calculated the total number of promoters of disease-associated genes that overlapped with an epigenomic element. If a given promoter overlaps with >1 epigenomic element of the same type, it is only counted once, to reflect the fact of overlap. In other words, overlap counting is promoter-centric, e.g., if a promoter of the BLK gene overlaps with 3 NFKB binding sites, only one is counted.
We then performed random sampling from the total pool of the promoters of all genes, selecting the same number of random promoters as in the disease associated gene set being analyzed. The use of the promoters of all genes as a background enables us to search, specifically, for associations that might distinguish regulation of one set of genes from another. This background selection also restricts random sampling to avoid low complexity genomic regions, such as transposable elements, duplications, and inversions, repeats, comprising up to 47% of the human genome.54 We selected a random number of the promoters according to the size of each disease-associated gene set and performed 1000 such random samplings, estimating the average number and variance of random overlapping. A Chi-square test was used to determine whether there was a significant difference between the total number of co-localization for the ncRNA class as compared with what could be expected by random chance. As a positive control, we included testing the promoters of randomly selected genes sets of the same size as the disease associated genes.
Transformation of P values
For easier visualization and comparison, we converted P values into decimal scale by –log10-transformation. A “-” sign was added if a P value signifies an under-represented association. This allows representation of significant associations in an intuitive format—larger numbers equal more statistically significant over-represented associations, while smaller negative numbers denote more statistically significant under-represented associations.
Bar diagram visualization
The transformed P values can be directly visualized using a bar diagram, where the height of bars reflects the significance of associations. For each of the three groups of epigenomic elements, an n × m matrix of transformed P values, where n is the number of epigenomic elements and m is the number of the disease associated gene sets, was assembled (Table S3). Note that in addition to 3 autoimmune disease-associated gene sets we analyzed 3 random gene sets of the same size, making m = 6. Epigenomic elements showing no statistically significant associations (P value cutoff 0.01, unless otherwise specified) with at least one set of the promoters of disease-associated genes were removed. This filtering step simplifies visualization and allows a reader to focus on the most significant epigenomic associations differentially enriched among the disease associated gene sets.
Pair-wise correlation analysis
We compared co-localization patterns of the transcription factor binding sites in the promoters of the disease-associated genes. First, for each TFBS we calculated its enrichment P values with self and other TFBSs, as compared with random regions of the same length sampled from the promoters of the disease associated genes. Second, we evaluated pair-wise correlations between TFBS-specific transformed P values using Pearson’s correlation coefficient. We expect TFBSs showing similar co-localization patterns with other TFBSs to correlate with positive Pearson’s correlation coefficient close to 1, while TFBSs located in different places within the promoters would show negative Pearson’s correlation coefficient. We clustered the resulting n × n matrix of correlation coefficients, where n is the number of TFBSs analyzed, using “maximum” distance to measure dissimilarity between rows and columns, and the “ward” agglomeration method.55 Clustering and visualization were performed within R computing environment,56 using blue/yellow gradient to highlight negative/positive correlations, respectively.
Reverse epigenomic analysis
To identify the promoters of other genes sharing similar sets of epigenomic elements as the promoters of RA- and SLE- associated gene sets, we analyzed the promoters of all genes and the transformed P values of SLE- and RA- epigenomic signature. The promoters of all genes were annotated for the presence of 7 TFBSs (BATF, BCL11A, EBF, IRF4, NFkB, PAX5, and PU.1), 4 histone modification marks (H3K4me1, H3K4me2, H3K9me3, H3K79me2), and “strong enhancer” and “heterochromatin” chromatin state regions. For each promoter, we counted the number of times it overlaps with each of the aforementioned epigenomic elements. To prioritize each element by the significance of its association in SLE, we multiplied (weighted) the counts by the transformed P values and summed up all the counts. We repeated these steps using RA-specific P values. Thus, for each promoter we calculated the total score of SLE- and RA-associated epigenomic signature.
Intuitively, these steps reflect our reasoning that the presence of stronger SLE- or RA-associated epigenomic signature in a promoter may highlight candidate autoimmune-related genes. By counting the number of epigenomic elements in a promoter we get a rough estimate of the presence of SLE- and RA-associated epigenomic signature. By weighting each count by the transformed P values of SLE- and RA-epigenomic associations we prioritize SLE- and RA-enriched epigenomic enrichments, and downgrade the contribution of the depleted epigenomic elements, since the transformed P values for depleted associations are negative. By summing up the weighted counts, we obtain disease-specific total scores of the epigenomic set. By averaging SLE- and RA-specific total scores, we obtain the average score of the epigenomic set present in the promoters of all genes.
Gene set enrichment analysis
Genes were ranked by largest to smallest average scores of the epigenomic signature. The ranked gene list was supplied to GSEA57 pre-ranked analysis with default settings. c1 (positional gene sets), c2 KEGG (curated gene sets from online pathway databases), c5 (GO gene sets), and c7 (immunologic signatures defined directly from microarray gene expression data from immunologic studies) databases from the Molecular Signatures Database (MSigDB) were used for the analysis.
Supplementary Material
Disclosure of Potential Conflicts of Interest
No potential conflicts of interest were disclosed.
Acknowledgments
The authors would like to acknowledge the National Institutes of Health (NIH) for its funding of this work (Grants # 1P20GM103636 and 8P20GM103456 to JDW), the National Institute of Arthritis and Musculoskeletal and Skin Diseases (a subaward from grant # P30 AR053483 to Dozmorov MG), and an Institutional Development Award (IDeA) from the National Institute of General Medical Sciences (a subaward from grant # P30GM103510 to Dozmorov MG), and sub-awards from grants P20 GM103456 and P01 AI083194 to Alarcón-Riquelme ME. The content of this article is solely the responsibility of the authors and does not necessarily represent the official views of the National Institutes of Health.
Authors' Contributions
Dozmorov MG conceived the idea of using epigenomic elements as predictors of phenotype-associated genes, designed and conducted the experiments, interpreted the results, drafted the manuscript and prepared the figures/supplemental material for submission. Wren JD helped with data analysis, interpretation of results, and writing the manuscript. Alarcón-Riquelme ME conceived the idea of the promoter analysis for the enrichment of epigenomic elements and helped to draft the manuscript. All authors read and approved the final manuscript.
Glossary
Abbreviations:
- ENCODE
Encyclopedia of DNA elements
- GSEA
gene set enrichment analysis
- GWAS
genome-wide association studies
- RA
rheumatoid arthritis
- SLE
systemic lupus erythematosus
- SSc
systemic sclerosis or scleroderma
- TFBS
transcription factor binding site
Supplemental Materials
Supplemental materials may be found here: http://www.landesbioscience.com/journals/epigenetics/article/27021/
Footnotes
Previously published online: www.landesbioscience.com/journals/epigenetics/article/27021
References
- 1.Hindorff LA, Sethupathy P, Junkins HA, Ramos EM, Mehta JP, Collins FS, Manolio TA. Potential etiologic and functional implications of genome-wide association loci for human diseases and traits. Proc Natl Acad Sci U S A. 2009;106:9362–7. doi: 10.1073/pnas.0903103106. [DOI] [PMC free article] [PubMed] [Google Scholar]
- 2.Nicolae DL, Gamazon E, Zhang W, Duan S, Dolan ME, Cox NJ. Trait-associated SNPs are more likely to be eQTLs: annotation to enhance discovery from GWAS. PLoS Genet. 2010;6:e1000888. doi: 10.1371/journal.pgen.1000888. [DOI] [PMC free article] [PubMed] [Google Scholar]
- 3.Maurano MT, Humbert R, Rynes E, Thurman RE, Haugen E, Wang H, Reynolds AP, Sandstrom R, Qu H, Brody J, et al. Systematic localization of common disease-associated variation in regulatory DNA. Science. 2012;337:1190–5. doi: 10.1126/science.1222794. [DOI] [PMC free article] [PubMed] [Google Scholar]
- 4.Rossin EJ, Lage K, Raychaudhuri S, Xavier RJ, Tatar D, Benita Y, Cotsapas C, Daly MJ, International Inflammatory Bowel Disease Genetics Constortium Proteins encoded in genomic regions associated with immune-mediated disease physically interact and suggest underlying biology. PLoS Genet. 2011;7:e1001273. doi: 10.1371/journal.pgen.1001273. [DOI] [PMC free article] [PubMed] [Google Scholar]
- 5.Mack GS. To selectivity and beyond. Nat Biotechnol. 2010;28:1259–66. doi: 10.1038/nbt.1724. [DOI] [PubMed] [Google Scholar]
- 6.Teperino R, Lempradl A, Pospisilik JA. Bridging epigenomics and complex disease: the basics. Cell Mol Life Sci. 2013;70:1609–21. doi: 10.1007/s00018-013-1299-z. [DOI] [PMC free article] [PubMed] [Google Scholar]
- 7.Bernstein BE, Stamatoyannopoulos JA, Costello JF, Ren B, Milosavljevic A, Meissner A, Kellis M, Marra MA, Beaudet AL, Ecker JR, et al. The NIH Roadmap Epigenomics Mapping Consortium The NIH Roadmap Epigenomics Mapping Consortium. Nat Biotechnol. 2010;28:1045–8. doi: 10.1038/nbt1010-1045. [DOI] [PMC free article] [PubMed] [Google Scholar]
- 8.Rosenbloom KR, Sloan CA, Malladi VS, Dreszer TR, Learned K, Kirkup VM, Wong MC, Maddren M, Fang R, Heitner SG, et al. ENCODE data in the UCSC Genome Browser: year 5 update. Nucleic Acids Res. 2013;41:D56–63. doi: 10.1093/nar/gks1172. [DOI] [PMC free article] [PubMed] [Google Scholar]
- 9.American Association for Cancer Research Human Epigenome Task Force. European Union, Network of Excellence, Scientific Advisory Board Moving AHEAD with an international human epigenome project. Nature. 2008;454:711–5. doi: 10.1038/454711a. [DOI] [PMC free article] [PubMed] [Google Scholar]
- 10.Consortium EP, ENCODE Project Consortium The ENCODE (ENCyclopedia Of DNA Elements) Project. Science. 2004;306:636–40. doi: 10.1126/science.1105136. [DOI] [PubMed] [Google Scholar]
- 11.Balada E, Ordi-Ros J, Vilardell-Tarrés M. DNA methylation and systemic lupus erythematosus. Ann N Y Acad Sci. 2007;1108:127–36. doi: 10.1196/annals.1422.015. [DOI] [PubMed] [Google Scholar]
- 12.Kondilis-Mangum HD, Wade PA. Epigenetics and the adaptive immune response. Mol Aspects Med. 2013;34:813–25. doi: 10.1016/j.mam.2012.06.008. [DOI] [PMC free article] [PubMed] [Google Scholar]
- 13.Lu Q. The critical importance of epigenetics in autoimmunity. J Autoimmun. 2013;41:1–5. doi: 10.1016/j.jaut.2013.01.010. [DOI] [PubMed] [Google Scholar]
- 14.Luo Y, Wang Y, Wang Q, Xiao R, Lu Q. Systemic sclerosis: genetics and epigenetics. J Autoimmun. 2013;41:161–7. doi: 10.1016/j.jaut.2013.01.012. [DOI] [PubMed] [Google Scholar]
- 15.Jeffries MA, Dozmorov M, Tang Y, Merrill JT, Wren JD, Sawalha AH. Genome-wide DNA methylation patterns in CD4+ T cells from patients with systemic lupus erythematosus. Epigenetics. 2011;6:593–601. doi: 10.4161/epi.6.5.15374. [DOI] [PMC free article] [PubMed] [Google Scholar]
- 16.Coit P, Jeffries M, Altorok N, Dozmorov MG, Koelsch KA, Wren JD, Merrill JT, McCune WJ, Sawalha AH. Genome-wide DNA methylation study suggests epigenetic accessibility and transcriptional poising of interferon-regulated genes in naïve CD4+ T cells from lupus patients. J Autoimm. 2013;43:78-84. doi: 10.1371/journal.pgen.1003678. [DOI] [PMC free article] [PubMed] [Google Scholar]
- 17.Garaud S, Le Dantec C, Jousse-Joulin S, Hanrotel-Saliou C, Saraux A, Mageed RA, Youinou P, Renaudineau Y. IL-6 modulates CD5 expression in B cells from patients with lupus by regulating DNA methylation. J Immunol. 2009;182:5623–32. doi: 10.4049/jimmunol.0802412. [DOI] [PubMed] [Google Scholar]
- 18.Delgado-Vega A, Sánchez E, Löfgren S, Castillejo-López C, Alarcón-Riquelme ME. Recent findings on genetics of systemic autoimmune diseases. Curr Opin Immunol. 2010;22:698–705. doi: 10.1016/j.coi.2010.09.002. [DOI] [PMC free article] [PubMed] [Google Scholar]
- 19.Auerbach RK, Chen B, Butte AJ. Relating genes to function: identifying enriched transcription factors using the ENCODE ChIP-Seq significance tool. Bioinformatics. 2013;29:1922–4. doi: 10.1093/bioinformatics/btt316. [DOI] [PMC free article] [PubMed] [Google Scholar]
- 20.Chakrabarti A, Sadler AJ, Kar N, Young HA, Silverman RH, Williams BR. Protein kinase R-dependent regulation of interleukin-10 in response to double-stranded RNA. J Biol Chem. 2008;283:25132–9. doi: 10.1074/jbc.M804770200. [DOI] [PMC free article] [PubMed] [Google Scholar]
- 21.Avots A, Hoffmeyer A, Flory E, Cimanis A, Rapp UR, Serfling E. GABP factors bind to a distal interleukin 2 (IL-2) enhancer and contribute to c-Raf-mediated increase in IL-2 induction. Mol Cell Biol. 1997;17:4381–9. doi: 10.1128/mcb.17.8.4381. [DOI] [PMC free article] [PubMed] [Google Scholar]
- 22.Liang G, Lin JC, Wei V, Yoo C, Cheng JC, Nguyen CT, Weisenberger DJ, Egger G, Takai D, Gonzales FA, et al. Distinct localization of histone H3 acetylation and H3-K4 methylation to the transcription start sites in the human genome. Proc Natl Acad Sci U S A. 2004;101:7357–62. doi: 10.1073/pnas.0401866101. [DOI] [PMC free article] [PubMed] [Google Scholar]
- 23.Noma K, Allis CD, Grewal SI. Transitions in distinct histone H3 methylation patterns at the heterochromatin domain boundaries. Science. 2001;293:1150–5. doi: 10.1126/science.1064150. [DOI] [PubMed] [Google Scholar]
- 24.Ernst J, Kellis M. Discovery and characterization of chromatin states for systematic annotation of the human genome. Nat Biotechnol. 2010;28:817–25. doi: 10.1038/nbt.1662. [DOI] [PMC free article] [PubMed] [Google Scholar]
- 25.Gough SC, Simmonds MJ. The HLA Region and Autoimmune Disease: Associations and Mechanisms of Action. Curr Genomics. 2007;8:453–65. doi: 10.2174/138920207783591690. [DOI] [PMC free article] [PubMed] [Google Scholar]
- 26.Beyer A, Workman C, Hollunder J, Radke D, Möller U, Wilhelm T, Ideker T. Integrated assessment and prediction of transcription factor binding. PLoS Comput Biol. 2006;2:e70. doi: 10.1371/journal.pcbi.0020070. [DOI] [PMC free article] [PubMed] [Google Scholar]
- 27.Teschendorff AE, Menon U, Gentry-Maharaj A, Ramus SJ, Gayther SA, Apostolidou S, Jones A, Lechner M, Beck S, Jacobs IJ, et al. An epigenetic signature in peripheral blood predicts active ovarian cancer. PLoS One. 2009;4:e8274. doi: 10.1371/journal.pone.0008274. [DOI] [PMC free article] [PubMed] [Google Scholar]
- 28.Wang D, Rendon A, Wernisch L. Transcription factor and chromatin features predict genes associated with eQTLs. Nucleic Acids Res. 2013;41:1450–63. doi: 10.1093/nar/gks1339. [DOI] [PMC free article] [PubMed] [Google Scholar]
- 29.Wilczynski B, Liu YH, Yeo ZX, Furlong EE. Predicting spatial and temporal gene expression using an integrative model of transcription factor occupancy and chromatin state. PLoS Comput Biol. 2012;8:e1002798. doi: 10.1371/journal.pcbi.1002798. [DOI] [PMC free article] [PubMed] [Google Scholar]
- 30.Medina KL, Singh H. Genetic networks that regulate B lymphopoiesis. Curr Opin Hematol. 2005;12:203–9. doi: 10.1097/01.moh.0000160735.67596.a0. [DOI] [PubMed] [Google Scholar]
- 31.Györy I, Boller S, Nechanitzky R, Mandel E, Pott S, Liu E, Grosschedl R. Transcription factor Ebf1 regulates differentiation stage-specific signaling, proliferation, and survival of B cells. Genes Dev. 2012;26:668–82. doi: 10.1101/gad.187328.112. [DOI] [PMC free article] [PubMed] [Google Scholar]
- 32.Teng Y, Takahashi Y, Yamada M, Kurosu T, Koyama T, Miura O, Miki T. IRF4 negatively regulates proliferation of germinal center B cell-derived Burkitt’s lymphoma cell lines and induces differentiation toward plasma cells. Eur J Cell Biol. 2007;86:581–9. doi: 10.1016/j.ejcb.2007.05.006. [DOI] [PubMed] [Google Scholar]
- 33.Huber M, Brüstle A, Reinhard K, Guralnik A, Walter G, Mahiny A, von Löw E, Lohoff M. IRF4 is essential for IL-21-mediated induction, amplification, and stabilization of the Th17 phenotype. Proc Natl Acad Sci U S A. 2008;105:20846–51. doi: 10.1073/pnas.0809077106. [DOI] [PMC free article] [PubMed] [Google Scholar]
- 34.Vakoc CR, Mandat SA, Olenchock BA, Blobel GA. Histone H3 lysine 9 methylation and HP1gamma are associated with transcription elongation through mammalian chromatin. Mol Cell. 2005;19:381–91. doi: 10.1016/j.molcel.2005.06.011. [DOI] [PubMed] [Google Scholar]
- 35.Rybtsova N, Leimgruber E, Seguin-Estévez Q, Dunand-Sauthier I, Krawczyk M, Reith W. Transcription-coupled deposition of histone modifications during MHC class II gene activation. Nucleic Acids Res. 2007;35:3431–41. doi: 10.1093/nar/gkm214. [DOI] [PMC free article] [PubMed] [Google Scholar]
- 36.Åberg K, Khachane AN, Rudolf G, Nerella S, Fugman DA, Tischfield JA, van den Oord EJ. Methylome-wide comparison of human genomic DNA extracted from whole blood and from EBV-transformed lymphocyte cell lines. Eur J Hum Genet. 2012;20:953–5. doi: 10.1038/ejhg.2012.33. [DOI] [PMC free article] [PubMed] [Google Scholar]
- 37.Zhao B, Zou J, Wang H, Johannsen E, Peng CW, Quackenbush J, Mar JC, Morton CC, Freedman ML, Blacklow SC, et al. Epstein-Barr virus exploits intrinsic B-lymphocyte transcription programs to achieve immortal cell growth. Proc Natl Acad Sci U S A. 2011;108:14902–7. doi: 10.1073/pnas.1108892108. [DOI] [PMC free article] [PubMed] [Google Scholar]
- 38.Poole BD, Templeton AK, Guthridge JM, Brown EJ, Harley JB, James JA. Aberrant Epstein-Barr viral infection in systemic lupus erythematosus. Autoimmun Rev. 2009;8:337–42. doi: 10.1016/j.autrev.2008.12.008. [DOI] [PMC free article] [PubMed] [Google Scholar]
- 39.Bernstein BE, Mikkelsen TS, Xie X, Kamal M, Huebert DJ, Cuff J, Fry B, Meissner A, Wernig M, Plath K, et al. A bivalent chromatin structure marks key developmental genes in embryonic stem cells. Cell. 2006;125:315–26. doi: 10.1016/j.cell.2006.02.041. [DOI] [PubMed] [Google Scholar]
- 40.Yuan W, Xu M, Huang C, Liu N, Chen S, Zhu B. H3K36 methylation antagonizes PRC2-mediated H3K27 methylation. J Biol Chem. 2011;286:7983–9. doi: 10.1074/jbc.M110.194027. [DOI] [PMC free article] [PubMed] [Google Scholar]
- 41.Ernst J, Kellis M. Interplay between chromatin state, regulator binding, and regulatory motifs in six human cell types. Genome Res. 2013;23:1142–54. doi: 10.1101/gr.144840.112. [DOI] [PMC free article] [PubMed] [Google Scholar]
- 42.Lu Q, Kaplan M, Ray D, Ray D, Zacharek S, Gutsch D, Richardson B. Demethylation of ITGAL (CD11a) regulatory sequences in systemic lupus erythematosus. Arthritis Rheum. 2002;46:1282–91. doi: 10.1002/art.10234. [DOI] [PubMed] [Google Scholar]
- 43.Cannon JL, Collins A, Mody PD, Balachandran D, Henriksen KJ, Smith CE, Tong J, Clay BS, Miller SD, Sperling AI. CD43 regulates Th2 differentiation and inflammation. J Immunol. 2008;180:7385–93. doi: 10.4049/jimmunol.180.11.7385. [DOI] [PMC free article] [PubMed] [Google Scholar]
- 44.Graham SA, Jégouzo SA, Yan S, Powlesland AS, Brady JP, Taylor ME, Drickamer K. Prolectin, a glycan-binding receptor on dividing B cells in germinal centers. J Biol Chem. 2009;284:18537–44. doi: 10.1074/jbc.M109.012807. [DOI] [PMC free article] [PubMed] [Google Scholar]
- 45.Draber P, Vonkova I, Stepanek O, Hrdinka M, Kucova M, Skopcova T, Otahal P, Angelisova P, Horejsi V, Yeung M, et al. SCIMP, a transmembrane adaptor protein involved in major histocompatibility complex class II signaling. Mol Cell Biol. 2011;31:4550–62. doi: 10.1128/MCB.05817-11. [DOI] [PMC free article] [PubMed] [Google Scholar]
- 46.Zika E, Ting JP. Epigenetic control of MHC-II: interplay between CIITA and histone-modifying enzymes. Curr Opin Immunol. 2005;17:58–64. doi: 10.1016/j.coi.2004.11.008. [DOI] [PubMed] [Google Scholar]
- 47.Te JL, Dozmorov IM, Guthridge JM, Nguyen KL, Cavett JW, Kelly JA, Bruner GR, Harley JB, Ojwang JO. Identification of unique microRNA signature associated with lupus nephritis. PLoS One. 2010;5:e10344. doi: 10.1371/journal.pone.0010344. [DOI] [PMC free article] [PubMed] [Google Scholar]
- 48.Ni CW, Qiu H, Jo H. MicroRNA-663 upregulated by oscillatory shear stress plays a role in inflammatory response of endothelial cells. Am J Physiol Heart Circ Physiol. 2011;300:H1762–9. doi: 10.1152/ajpheart.00829.2010. [DOI] [PMC free article] [PubMed] [Google Scholar]
- 49.Oliveros JC. VENNY. An interactive tool for comparing lists with Venn Diagrams. 2007. Available from: http://bioinfogp.cnb.csic.es/tools/venny/index.html
- 50.Wren JD, Johnson D, Gruenwald L. Automating genomic data mining via a sequence-based matrix format and associative rule set. BMC Bioinformatics. 2005;6(Suppl 2):S2. doi: 10.1186/1471-2105-6-S2-S2. [DOI] [PMC free article] [PubMed] [Google Scholar]
- 51.Dozmorov MG, Wren JD. High-throughput processing and normalization of one-color microarrays for transcriptional meta-analyses. BMC Bioinformatics. 2011;12(Suppl 10):S2. doi: 10.1186/1471-2105-12-S10-S2. [DOI] [PMC free article] [PubMed] [Google Scholar]
- 52.Dozmorov MG, Giles CB, Wren JD. Predicting gene ontology from a global meta-analysis of 1-color microarray experiments. BMC Bioinformatics. 2011;12(Suppl 10):S14. doi: 10.1186/1471-2105-12-S10-S14. [DOI] [PMC free article] [PubMed] [Google Scholar]
- 53.Dozmorov MG, Cara LR, Giles CB, Wren JD. GenomeRunner: automating genome exploration. Bioinformatics. 2012;28:419–20. doi: 10.1093/bioinformatics/btr666. [DOI] [PMC free article] [PubMed] [Google Scholar]
- 54.Lander ES, Linton LM, Birren B, Nusbaum C, Zody MC, Baldwin J, Devon K, Dewar K, Doyle M, FitzHugh W, et al. International Human Genome Sequencing Consortium Initial sequencing and analysis of the human genome. Nature. 2001;409:860–921. doi: 10.1038/35057062. [DOI] [PubMed] [Google Scholar]
- 55.Ward JH. Hierarchical Grouping to Optimize an Objective Function. J Am Stat Assoc. 1963;58:236–44. doi: 10.1080/01621459.1963.10500845. [DOI] [Google Scholar]
- 56.R Core Team. R: A language and environment for statistical computing. R Foundation for Statistical Computing, Vienna, Austria. 2013. Available from: http://www.R-project.org
- 57.Subramanian A, Tamayo P, Mootha VK, Mukherjee S, Ebert BL, Gillette MA, Paulovich A, Pomeroy SL, Golub TR, Lander ES, et al. Gene set enrichment analysis: a knowledge-based approach for interpreting genome-wide expression profiles. Proc Natl Acad Sci U S A. 2005;102:15545–50. doi: 10.1073/pnas.0506580102. [DOI] [PMC free article] [PubMed] [Google Scholar]
Associated Data
This section collects any data citations, data availability statements, or supplementary materials included in this article.