

Abstract
Roughly two-thirds of all breast cancers are ERα-positive and can be treated with the antiestrogen, Tamoxifen, however resistance occurs in 33% of women who take the drug for more than 5 y. Aberrant DNA methylation, an epigenetic mechanism that alters gene expression in cancer, is thought to play a role in this resistance. To develop an understanding of Tamoxifen-resistance and identify novel pathways and targets of aberrant methylation, DNA from MCF-7 breast cancer cells and Tamoxifen-resistant derivatives, TMX2–11 and TMX2–28, were analyzed using the Illumina HumanMethylation450 BeadChip. Normalizing against MCF-7 values, ERα-positive TMX2–11 had 4000 hypermethylated sites and ERα-negative TMX2–28 had over 33 000. Analysis of CpG sites altered in both TMX2–11 and TMX2–28 revealed that the Tamoxifen-resistant cell lines share 3000 hypermethylated and 200 hypomethylated CpGs. ZNF350 and MAGED1, two genes hypermethylated in both cell lines, were examined in greater detail. Treatment with 5-aza-2′deoxycitidine caused a significant reduction in promoter methylation of both ZNF350 and MAGED1 and a corresponding increase in expression in TMX2–28. A similar relationship between methylation and expression was not detected in TMX2–11. Our findings are indicative of the variable responses to methylation-targeted breast cancer therapy and highlight the need for biomarkers that accurately predict treatment outcome.
Keywords: Tamoxifen Resistance, Breast Cancer, Estrogen Receptor, HumanMethylation450 BeadChip, methylation, ZNF350, MAGED1
Introduction
Estrogen receptor-α (ERα) status remains one of the most important breast cancer diagnostic and prognostic biomarkers. Roughly 70% of all breast cancers are ERα-positive and can be treated with an antihormone such as Tamoxifen. However, a meta-analysis of 150 000 women from 200 randomized trials found that 33% of women receiving Tamoxifen for five years had recurrence (acquired resistance) within 15 y and 26% died.1 In addition to this acquired antiestrogen resistance, de novo- or intrinsic-resistance occurs primarily in ERα-negative tumors but also occasionally in ERα-positive tumors.2 Studies of endocrine resistance and global gene expression in Tamoxifen-resistant cell cultures and human tumors have detected alterations in numerous pathways including ER-signaling, growth factor receptor, and cytoplasmic signaling, cell cycle, apoptosis and cell survival signaling.3 A recent proteomics analysis of an ERα-negative, Tamoxifen-resistant MCF-7 derivative showed changes in expression of genes involved in metastasis, tumorigenesis, and ER-signaling pathways.4 However, knowledge of the specific molecular mechanisms that cause these changes and determine the endocrine-resistance is far from complete.
DNA promoter methylation is a major epigenetic mechanism by which gene expression is altered in cancer. DNA methyltransferases (DMNTs) are responsible for the addition of methyl groups to the cytosine of a CpG site.5 In normal adult tissue, CpG islands remain largely unmethylated; however, in the case of cancer, hypermethylation of normally unmethylated cytosines in promoter CpG islands frequently results in gene silencing, while hypomethylation of normally methylated cytosines in CpGs outside promoter regions leads to genetic instability.6 Suppression of genes involved in cell cycle control, DNA repair, apoptosis and cell survival, and toxicant metabolism is thought to play a major role in the etiology and progression of cancer.
To date, few studies have examined promoter methylation and Tamoxifen resistance in breast cancer. Of the studies conducted, one detected drug-specific promoter methylation and gene expression profiles in an ERα-positive, Tamoxifen-resistant MCF-7 derivative cell line.7 Another study demonstrated that promoter hypermethylation was not the cause of decreased progesterone receptor expression in a Tamoxifen-resistant but estrogen-dependent MCF-7 derived clone.8 However, methylation analysis of both ERα-positive and ERα-negative Tamoxifen-resistant cell lines derived from a single parental line have not been reported until now.
In the present study, we examine DNA methylation in two Tamoxifen-resistant clones of MCF-7, TMX2–11, and TMX2–28. TMX2–11 retained expression of ERα, while TMX2–28 lost expression of the gene.9 We found that prolonged treatment with Tamoxifen induced hypermethylation and hypomethylation throughout the genome. Analysis of methylation and expression of two genes with promoter methylation in both Tamoxifen-resistant cell lines demonstrated cell line-specific responses to treatment with 5-aza-2′deoxycitidine.
Results
Tamoxifen-selection results in extensive changes in DNA methylation
To compare DNA methylation among the Tamoxifen-selected cell lines, the 17β-estradiol (E2)-treated cells and the non-treated parental cell line, we used Multidimensional Scaling (MDS) to analyze results from the HumanMethylation450 BeadChip (HM450 BeadChip). Beta values of the top 1000 CpG sites that varied most among samples were plotted using the Minfi package for R. As illustrated in the MDS plot, one of the two Tamoxifen-selected cell lines and the E2-treated MCF-7 do not deviate from the parental MCF-7 on Dimension 1 (Fig. 1). These three groups all have a value of -7.5 relative units (RUs) on the y-axis (Dimension 1), and all are positive for ERα. In contrast, the Tamoxifen-selected, ERα-negative cell line, TMX2–28, falls about 28 RUs from the other samples. The deviation in Dimension 1 was restricted to the ERα-negative cell line suggesting that the methylation in this Dimension may be secondary to the loss of ERα and not a direct consequence of Tamoxifen-selection. In contrast, the deviation in Dimension 2, while significantly less than that of Dimension 1, may reflect methylation changes directly related to the E2 and Tamoxifen treatments. Both of the Tamoxifen-selected cell lines show a modest deviation in the same direction on Dimension 2. TMX2–11 is roughly 4 RUs from MCF-7, while TMX2–28 is one RU from the parent cell line. We treated MCF-7 cells with E2 for 14 d to examine the overall effect that short-term treatment with a known ERα agonist had on methylation. Interestingly, the E2-treated MCF-7 cells deviate by 1.5 RUs from the untreated MCF-7 but in the opposite direction as the two Tamoxifen-selected cell lines.
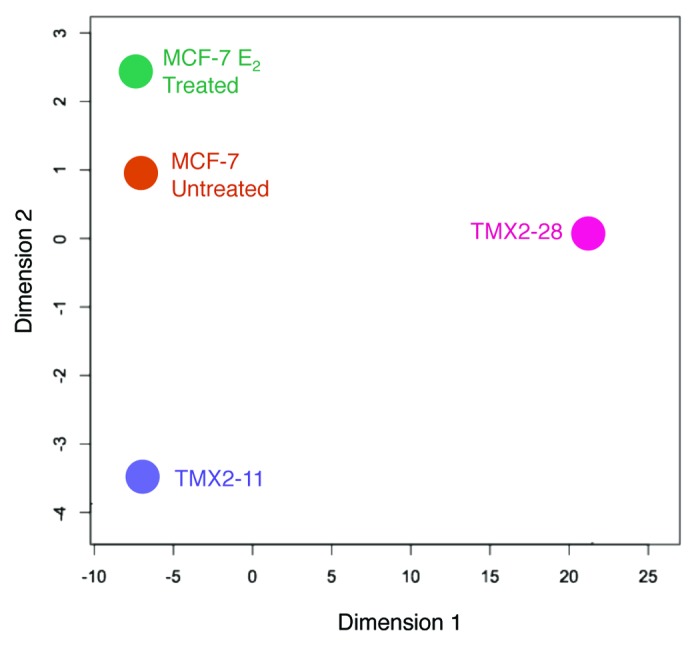
Figure 1. Visual representation of DNA methylation among the breast cancer cell lines. Methylation β values of the 1000 CpG sites that varied the most among the four groups were used with the Minfi package for R to prepare the multidimensional scaling (MDS) plot. Dimension 1 and 2 represent arbitrary distances among samples.
Differentially methylated CpG (dmCpG) sites in the Tamoxifen-selected lines are primarily hypermethylated
To further assess the effects of prolonged Tamoxifen treatment on DNA methylation we prepared scatter plots comparing all CpG sites among the Tamoxifen-selected cell lines and the parental line (Fig. 2). The areas outlined in blue on each of the scatterplots in Figure 2 include data points for dmCpG sites that show a 2-fold change and have average β values >0.3. The β value cut-off point of 0.3 was chosen based on previous literature demonstrating significant changes in CpG site methylation between Tamoxifen-resistant and parental cell lines.10-12 The scatter plots confirm and expand the results illustrated in the MDS plots; prolonged treatment with Tamoxifen results in methylation changes that are more pronounced in the cell line that lost expression of ERα (Fig. 2A and B). Additionally, for both cell lines the majority of dmCpGs are hypermethylated. Roughly eight times more CpG sites are hypermethylated in TMX2–28 as compared with TMX2–11 (33 752 vs. 4309; Table 1). While hypomethylation was less common, there are twice as many hypomethylated CpG sites in TMX2–28 as compared with TMX2–11 (5252 vs. 2593; Table 1). The methylation patterns of TMX2–11 and control MCF-7 (Fig. 2A) are more similar than those of the two Tamoxifen-resistant lines TMX2–11 and TMX2–28 (Fig. 2C). In contrast to prolonged Tamoxifen treatment, 14 d of treatment with E2 resulted in few dmCpGs, and these are primarily hypomethylation changes (Fig. 2D; Table 1).

Figure 2. Scatter plots indicate genome-wide methylation changes in Tamoxifen-resistant lines compared with the parental. TMX2–11 (A), TMX2–28 (B) and MCF-7 treated with 10−10 M E2 for 14 d (D) were compared with the parental line, MCF-7 and the Tamoxifen-resistant clones TMX2–11 and TMX2–28 (C) were compared against each other using GenomeStudio to determine the overall changes in methylation. Dashed lines mark the average β cut-off value of 0.3 for each sample; center red line represents equal β values in the two samples; outer red lines mark the 2-fold change in average β values for each sample; blue boxes enclose all CpG sites with average β values >0.3 and a >2-fold change in methylation.
Table 1. CpG methylation changes in Tamoxifen-resistant cell lines as compared with the parental line.
| TMX2–11 /MCF-7 | TMX2–28 /MCF-7 | MCF-7E2 /MCF-7 | TMX2–11 and TMX2–28 /MCF-7 | |
|---|---|---|---|---|
| Increased Methylation* | 4,039 | 33,752 | 128 | 3,130 |
| Decreased Methylation** | 2,593 | 5,252 | 1,698 | 203 |
| No Change in Methylation | 472,153 | 436,113 | 479,003 | 431,909 |
Note: *Increased methylation: >2-fold change, >0.3 β-value in TMX2–11, TMX2–28, or E2 treated MCF-7; **Decreased methylation: >2-fold change, >0.3 β-value in MCF-7; No change in methylation: <2-fold change in all lines. Detection p-value of <0.01 was used to distinguish statistically significant methylation changes.
To assess the effects of Tamoxifen on DNA methylation while limiting the potential bias due to loss of ERα in TMX2–28, we restricted the next set of analyses to CpG sites with methylation changes in similar directions (both hyper- or hypomethylated) in both TMX2–11 and TMX2–28 as compared with the parent cell line, MCF-7. The Tamoxifen-selected cell lines share roughly 3000 hypermethylated (>0.3 average β value and >2-fold change from MCF-7) and 200 hypomethylated (<0.3 average β value and <-2-fold change from MCF-7) CpG sites (Table 1).
dmCpG sites are found primarily in the intergenic, body and promoter regions
To obtain a better understanding of the effect of Tamoxifen on breast cancer cells, differential methylation of TMX2–11 and TMX2–28 as compared with MCF-7 was examined over the entire genome. Figure 3A shows the number of CpG sites included on the HM450 BeadChip in each of five regions: promoter (TSS200 and TSS1500 regions; 29%), 5′UTR/1st Exon (12%), body (31%), 3′UTR (3%), and intergenic (areas not included in the previous four regions; 25%).13 The functional genomic distribution of dmCpGs in the Tamoxifen-selected lines is shown in Figure 3B and C. In general the distribution of hyper- and hypomethylated CpG sites reflects their representation on the BeadChip. Thirty-two percent of CpG sites with hypermethylation are found in intergenic regions followed closely by the body (30%) and promoter regions (21%; Fig. 3B). Results are similar for hypomethylated CpG sites with 32% located in the body, 30% in the promoter, and 22% in intergenic regions (Fig. 3C). A single CpG site may be counted several times if there are multiple transcripts or gene-overlap, so that the total number of methylated CpG sites in Figure 3B and C do not add up to those in Table 1.

Figure 3. Location of aberrantly methylated CpG sites shared between TMX2–11 and TMX2–28. Functional genomic location of all CpG sites on the BeadChip (A) hypermethylated (B) and hypomethylated (C) CpG sites. Neighborhood location of all CpG sites on the BeadChip (D) hypermethylated (E) and hypomethylated (F) CpG sites. Promoter is TSS200 and TSS1500 regions of the gene; Intergenic regions are undefined locations in GenomeStudio; shores, located 0–2 kb and shelves, 2–4 kb from the canonical CpG island; open sea is defined as the remainder of the sequence.
Figure 3D summarizes neighborhood location of all CpG sites on the HM450 BeadChip as described in the GenomeStudio Methylation Module user guide (Illumina, San Diego, CA); shores (23%) are located 0–2 kb and shelves (10%) are 2–4 kb from the canonical CpG islands, while the remainder of the sequence is defined as open sea (36%; Fig. 3D).13,14 The relationship of shared hyper- and hypomethylated CpG sites in the Tamoxifen-selected lines to the canonical CpG islands is shown in Figure 3E and F. The pattern of the hypermethylated sites deviates from their representation on the HM450 BeadChip. Only 10% of hypermethylated CpG sites lie within the CpG islands, while 31% of the CpGs included on the BeadChip are within an island (Fig. 3D and E). The open sea region has the greatest number of hypermethylated sites (68% of all hypermethylated CpGs) and deviates the greatest from the representation on the BeadChip (36% of all CpGs). In contrast, the pattern of the hypomethylated genes reflects their representation on the BeadChip.
Sensory perception is among the top pathways affected by Tamoxifen selection
Pathway analyses were conducted on genes with dmCpG sites in both TMX2–11 and TMX2–28 as compared with MCF-7. The first DAVID analysis separately examined genes with either hyper- or hypomethylated sites occurring anywhere in the gene. The top 20 pathways with hypermethylated genes, out of an extensive list of statistically significant pathways, and the top 5 statistically significant pathways with hypomethylated genes are shown in Table 2. The hypermethylated pathway with the highest statistical significance is sensory perception of smell, which includes 100 olfactory receptor genes (Table S1). This is followed closely by the cell surface linked signal transduction pathway, which includes many of the same olfactory receptor genes as described above, as well as genes involved in the WNT and TGFβ signaling pathways. Sixty-four genes in the cell adhesion pathway have increased methylation and the majority of these genes are involved in ECM-receptor interaction pathways (Table 2). The hypomethylated gene list was less associated with any specific pathway, presumably due to the small number of hypomethylated dmCpGs
Table 2. Hyper- and Hypomethylated Pathways shared by TMX2–11 and TMX2–28.
| Hypermethylated* | |
|---|---|
| Pathway | P value |
| sensory perception of smell | 2.13E-34 |
| cell surface receptor linked signal transduction | 4.28E-33 |
| neurological system process | 1.34E-32 |
| sensory perception of chemical stimulus | 1.72E-32 |
| G-protein coupled receptor protein signaling pathway | 5.72E-30 |
| cognition | 2.95E-27 |
| sensory perception | 6.98E-26 |
| ion transport | 5.82E-08 |
| cell-cell signaling | 4.29E-07 |
| transmission of nerve impulse | 2.94E-06 |
| synaptic transmission | 1.13E-05 |
| neuron differentiation | 1.83E-05 |
| metal ion transport | 2.07E-05 |
| behavior | 5.32E-05 |
| cell motion | 1.41E-04 |
| regulation of system process | 2.78E-04 |
| cell adhesion | 3.77E-04 |
| biological adhesion | 3.91E-04 |
| neuron projection development | 4.75E-04 |
| calcium ion transport | 5.98E-04 |
| Hypomethylated** | |
| Pathway | P value |
| fear response | 0.007 |
| cell morphogenesis involved in differentiation | 0.025 |
| neuron development | 0.028 |
| multicellular organismal response to stress | 0.029 |
| neuron differentiation | 0.030 |
Top 20 hypermethylated pathways; **top 5 hypomethylated pathways.
Next we conducted DAVID analyses restricted to hypermethylated genes in either the promoter or the body regions. The top pathways with promoter hypermethylated genes are sensory perception of smell and sensory perception of chemical stimulus (70 and 72 genes respectively) with the majority being olfactory receptor genes (Table S2). In comparison, the top pathways with body hypermethylated genes are ion and metal ion transport (51 and 34 genes respectively), followed by cell adhesion (42 genes; Table S3). The promoter and body regions share only six out of the top 20 hypermethylated gene pathways (Table 3).
Table 3. Hypermethylated pathways in the promoter and body regions shared by TMX2–11 and TMX2–28*.
| Promoter | Body | ||
|---|---|---|---|
| Pathway | P value | Pathway | P value |
| sensory perception of smell | 6.50E-32 | ion transport | 7.35E-09 |
| sensory perception of chemical stimulus | 8.96E-31 | metal ion transport | 4.77E-07 |
| G-protein coupled receptor protein signaling pathway | 5.19E-26 | cell adhesion | 2.95E-06 |
| neurological system process | 2.31E-22 | biological adhesion | 3.02E-06 |
| sensory perception | 6.40E-21 | cell-cell signaling | 1.78E-05 |
| cognition | 6.69E-21 | cation transport | 1.96E-05 |
| cell surface receptor linked signal transduction | 2.52E-20 | multicellular organismal response to stress | 7.55E-05 |
| defense response to bacterium | 0.00135 | transmission of nerve impulse | 8.78E-05 |
| gamma-aminobutyric acid signaling pathway | 0.00220 | neurological system process | 1.01E-04 |
| ion transport | 0.00229 | appendage development | 1.10E-04 |
| transmission of nerve impulse | 0.00257 | limb development | 1.10E-04 |
| regulation of cell migration | 0.00334 | calcium ion transport | 1.33E-04 |
| behavior | 0.00420 | cell surface receptor linked signal transduction | 1.35E-04 |
| synaptic transmission | 0.00533 | response to pain | 1.60E-04 |
| chemotaxis | 0.00619 | neuron differentiation | 1.66E-04 |
| taxis | 0.00619 | muscle organ development | 2.15E-04 |
| cell-cell signaling | 0.00738 | cell motion | 2.50E-04 |
| regulation of locomotion | 0.00908 | regulation of system process | 3.11E-04 |
| response to drug | 0.00917 | di-, tri-valent inorganic cation transport | 3.26E-04 |
| regulation of cell motion | 0.00944 | synaptic transmission | 5.24E-04 |
Top 20 hypermethylated pathways.
Promoter methylation of ZNF350 and MAGED1
Given that promoter methylation (TSS200 and TSS1500 regions; Fig. 4A) can alter gene expression in cancer,5,6 we wanted to further examine the role of promoter methylation in the Tamoxifen selected cell lines. We selected two genes with at least two dmCpG sites that had β values above 0.3 and a >2-fold change in the promoter region in both TMX2–11 and TMX2–28 as compared with MCF-7 from the HM450 BeadChip. Expression of both genes has been shown to be downregulated in breast cancer, yet DNA promoter methylation has not been suggested as a potential mechanism of decreased expression.15,16 The first gene, zinc finger protein 350 (ZNF350), a DNA damage response protein, has increased methylation in 7 out of 10 promoter CpG sites represented on the HM450 BeadChip in TMX2–11 and in 8 out of 10 in TMX2–28 (Fig. 4B). The second gene, melanoma antigen family D1 (MAGED1), a tumor antigen and putative regulator of p53 transcription has five CpG promoter sites in transcript variant 3 represented on the BeadChip. Of these five sites, all are hypermethylated in TMX2–28 and four are hypermethylated in TMX2–11 (Fig. 4C). There were 120 additional genes that also displayed hypermethylation in at least two CpG sites in the promoter, approximately 40% of which are thought to play a role in cancer (Table S4).

Figure 4. ZNF350 and MAGED1 are differentially methylated in Tamoxifen resistant cells. (A) A map of typical CpG site locations in a gene. Promoter region (TSS200 and TSS1500) is shown in orange. (B) ZNF350 (C) MAGED1 heat maps show average β values of CpG sites interrogated across the gene. Functional genomic location and MAPINFO coordinate are shown for each CpG site. Orange boxes around MAPINFO and functional genomic location show promoter region CpG sites. Orange highlighted CpG sites indicate location of pyrosequencing primers. Average β value is represented by the scale on right with the highest methylation value (1) in red and the lowest (0) in green.
To confirm the methylation observed with the BeadChip and evaluate the TSS200 region (flanking region upstream of the TSS) in greater depth, we designed pyrosequencing assays to interrogate CpG sites in both ZNF350 and MAGED1. The pyrosequencing assay for ZNF350 examines seven CpG sites, four of which were represented on the HumanMethylation450 BeadChip (Fig. 4B, orange box). The pyrosequencing assay for MAGED1 examines four CpG sites, one of which was included on the BeadChip (Fig. 4C, orange box). Results obtained from pyrosequencing of bisulfite-modified DNA (percent methylated) confirm the increased promoter methylation discovered on the BeadChip for both ZNF350 and MAGED1 (Table 4). For ZNF350, the percent methylation in MCF-7 cells is remarkably similar to β values for all four CpG sites examined with both methods. Likewise, the percent methylation in ZNF350 in the Tamoxifen-selected cell lines is highly comparable to the β values. A similar trend is observed for MAGED1. A strong correlation is seen between HM450 BeadChip β values and pyrosequencing values for all CpG sites assayed (Pearson r = 0.931, P ≤ 0.0001; Fig. S1).
Table 4. Comparison of ZNF350 methylation by HumanMethylation450 BeadChip and Pyrosequencing in Tamoxifen-resistant and Parental Cell Lines.
|
MAPINFO coordinate |
MCF-7 | TMX2–11 | TMX2–28 | |||
|---|---|---|---|---|---|---|
| BeadChip* | Pyroseq** | BeadChip* | Pyroseq** | BeadChip* | Pyroseq** | |
| ZNF350 | ||||||
| 52490101 | 9 | 8 | 41 | 34.6 | 46 | 27 |
| 52490120 | 12 | 12.3 | 51 | 48.6 | 37 | 33 |
| 52490127 | 7 | 10 | 49 | 47 | 30 | 27 |
| 52490173 | 7 | 9.7 | 45 | 31.3 | 34 | 21 |
| MAGED1 | ||||||
| 51546021 | 17 | 28.3 | 44 | 33 | 79 | 71 |
MAPINFO coordinate = genomic coordinate of C in CpG site; *Average β value times 100; **Average percent methylation per site; n = 3 biological replicates.
Figure 5 shows the detailed pyrosequencing results for MCF-7 and the Tamoxifen-selected cell lines. For both ZNF350 and MAGED1 the CpG-site specific pattern is highly reproducible in DNA isolated nine months apart. Pyrosequencing across all sites confirm greater mean methylation in TMX2–11 (30% increase) and TMX2–28 (17% increase) as compared with MCF-7 for ZNF350 (Fig. 5A). Results for MAGED1 also confirm greater mean methylation, TMX2–11 (3% increase) and TMX2–28 (30% increase; Fig. 5B).

Figure 5. CpG site methylation of ZNF350 and MAGED1 in Tamoxifen-resistant and parental cell lines. CpG sites in the TSS200 region of (A) ZNF350 and (B) MAGED1 were analyzed by pyrosequencing. CpG sites present on the BeadChip are highlighted in orange. Two experiments conducted 9 mo apart demonstrate the permanence of methylation changed: Filled symbols indicate Experiment 1 (Exp1) and open symbols indicate Experiment 2 (Exp2). Each experiment consisted of three biological replicates for each cell line.
Treatment with 5-aza-2’deoxycitidine reverses DNA methylation in TMX2–28
To assess whether promoter methylation of ZNF350 and MAGED1 could be reversed to the levels of MCF-7, cell cultures were treated with 2.5 μM of 5-aza-2’deoxycitidine (5-Aza) or vehicle control for 4 d. Pyrosequencing of CpG sites in the TSS200 region of ZNF350 reveals a significant, 23% decrease in methylation (from 27 to 20) in TMX2–28 treated with 5-Aza (P = 0.006; Fig. 6A). Likewise, a 31% decrease in methylation is observed in the promoter of MAGED1 in TMX2–28 (P = 0.0002; Fig. 6B). A small (10%) but significant decrease in methylation is also observed in TMX2–11 cells (Fig. 6B).

Figure 6. Comparison of gene expression and promoter methylation in ZNF350 and MAGED1. Relative mRNA levels measured by qRT-PCR and average percent methylation of the TSS200 regions measured by pyrosequencing of (A) ZNF350 and (B) MAGED1 in control cultures and cultures treated with 5-Aza for four days. (A) Treatment with 5-Aza resulted in significantly increased expression of ZNF350 in TMX2–11, TMX2–28, and MDA-MB-231; however, only TMX2–28 showed a corresponding significant decrease in promoter methylation (see text). (B) Treatment with 5-Aza resulted in a significant increase in expression of MAGED1 in TMX2–28, however a significant decrease in methylation was observed in both TMX2–11 and TMX2–28 (see text). Comparisons were made on results from triplicate biological samples using an unpaired the student t test; * = P < 0.05 and **= P < 0.01. Two independent experiments were conducted nine months apart with similar results; results from experiment 1 are shown.
Decreasing methylation results in increased expression of ZNF350 and MAGED1 in TMX2–28
After determining that treatment with 5-Aza decreased promoter methylation, we asked whether the 5-Aza treatment also increases mRNA expression levels. We compared mRNA levels of ZNF350 and MAGED1 in treated and control cell lines. Treatment with 5-Aza significantly increases the expression of ZNF350 in TMX2–28 (5.6-fold) as compared with the untreated cell cultures (Fig. 6A). Interestingly, the expression of ZNF350 also increases in TMX2–11 (2-fold) even though there is no change in promoter methylation (Fig. 6A). In TMX2–11, ZNF350 expression levels are equivalent to those of MCF-7, while in the TMX2–28 cells ZNF350 is significantly overexpressed (TMX2–28 5-Aza vs. MCF-7 Control: P = 0.04; Fig. 6A). Treatment with 5-Aza increases expression of MAGED1 in TMX2–28 (442-fold) to a level significantly above that of MCF-7 (P = 0.028; Fig. 6B). In contrast, the expression of MAGED1 is not increased in TMX2–11, despite the significant decrease in methylation (Fig. 6B).
Analysis of the ERα-negative line, MDA-MB-231 is included for comparison with TMX2–28. Treatment with 5-Aza increases the expression of ZNF350 in MDA-MB-231 (P = 0.008) to levels similar to TMX2–28, but has no effect on MAGED1. Promoter methylation of ZNF350 and MAGED1 is low in MDA-MB-231 and not altered by 5-Aza treatment.
Discussion
Acquired Tamoxifen resistance occurs in approximately 33% of all women who are given the drug for 5 y.1 The mechanism of this acquired resistance by the cells is largely unknown, however DNA methylation has been shown to differ between Tamoxifen-resistant and Tamoxifen-sensitive cell lines.7,8 Past studies examined methylation changes in ERα-positive, Tamoxifen-resistant cell lines. Here we present methylation data on both ERα-positive and ERα-negative Tamoxifen-resistant cell lines derived concurrently from the parental cell line, MCF-7.
We found substantial overall changes in methylation, suggesting that DNA methylation is contributing to Tamoxifen resistance in both ERα-positive and -negative cell lines. Interestingly, the loss of ERα expression in TMX2–28 does not appear to be controlled by changes in methylation. TMX2–28 ERα has an average of 3% methylation in the promoter region as analyzed by pyrosequencing and treatment with 5-Aza does not cause re-expression (Williams, unpublished data). Further studies examining histone modifications and other epigenetic changes will likely provide insight into the loss of ERα expression in TMX2–28.
Since the ERα-negative TMX2–28 cells show significantly greater methylation changes than the ERα-positive TMX2–11 cells, it is likely that a large percent of the observed DNA methylation is secondary to the loss of ERα expression. To eliminate the bias due to ERα loss and to focus on pathways most relevant to Tamoxifen-resistance, we examined CpG sites similarly methylated in both TMX2–11 and TMX2–28 as compared with the parental MCF-7 line. The number of hypermethylated sites in both cell lines is greater than the number of hypomethylated and the dmCpGs are distributed across the gene regions. Because of the importance of promoter methylation in controlling gene expression,6,16 the HM450 BeadChip is enriched for CpG sites in the promoter region, with over 140 000 sites represented in the TSS200 and TSS1500 regions.13 Recent literature, however, suggests that body methylation may play an equally important role in controlling gene expression.17,18 Less than 1% of the promoter and body CpG sites represented on the BeadChip are hypermethylated in both TMX2–11 and TMX2–28 and of these dmCpGs, slightly more are in the body than in the promoter region (0.66% vs. 0.52%).
ZNF350 is frequently underexpressed in primary breast cancer.15 It functions as a transcriptional repressor by binding to its co-repressor, BRCA1, and silencing target genes involved in DNA damage response.15 Treatment with 5-Aza increased expression of ZNF350 in both Tamoxifen-resistant cell lines as well as MDA-MB-231, yet only in TMX2–28 was a significant decrease in promoter methylation observed. Expression of ZNF350 in TMX2–11 and MDA-MB-231 may be regulated by an upstream factor or by methylation outside of the CpGs examined. Published studies using 5-Aza to induce expression of genes downregulated in cancer indicate that multiple factors, such as location of CpG sites within the island regions, transcription factor promoter methylation and histone methylation play a role in controlling expression.19-23 A further investigation into gene expression using array-based methods may help elucidate the genes affected specifically by promoter methylation.
MAGED1 is an adaptor protein involved in regulation of various cellular processes altered in cancer including apoptosis, proliferation and cell growth.16,24 MAGED1 is downregulated in cancer and it has been reported that transfection of the gene into breast cancer cells lacking MAGED1 inhibits proliferation and invasion of the cells.16 Treatment with 5-Aza significantly decreases methylation of MAGED1 in both TMX2–11 and TMX2–28, but concomitant increased expression occurs only in TMX2–28. This suggests that methylation may be necessary, but not sufficient to re-express MAGED1 in TMX2–11 as the methylation decreases, but no change in expression is seen. No changes in either methylation or expression of MAGED1 were observed in MDA-MB-231. Cell line differences in response to 5-Aza highlight the difficulty of using agents which target methylation to treat breast cancer. TMX2–28 are more sensitive to the effects of 5-Aza and their appearance is notably altered (flatter, rounder, and larger in appearance) after four days of treatment (Williams, unpublished observations). The differences among the cell lines are analogous to the differences among breast cancers in patients. Not all breast tumors will respond similarly to treatment with demethylating agents and future emphasis must be placed on identifying markers that accurately predict response to treatment.
Conclusions
We have shown that long-term treatment with Tamoxifen results in significant DNA methylation changes in both ERα-positive and -negative breast cancer cells. We found that 5-Aza treatment increased gene expression levels that did not always correlate with decreases in promoter methylation, indicating another epigenetic mechanism or gene region is controlling expression. Our data suggest DNA methylation occurring in regions other than the promoter are vast and need further investigation to determine their significance in Tamoxifen resistance.
Materials and Methods
Cell culture, RNA, and DNA purification
TMX2–11 and TMX2–28 were kindly provided by John Gierthy (Wadsworth Center Albany, NY). MCF-7 cells were purchased from the American Type Culture Collection (ATCC). Cell lines were grown in Dulbecco’s modified eagle medium (without phenol red) supplemented with 5% cosmic calf serum (Hyclone Cat. No. SH30087.03), 2.0 mM of L-glutamine, 0.1 mM of nonessential amino acids, 10 ng/mL of insulin, 100 units/mL of penicillin, and 100 µg/mL of streptomycin. Cells were maintained at 37 °C with 5% CO2 in a humidified incubator and media was changed every 2 d. MCF-7 cells were cultured with and without 10−10 M E2 (Sigma-Aldrich Cat. No. E8875) added to the media for 14 d.
RNA was purified in triplicate for each cell line using TriReagent (Molecular Research Center, Inc. Cat. No. TR118) and DNA was purified using QIAamp DNA Mini kit (Qiagen Cat. No. 51304) as per manufacturer suggestion and protocols previously described.25,26 Purified RNA and DNA samples were quantified using a NanoDrop 8000 (Thermo Scientific).
Illumina HumanMethylation450 BeadChip
Samples purified from MCF-7, TMX2–11, TMX2–28, and short-term (14 d) 10−10 M E2-treated MCF-7 using the QIAmp DNA Mini kit (Qiagen Cat. No. 51304) were sent to the core facility at Roswell Park Cancer Institute for HM450 BeadChip (Illumina Cat. No.WG-314–1003) analysis. Briefly, DNA sent to Roswell Park Cancer Institute was quantitated by PicoGreen (Molecular Probes Cat. No. P7589) prior to bisulfite treatment with the EZ DNA methylation kit (Zymo Cat. No. D5001). Bisulfite-treated DNA was amplified at 37 °C for 20–24 h after treatment with 0.1N NaOH. The DNA was then fragmented at 37 °C for 1 h using an enzymatic process and subsequently precipitated in 100% 2-propanol at 4 °C for 30 min followed by centrifugation at 3000 × g at 4 °C for 20 min. Dried pellets were resuspended in hybridization buffer, 48° C for 1 h followed by 95 °C for 20 min, then loaded onto the HM450 BeadChip and incubated at 48 °C for 16–24 h. Following hybridization of DNA to the primers on the BeadChip, unhybridized and non-specific DNA was removed using wash buffers to prepare the chip for staining. After a single base extension of the hybridized primers using labeled nucleotides, the BeadChip was stained with Cy-3 and Cy-5 fluorescent dyes and read using the Illumina iScan Reader. The image data were then analyzed using Illumina GenomeStudio to assess efficiency of the reaction. Methylation of the interrogated CpG loci were calculated as the ratio of the fluorescent signals of methylated to unmethylated sites (β values).
5-Aza-2′deoxycitidine treatment of cells
Cells were seeded into 6-well plates at varying concentrations (MCF-7 and TMX2–11: 150 000 cells/well; TMX2–28 and MDA-MB-231: 100 000 cells/well) and allowed to attach overnight at 37 °C and 5% CO2. Two experiments were completed 9 mo apart. Triplicate replicate wells were treated with either 0.1% DMSO (vehicle control) or 2.5 µM 5-aza-2′deoxycitidine (Sigma-Aldrich Cat. No. A3656) in 0.1% DMSO for 4 d, refreshing the media every other day. On the fourth day, DNA and RNA were purified from the cells as described above and concentration and quality were evaluated using the NanoDrop 8000 (Thermo Scientific).
Pyrosequencing
DNA (1 µg) was bisulfite treated using the EpiTect Bisulfite kit (Qiagen Cat. No. 59104) and PCR Primers were designed using the Pyromark Assay Design Software (Qiagen). One µL of bisulfite treated DNA was amplified using the Pyromark PCR kit (Qiagen Cat. No. 978730) in a BioRad MyCycler and the following gene specific primers designed to target CpG sites in the TSS200 promoter region of the gene analyzed by the BeadChip: ZNF350 (NM_021632) GRCh37 HG19 Map position (MAPINFO) Ch19 coordinates: 52490101, 52490120, 52490127, and 52490173; Primers for pyrosequencing: FWD Biot-5′-TTGGTTTTTG GTTTAAAAAT TTGTTAT-3′, REV 5′-ACACTAACCT CTATTTTCTC CAAATACACA A-3′, SEQ 5′- ACTCCTACTT CTAAAATCCT-3′; MAGED1 (NM_001005332) MAPINFO ChX coordinate: 51546021; Primers for pyrosequencing: FWD 5′-GAGGTTTGAG TTAAGGGATT AAGATGA-3′, REV 5′-Biot-TACCCCCTCC TTCACTTCAA-3′, SEQ 5′- AGATGAAGGG AGATATTT-3′. Additional CpG sites not analyzed by the BeadChip were assessed in the pyrosequencing assay due to their proximity to the CpG sites of interest. Single stranded products were prepared for pyrosequencing by PyroMark vacuum prep tool (Biotage). Pyrosequencing reactions were performed using a Pyromark Q24 system (Biotage) and manufacturers protocol (Qiagen). Data were analyzed using Pyromark Q24 Software for percent methylation at the CpG sites interrogated.
Quantitative Real Time Reverse Transcriptase-PCR (qRT-PCR)
Primers for qRT-PCR were designed using Primer-BLAST (NIH) and the UCSC RefGene Accession number associated with the CpG site of interest (MAGED1 NM_001005332, ZNF350 NM_021632) or as previously described:15 MAGED1 FWD 5′-CCTTCTTCGT CAAGCCCCCA G-3′, REV 5′- AGGCAGCATT TGGACCCTTT-3′; ZNF350 FWD 5′-CCCAGTTGAA TGCTGTCTTC C-3′, REV 5′-CCACTCCTCC CAAGTGAAGT C-3′. qRT-PCR analysis was performed as previously described on a Roche LightCycler using the Qiagen OneStep RT-PCR kit (Qiagen Cat. No. 210212) and SYBR green I nucleic acid stain (Invitrogen Cat. No. S7567).25,26 Total RNA (75 ng) was combined with OneStep RT-PCR master mix, dNTPs, SYBR green (2×), and primers (25 μM each) described above in chilled capillaries (Roche Cat. No. 04929292001). RNA was reverse transcribed for 30 min at 50° C and subsequent amplification was assayed for 45 cycles using fluorescence generated by intercalating SYBR green dye into the resulting DNA product. Relative mRNA expression levels were normalized to hypoxanthine ribosyltransferase (HPRT) as described previously.25
Data analysis
Using the Minfi package for R,27 a β MDS was created from the β values of the top 1000 CpG sites that deviate the greatest most among the samples in the HM450 data files. GenomeStudio Methylation Module (v.1.9) was used to analyze the β values of the methylation data obtained from the HM450 BeadChip. CpG sites with detection p-values of < 0.01 were selected to ensure statistically significant CpG site data were analyzed. Average β value of >0.3 (range from 0–1) was used as a cutoff for hypermethylated CpG site divergence in the Tamoxifen resistant cell lines and an average β value of <0.3 for hypomethylated CpG sites. Lastly, to discern differences in the CpG site methylation data in Tamoxifen-resistant cell lines as compared with the parental line, MCF-7, a positive fold change was calculated as average β of Tamoxifen resistant cell line over parental cell line. A negative fold change was calculated as the parental cell line over the Tamoxifen resistant clone. GraphPad Prism (GraphPad Software Inc.) was used to analyze and graph the biological replicate statistical results from pyrosequencing and qRT-PCR and to calculate a Pearson correlation coefficient for HM450 BeadChip and pyrosequencing data. Unpaired the student t test with a P value of <0.05 were considered statistically significant. The Database for Annotation, Visualization and Integrated Discovery (DAVID; NIAID, NIH) was used to conduct pathway analysis from a list of genes associated with CpG sites described above as hyper- or hypomethylated.
Supplementary Material
Disclosure of Potential Conflicts of Interest
No potential conflicts of interest were disclosed.
Acknowledgments
The authors would like to thank Dr John Gierthy for his generous gift of TMX2–11 and TMX2–28. Williams KE was funded by the Department of Defense CDMRP Breast Cancer Pre-doctoral grant. This research was supported by grants from the Avon Foundation for Women and the Rays of Hope Foundation to KFA.
Glossary
Abbreviations:
- ERα
estrogen receptor α
- E2
17β –estradiol
- DMNT
DNA methyltransferase
- ZNF350
zinc finger 350
- MAGED1
melanoma antigen family D1
- 5-Aza
5-Aza-2’deoxycitidine
- MDS
multidimensional scaling
- dmCpG
differentially methylated CpG
- HM450 BeadChip
HumanMethylation450 BeadChip
- DAVID
Database for Annotation, Visualization and Integrated Discovery
Supplemental Materials
Supplemental materials may be found here: http://www.landesbioscience.com/journals/epigenetics/article/27111/
Footnotes
Previously published online: www.landesbioscience.com/journals/epigenetics/article/27111
References
- 1.Early Breast Cancer Trialists’ Collaborative Group (EBCTCG) Effects of chemotherapy and hormonal therapy for early breast cancer on recurrence and 15-year survival: an overview of the randomised trials. Lancet. 2005;365:1687–717. doi: 10.1016/S0140-6736(05)66544-0. [DOI] [PubMed] [Google Scholar]
- 2.Clarke R, Liu MC, Bouker KB, Gu Z, Lee RY, Zhu Y, Skaar TC, Gomez B, O’Brien K, Wang Y, et al. Antiestrogen resistance in breast cancer and the role of estrogen receptor signaling. Oncogene. 2003;22:7316–39. doi: 10.1038/sj.onc.1206937. [DOI] [PubMed] [Google Scholar]
- 3.Musgrove EA, Sutherland RL. Biological determinants of endocrine resistance in breast cancer. Nat Rev Cancer. 2009;9:631–43. doi: 10.1038/nrc2713. [DOI] [PubMed] [Google Scholar]
- 4.Zhou C, Zhong Q, Rhodes LV, Townley I, Bratton MR, Zhang Q, Martin EC, Elliott S, Collins-Burow BM, Burow ME, et al. Proteomic analysis of acquired tamoxifen resistance in MCF-7 cells reveals expression signatures associated with enhanced migration. Breast Cancer Res. 2012;14:R45. doi: 10.1186/bcr3144. [DOI] [PMC free article] [PubMed] [Google Scholar]
- 5.Widschwendter M, Jones PA. DNA methylation and breast carcinogenesis. Oncogene. 2002;21:5462–82. doi: 10.1038/sj.onc.1205606. [DOI] [PubMed] [Google Scholar]
- 6.Yang X, Yan L, Davidson NE. DNA methylation in breast cancer. Endocr Relat Cancer. 2001;8:115–27. doi: 10.1677/erc.0.0080115. [DOI] [PubMed] [Google Scholar]
- 7.Fan M, Yan PS, Hartman-Frey C, Chen L, Paik H, Oyer SL, Salisbury JD, Cheng AS, Li L, Abbosh PH, et al. Diverse gene expression and DNA methylation profiles correlate with differential adaptation of breast cancer cells to the antiestrogens tamoxifen and fulvestrant. Cancer Res. 2006;66:11954–66. doi: 10.1158/0008-5472.CAN-06-1666. [DOI] [PubMed] [Google Scholar]
- 8.Badia E, Duchesne MJ, Semlali A, Fuentes M, Giamarchi C, Richard-Foy H, Nicolas JC, Pons M. Long-term hydroxytamoxifen treatment of an MCF-7-derived breast cancer cell line irreversibly inhibits the expression of estrogenic genes through chromatin remodeling. Cancer Res. 2000;60:4130–8. [PubMed] [Google Scholar]
- 9.Fasco MJ, Amin A, Pentecost BT, Yang Y, Gierthy JF. Phenotypic changes in MCF-7 cells during prolonged exposure to tamoxifen. Mol Cell Endocrinol. 2003;206:33–47. doi: 10.1016/S0303-7207(03)00256-9. [DOI] [PubMed] [Google Scholar]
- 10.Stone A, Valdés-Mora F, Gee JMW, Farrow L, McClelland RA, Fiegl H, Dutkowski C, McCloy RA, Sutherland RL, Musgrove EA, et al. Tamoxifen-induced epigenetic silencing of oestrogen-regulated genes in anti-hormone resistant breast cancer. PLoS One. 2012;7:e40466. doi: 10.1371/journal.pone.0040466. [DOI] [PMC free article] [PubMed] [Google Scholar]
- 11.Rao X, Evans J, Chae H, Pilrose J, Kim S, Yan P, Huang RL, Lai HC, Lin H, Liu Y, et al. CpG island shore methylation regulates caveolin-1 expression in breast cancer. Oncogene. 2013;32:4519–28. doi: 10.1038/onc.2012.474. [DOI] [PMC free article] [PubMed] [Google Scholar]
- 12.Hill VK, Ricketts C, Bieche I, Vacher S, Gentle D, Lewis C, Maher ER, Latif F. Genome-wide DNA methylation profiling of CpG islands in breast cancer identifies novel genes associated with tumorigenicity. Cancer Res. 2011;71:2988–99. doi: 10.1158/0008-5472.CAN-10-4026. [DOI] [PubMed] [Google Scholar]
- 13.Sandoval J, Heyn H, Moran S, Serra-Musach J, Pujana MA, Bibikova M, Esteller M. Validation of a DNA methylation microarray for 450,000 CpG sites in the human genome. Epigenetics. 2011;6:692–702. doi: 10.4161/epi.6.6.16196. [DOI] [PubMed] [Google Scholar]
- 14.Krausz C, Sandoval J, Sayols S, Chianese C, Giachini C, Heyn H, Esteller M. Novel insights into DNA methylation features in spermatozoa: stability and peculiarities. PLoS One. 2012;7:e44479. doi: 10.1371/journal.pone.0044479. [DOI] [PMC free article] [PubMed] [Google Scholar]
- 15.Garcia V, Domínguez G, García JM, Silva J, Peña C, Silva JM, Carcereny E, Menendez J, España P, Bonilla F. Altered expression of the ZBRK1 gene in human breast carcinomas. J Pathol. 2004;202:224–32. doi: 10.1002/path.1513. [DOI] [PubMed] [Google Scholar]
- 16.Du Q, Zhang Y, Tian XX, Li Y, Fang WG. MAGE-D1 inhibits proliferation, migration and invasion of human breast cancer cells. Oncol Rep. 2009;22:659–65. doi: 10.3892/or_00000486. [DOI] [PubMed] [Google Scholar]
- 17.Jjingo D, Conley AB, Yi SV, Lunyak VV, Jordan IK. On the presence and role of human gene-body DNA methylation. Oncotarget. 2012;3:462–74. doi: 10.18632/oncotarget.497. [DOI] [PMC free article] [PubMed] [Google Scholar]
- 18.Hellman A, Chess A. Gene body-specific methylation on the active X chromosome. Science. 2007;315:1141–3. doi: 10.1126/science.1136352. [DOI] [PubMed] [Google Scholar]
- 19.Fournel M, Sapieha P, Beaulieu N, Besterman JM, MacLeod AR. Down-regulation of human DNA-(cytosine-5) methyltransferase induces cell cycle regulators p16(ink4A) and p21(WAF/Cip1) by distinct mechanisms. J Biol Chem. 1999;274:24250–6. doi: 10.1074/jbc.274.34.24250. [DOI] [PubMed] [Google Scholar]
- 20.Zhu WG, Dai Z, Ding H, Srinivasan K, Hall J, Duan W, Villalona-Calero MA, Plass C, Otterson GA. Increased expression of unmethylated CDKN2D by 5-aza-2′-deoxycytidine in human lung cancer cells. Oncogene. 2001;20:7787–96. doi: 10.1038/sj.onc.1204970. [DOI] [PubMed] [Google Scholar]
- 21.Liang G, Gonzales FA, Jones PA, Orntoft TF, Thykjaer T. Analysis of gene induction in human fibroblasts and bladder cancer cells exposed to the methylation inhibitor 5-aza-2′-deoxycytidine. Cancer Res. 2002;62:961–6. [PubMed] [Google Scholar]
- 22.Schmelz K, Sattler N, Wagner M, Lübbert M, Dörken B, Tamm I. Induction of gene expression by 5-Aza-2′-deoxycytidine in acute myeloid leukemia (AML) and myelodysplastic syndrome (MDS) but not epithelial cells by DNA-methylation-dependent and -independent mechanisms. Leukemia. 2005;19:103–11. doi: 10.1038/sj.leu.2403552. [DOI] [PubMed] [Google Scholar]
- 23.Han H, Cortez CC, Yang X, Nichols PW, Jones PA, Liang G. DNA methylation directly silences genes with non-CpG island promoters and establishes a nucleosome occupied promoter. Hum Mol Genet. 2011;20:4299–310. doi: 10.1093/hmg/ddr356. [DOI] [PMC free article] [PubMed] [Google Scholar]
- 24.Sasaki A, Hinck L, Watanabe K. RumMAGE-D the members: structure and function of a new adaptor family of MAGE-D proteins. J Recept Signal Transduct Res. 2005;25:181–98. doi: 10.1080/10799890500210511. [DOI] [PubMed] [Google Scholar]
- 25.Gozgit JM, Pentecost BT, Marconi SA, Otis CN, Wu C, Arcaro KF. Use of an aggressive MCF-7 cell line variant, TMX2-28, to study cell invasion in breast cancer. Mol Cancer Res. 2006;4:905–13. doi: 10.1158/1541-7786.MCR-06-0147. [DOI] [PubMed] [Google Scholar]
- 26.Gozgit JM, Pentecost BT, Marconi SA, Ricketts-Loriaux RS, Otis CN, Arcaro KF. PLD1 is overexpressed in an ER-negative MCF-7 cell line variant and a subset of phospho-Akt-negative breast carcinomas. Br J Cancer. 2007;97:809–17. doi: 10.1038/sj.bjc.6603926. [DOI] [PMC free article] [PubMed] [Google Scholar]
- 27.Hansen KD, Aryee M. Minfi: Analyze Illumina's 450k methylation arrays . 2012. R package version 1.7.8
Associated Data
This section collects any data citations, data availability statements, or supplementary materials included in this article.