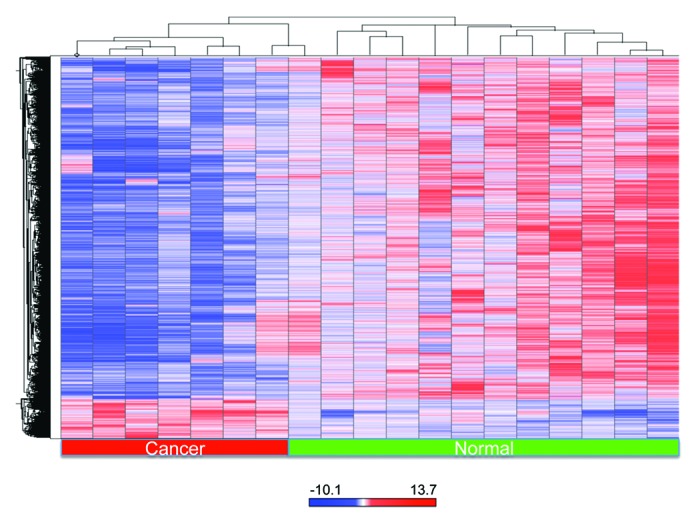
Figure 2. Heatmap of a subset of statistically significant methylated probes with more than 2-fold change differential methylation value when comparing normal to tumor samples (Unsupervised clustering). Because the empirical P values were calculated genome-wide, adjustment for multiple testing was performed. The P values were transformed into q-values, using the Benjamin–Hochberg correction. The probes that were found to have q-values less than 0.05 were deemed to be statistically significant and were included in the final gene list. The red color was selected to represent methylated gene promoters and the blue color to represent unmethylated genes. The red bar at the bottom indicates tumor samples and the green bar indicates normal samples.
