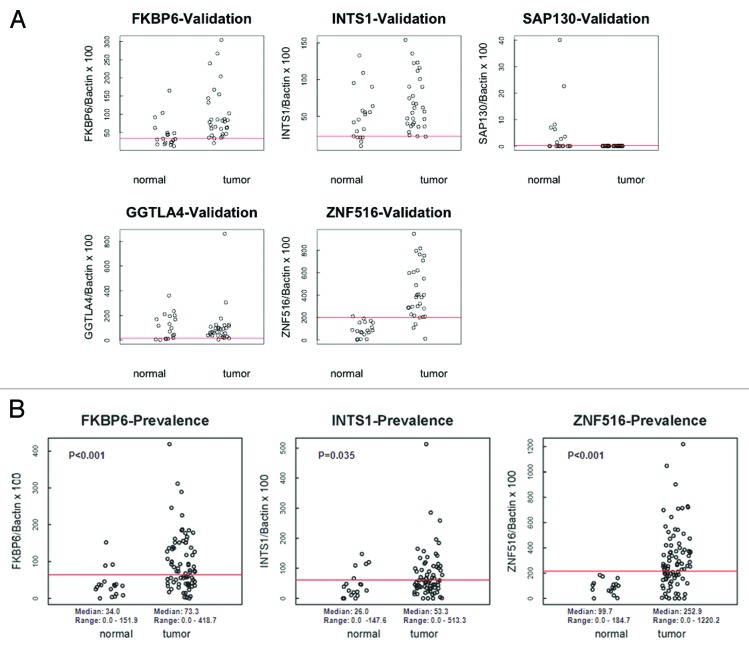
Figure 3. (A) Scatterplots of qMSP analysis for candidate gene promoters in the Validation cohort (normal n = 19, cancer n = 30). The relative level of methylated DNA for each gene in each sample was determined as a ratio of MSP for the amplified gene to β-actin. Red line denotes cut-off value. (B) Scatterplots of qMSP analysis of FKBP6, INTS1, and ZNF516 in the Prevalence cohort (normal n = 18, cancer n = 90). The relative level of methylated DNA for each gene in each sample was determined as a ratio of MSP for the amplified gene to β-actin. Red line denotes cut-off value.

An official website of the United States government
Here's how you know
Official websites use .gov
A
.gov website belongs to an official
government organization in the United States.
Secure .gov websites use HTTPS
A lock (
) or https:// means you've safely
connected to the .gov website. Share sensitive
information only on official, secure websites.
