

Abstract
The Illumina Infinium HumanMethylation450 BeadChip has emerged as one of the most popular platforms for genome wide profiling of DNA methylation. While the technology is wide-spread, systematic technical biases are believed to be present in the data. For example, this array incorporates two different chemical assays, i.e., Type I and Type II probes, which exhibit different technical characteristics and potentially complicate the computational and statistical analysis. Several normalization methods have been introduced recently to adjust for possible biases. However, there is considerable debate within the field on which normalization procedure should be used and indeed whether normalization is even necessary. Yet despite the importance of the question, there has been little comprehensive comparison of normalization methods. We sought to systematically compare several popular normalization approaches using the Norwegian Mother and Child Cohort Study (MoBa) methylation data set and the technical replicates analyzed with it as a case study. We assessed both the reproducibility between technical replicates following normalization and the effect of normalization on association analysis. Results indicate that the raw data are already highly reproducible, some normalization approaches can slightly improve reproducibility, but other normalization approaches may introduce more variability into the data. Results also suggest that differences in association analysis after applying different normalizations are not large when the signal is strong, but when the signal is more modest, different normalizations can yield very different numbers of findings that meet a weaker statistical significance threshold. Overall, our work provides useful, objective assessment of the effectiveness of key normalization methods.
Keywords: association testing, cotinine exposure, genome wide methylation profiling, normalization, reproducibility
Introduction
Understanding the association between epigenetic variability and complex exposures and disease promises an enhanced understanding of the risk factors for disease outcomes as well as the fundamental mechanisms underlying disease progression and biological response to key exposures.1 The array based Illumina Infinium HumanMethylation450K (Illumina450K) platform2,3 is a popular technology for large scale CpG methylation profiling being used in most large scale population based epigenetic profiling studies of thousands of human individuals due to its comprehensive coverage and high throughput. The Illumina450K is designed to assess methylation levels at 485 577 individual CpG sites across the genome and captures a wide range of important genomic features.2 This platform has been successfully used to identify methylation marks associated with smoking,4 cancer,5,6 aging,7 immune conditions,8 and is being employed in studies of a wide range of other exposures, disease outcomes, and conditions.
Despite its widespread and successful application in a number of studies, concerns about the technology have arisen.9-11 Briefly, the Infinium methylation technology is built upon the same technology as is used for genotyping SNPs. Each probe infers methylation levels by capturing quantitative uracil levels following bisulfite conversion of the unmethylated CpGs. Importantly, the Illumina450K methylation array contains two types of probes, Type I and Type II, which differ in the manner through which they quantify methylation levels.12 Specifically, Type I probes use a common design type as the older Infinium HumanMethylation27 Beadchip which operate using a single color with two different probes to generate methylated and unmethylated measurements. In contrast, Type II probes use a single probe with two different colors to obtain the methylated and unmethylated measurements. The overall distribution of methylation values measured using Type I and Type II probes is different2 and it has been reported that Type II probes are sometimes both less reproducible and sensitive.11 While other issues such as polymorphisms and cross reactive probes have arisen,10 the paramount concern seems to be in the issue of probe design type. The desire to address this perceived problem has spurred the development of a range of pre-processing and data normalization tools for the Infinium450K.12-15 Given the range of possible normalization methods, identification of the best normalization technique, and indeed whether normalization is even necessary, is a topic of great controversy and discussion within the field.
Despite the importance and the strong interest in the issue of normalization, there has been relatively little systematic assessment of different normalization approaches. Only recently has some systematic comparisons of preprocessing procedures been conducted.16 To further fill this critical gap in the literature, we compare the relative performance of four important normalization approaches on reproducibility using real data. Specifically, we examine the Illumina normalization and preprocessing method implemented in Illumina’s GenomeStudio software (Illumina Inc.), the subset-quantile within array normalization (SWAN) method,12 the β-mixture quantile normalization13 (BMIQ) method, and the complete pipeline (CP) for preprocessing implemented by Touleimat and Tost.14 While these methods are not a comprehensive catalog, they represent key approaches that are commonly being used. We also consider direct usage of the raw un-normalized data. We apply each normalization approach to a data set comprised of 1204 samples from the Norwegian Mother and Child Birth Cohort (MoBa) which contains a number of quality control samples and technical replicates. We then examine the effect of employing each method on the reproducibility of the measurements across technical replicates by examining key indicators and metrics of reproducibility. We further consider the ability of each approach to reduce the bias induced by usage of two different probe types. Finally, we examine whether the differences in normalized methylation measurements resulting from different approaches influence the subsequent association analysis results by examining the association between cord blood DNA methylation and maternal smoking during pregnancy within our birth cohort.
Results
Assessment of reproducibility and variability in technical replicates
A key objective of normalization is to remove technical and systematic variability from the data in order to make measurements comparable across samples. Therefore, we first investigated the ability of each normalization approach to reduce technical variation and improve reproducibility between technical duplicate pairs by examining the correlation and the 99th Quantile of Absolute Deviation (QAD), two metrics for reproducibility. The correlation represents a broader metric of reproducibility of the CpG measurements while the 99th QAD seeks to characterize near worst-case behavior.
Boxplots of the pair-wise correlation between the 14 pairs of technical duplicates after normalization are shown in Figure 1. Overall, the correlation between duplicates is high for all normalization procedures. However, where SWAN and BMIQ modestly improved overall reproducibility, the CP approach and the Illumina normalizations actually reduced overall reproducibility relative to the original raw data. Figure 2 presents boxplots for the 99th QAD for each of the 14 duplicate pairs and shows that the SWAN method offers slight improvement (reducing the 99th QAD) over using the raw data while BMIQ slightly increases the 99th QAD, though the raw data also had the most modest range indicating that the raw data offers some degree of robustness. Examining the reproducibility by probe type, we see that the Type I probes tended to have slightly better reproducibility in terms of correlation and 99th QAD than Type II probes: the median correlations for Type I probes were all above 99.9% for all methods except for SWAN whereas they were all below 99.9% for Type II probes. Interestingly, the Type I probes tended to be most reproducible in the original un-normalized raw data. Application of the SWAN and Illumina procedures reduced reproducibility of Type I probes while CP was, on average, similar to BMIQ and the raw data but the tails of the distribution indicate reduced reproducibility. Since Type II probes comprise the majority of probes on the platform (approximately two-thirds), the results restricted to Type II probes are qualitatively similar to results based on all probes. These results are not driven by just a few duplicate pairs. In Figs. S1–6, we present line plots indicating that the differences observed between methods in the correlations and 99th-QADs are relatively uniform across duplicate pairs. Boxplots of the 100th and 95th QADs (Figs. S7 and 8) are qualitatively similar to results from examining the 99th QADs.
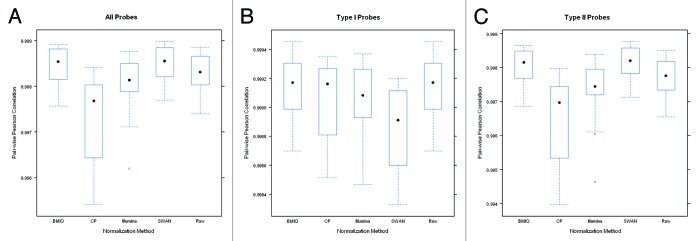
Figure 1. Boxplots of the pairwise Pearson correlation estimates between duplicate pairs constructed using (A) all probes, (B) just Type I probes, and (C) just Type II probes after application of each normalization method. Note that the scale of the y-axis for the center panel is considerably narrower which reflects the overall better reproducibility for Type I probes.
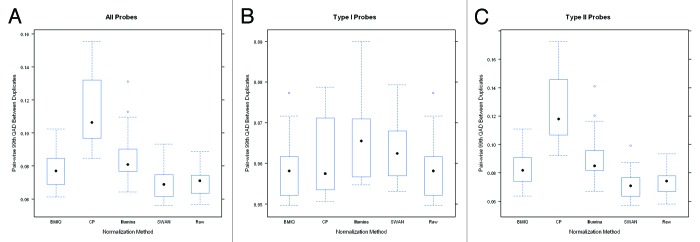
Figure 2. Boxplots of the pairwise 99th-QAD between duplicate pairs constructed using (A) all probes, (B) just Type I probes, and (C) just Type II probes after application of each normalization method. Note that the scale of the y-axis for the center panel is considerably narrower which reflects the overall better reproducibility for Type I probes.
We separately examined the standard deviation of the methylation values of each CpG measurement across 12 technical replicates of a single adult DNA sample and 13 technical replicates of a second adult DNA sample after applying the normalization procedures considered. Since the replicates are all from a common sample, with perfect reproducibility the same probe would have the same value across all replicates such that the standard deviation is zero. Thus, smaller standard deviations indicate better reproducibility. The boxplots of the standard deviations of each of the 485k CpGs across the technical replicates for each sample are presented in Figure 3 and cumulative distribution functions of the standard deviations are given in Figure S9. In contrast to the results based on examining pair-wise correlation and QAD in duplicate pairs, the median standard deviation was overall similar across methods but somewhat lower after applying the CP (median SDs for Adult DNA Sample 1 and Sample 2 = 0.012 and 0.013, respectively) and Illumina (median SDs = 0.015 and 0.016) normalizations while the BMIQ (median SDs = 0.017 and 0.016), SWAN (median SDs = 0.017 and 0.017), and raw data (median SDs = 0.019 and 0.019) had the highest overall variability across technical replicates. However, in examining the box plots in Figure 3, the height of the boxes as well as the large number of apparent outliers for both the CP and Illumina methods indicates that their distributions are wider. The substantially higher upper ranges and the longer tails for both the CP and Illumina normalizations indicate that although the median is slightly lower, the variability for many CP and Illumina normalized probes still substantially exceeds the variability in the raw data and after BMIQ or SWAN normalization.
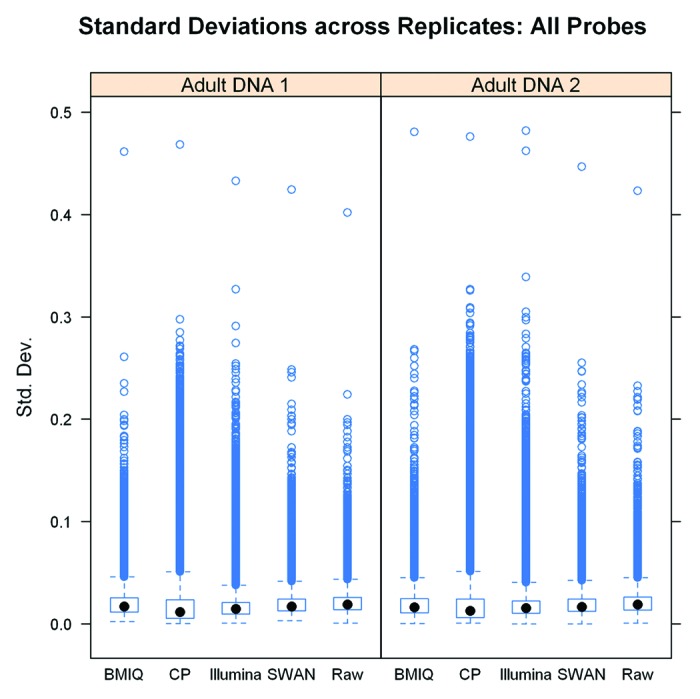
Figure 3. Standard deviations of the probe intensities across technical replicates for two different adult DNA samples after applying each normalization method.
Collectively, these results indicate that the behavior of the average probe is improved by using the CP and Illumina normalizations in comparison to the BMIQ, SWAN, and raw data. However, the large number of probes for which variability is introduced by using the CP and Illumina methods impairs the overall reproducibility as measured through correlation analysis and emphasizes the near worst-case behavior measured through the 99th QAD. On the other hand, the BMIQ and SWAN normalized data tended to behave better overall, but this generally represented a modest improvement over using the original raw data. These results reflect the different characteristics of the individual normalization methods. The CP and Illumina approaches both attempt cross sample normalizations which result in reduced overall variability on an average sense—as seen in the lower standard deviation across technical replicates. However, although the average behavior and overall distributions are made more similar, individual probes may not behave as well resulting in lower correlation and 99th-QAD. This is in contrast to BMIQ and SWAN which focus on within sample normalization. BMIQ directly uses the Type I probes as a reference, taking advantage of the strong overall reproducibility of the Type I probes, even in the raw data. On the other hand, SWAN still modifies the Type I probe values leading to better reproducibility in the Type II probes but reducing reproducibility of Type I probes. By further taking advantage of the fact that subsets of CpGs should behave similarly, further allows SWAN and BMIQ to remove undesired variability of individual CpGs.
We also examined the densities of the overall methylation distribution across eight randomly selected samples (Fig. S10) and also compared the overall distributions of probes between duplicate pairs via computation of the Kolmogorov-Smirnov statistic comparing the distance in distribution (Fig. S11). Results indicate that the CP approach makes the distributions between individuals more similar, but given the results above, this suggests that global similarity may not be sufficient for establishing improved reproducibility on the single CpG level.
To ensure that differences in methylation values between individuals are not lost due to over-normalization, we also examined the correlation and QAD in non-duplicate pairs. Figure 4 presents the pair-wise correlation in both non-duplicate pairs and in duplicate pairs. Overall, even for non-duplicate pairs, the correlation is quite high which results from the bimodal nature of the data. However, for each normalization procedure, the correlation between duplicate pairs is uniformly higher than correlation between non-duplicate pairs. Importantly, the methods that increase reproducibility between duplicate pairs do not seem to be reducing the differences between different individuals. The plots of the 99th-QAD between non-duplicate pairs (Fig. 4) also show that variability between individuals is not lost. Boxplots comparing correlation between duplicate and nonduplicate pairs are presented in Figures S12–16 and comparisons of the correlation and 99th QADs across methods are presented in Figures S17–20.

Figure 4. (A) Comparison of the distribution of pairwise Pearson correlations between duplicate pairs and non-duplicate pairs following application of each normalization method. Correlations for non-duplicate pairs are represented by shaded boxes and are lower across all methods. (B) Comparison of the distribution of 99th-QADs between duplicate pairs and non-duplicate pairs following application of each normalization method. 99th-QADs between non-duplicate pairs are represented by the shaded boxes and are higher across all methods.
Bias reduction results
A secondary objective of normalization procedures for the Illumina 450k array is to reduce the bias that arises from using different probe design types. In downstream analyses, the difference in probe behavior can lead to differential representation of Type I and Type II probes among the top results and can adversely affect the rankings of the individual CpGs. Thus, we examined the degree of bias due to probe design type using the approach of Marabita et al.16 to consider the behavior of pairs of adjacent Type I and Type II probes that are within 200 bp of each other. Nearby probes should behave similarly, irrespective of design type such that similarity is reflective of decreased bias. For two different subjects, we then plotted the densities of the Type I and adjacent Type II probes across two different subjects and after applying each of the normalization procedures (Fig. 5). First, we note that the raw data exhibits some bias which is not corrected when applying the Illumina normalization. We observe that the BMIQ and SWAN seem to best reduce the bias between the Type I and Type II probes as the plots lie on top of each other suggesting similarity. As with the results from examining reproducibility, these results makes sense as the BMIQ and SWAN actively seek to correct this difficulty while the Illumina approach does not. The CP does align the two modes of the Type I and Type II distributions very well, but the cross sample normalization may lead to too many Type II probes in the bottom mode. We note that following normalization, the overall distributions of the Type I and Type II probes are still different (Fig. S21).

Figure 5. Comparison of the density plots for adjacent Type I (blue lines) and Type II (red lines) probes in two different samples following application each normalization approach.
In addition to examining the overall distribution, we also examine the mean absolute difference between the adjacent probes across 40 samples (Fig. 6). Overall, the BMIQ procedure tends to make nearby probes behave the most similarly, followed by SWAN and the CP approaches. These results are qualitatively similar to the results from just examining the distributions of the Type I and Type II probes.
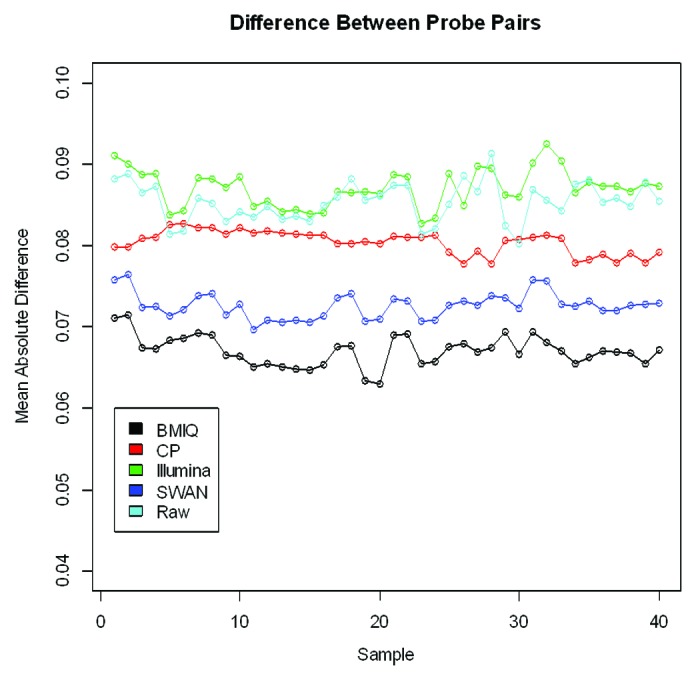
Figure 6. Comparison of the mean absolute difference between adjacent Type I and Type II probes across 40 samples after applying each method. Adjacent probes are believed to behave similarly and should exhibit similar distributions.
Although correction for bias can be useful, we note that the issue of bias primarily concerns power and interpretation. Failure to correct for bias will affect interpretation of the results in terms of rankings, but if analyses are conducted at the individual CpG level, then the statistical analyses are still valid in terms of protecting the false positive rate.
Comparison of association analysis results
In addition to assessing the absolute reproducibility of the measurements across technical replicates and duplicate pairs, we also conducted an association analysis using the data under each normalization in order to determine if the differences in normalized methylation intensities lead to differences in downstream analysis results. Therefore, we re-analyzed the association between cord blood DNA methylation and maternal plasma cotinine4 in each of the differently normalized data sets. The number of CpGs that would be called significant at the α = 10−9, 10−7, and 10−5 levels by each method are presented in Table 1. These α-levels are intended to be benchmarks representing results in which we have differing degrees of confidence rather than actual recommended significance levels. At the most stringent levels, the results from using different normalizations are very similar. However, as the α-level becomes less stringent, differences between the methods tend to be more pronounced, though overall, the BMIQ, SWAN and raw data tended to find similar CpGs as significant which is unsurprising given their similar behavior in terms of reproducibility. These results indicate that there are some important differences between the methods, but for the most confident results, the different methods will yield similar results. Thus, if a study is well powered, as in the case for the MoBa analysis of maternal plasma cotinine in relation to methylation, using different methods does not make much difference, though this may change if the signal is more modest, such that interest lies in P values within more modest ranges.
Table 1. Overlapping numbers of significant CpGs at each significance level α based on regressing percent methylation of each CpG on cotinine level using robust linear regression model with sandwich estimators of the covariance for P value calculation.
| BMIQ | CP | Illumina | SWAN | Raw | ||
|---|---|---|---|---|---|---|
| α = 10−9 | BMIQ | 27 | 26 | 25 | 26 | 25 |
| CP | 31 | 25 | 25 | 24 | ||
| Illumina | 26 | 25 | 24 | |||
| SWAN | 26 | 25 | ||||
| Raw | 25 | |||||
| α = 10−7 | BMIQ | 37 | 34 | 30 | 31 | 29 |
| CP | 52 | 30 | 32 | 29 | ||
| Illumina | 35 | 30 | 29 | |||
| SWAN | 36 | 30 | ||||
| Raw | 30a | |||||
| α = 10−5 | BMIQ | 156 | 108 | 92 | 97 | 94 |
| CP | 462 | 107 | 90 | 83 | ||
| Illumina | 207 | 96 | 86 | |||
| SWAN | 148 | 83 | ||||
| Raw | 105 |
Each number corresponds to the number of CpGs called significant at the particular α-level by both the method at the top of the table and the method at the left side of the table. aThis differs slightly from the number found in the original analysis4 since the current analysis uses percent methylation as the outcome and further adjusts for season of birth.
Focusing attention on the results in which we have lower confidence (α = 10−5 level), we briefly examined probes that are significant for one method and not for another. For BMIQ, SWAN and using the raw data, the differences were generally near the borderline, i.e., the probe just (barely) met significance using one method and the probe just failed to meet significance using another method, despite being of similar orders of magnitude. In considering the other approaches, as we observed in the standard deviations across the two adult DNA samples, the overall variance was lower allowing for detection of considerably smaller effect sizes and therefore somewhat increased significance—robust regression reduced the influence of some outliers.
Although some methods lead to more CpGs called significant, it is possible that some of these may be false positives. Unfortunately, distinguishing false from true positives is difficult as this depends on the unknown true state of nature. Therefore, we applied a split sample strategy emulating a discovery experiment using half the data followed by a validation of the top results from the discovery phase using the second half of the data. Results are presented in Table 2 and indicate that although the CP approach calls many CpGs to be significant, many of these fail to validate. On the other hand, the raw data actually has the highest validation rate, but at the same time, the fewest CpGs were called significant in the discovery set. The BMIQ, Illumina, and SWAN approaches were all comparable in both the number of discovered CpGs and the number that were validated. The balance in validation rates and number of CpGs called significant in the Discovery set would seem to favor the BMIQ, Illumina, and SWAN methods. The overlapping number of validated CpGs as well as estimated validation rates under more modest Discovery and Validation set sizes are presented in Tables S1 and 2 and are qualitatively similar.
Table 2. The number of significant CpGs in the discovery set, the validation set, and the percentage of CpGs that are validated for each normalization procedure.
| BMIQ | CP | Illumina | SWAN | Raw | |
|---|---|---|---|---|---|
| Discovery | 34 | 290 | 39 | 33 | 22 |
| Validation | 21 | 30 | 21 | 22 | 19 |
| Proportion Validated | 62% | 10% | 54% | 67% | 86% |
Significance for Discovery was determined at the Benjamini-Hochberg FDR = 5% level. These CpGs were validated in the Validation set. CpGs significant in the Validation set following Bonferroni adjustment for the number of significant Discovery CpGs are considered to be validated. Note that validation rates are considered upper bounds (best case) for methods that apply cross sample normalization since discovery and validation samples were jointly normalized.
We further note that if we had used the more stringent Bonferroni correction within the discovery analysis (α = 10−7), fewer CpGs would have been called significant but a larger proportion of them would have been validated by all of the methods (Table S3). This reinforces our finding that differences between methods are not dramatic in terms of the results in which we have highest confidence.
As additional analysis, we also considered the scenario in which we would choose to use rankings to select the CpGs for validation. Briefly, for each method, we computed the validation rate if, instead of using a specific significance threshold in the discovery stage, we simply attempted to validate the top m CpGs. The validation rates as a function of m are given in Figure S24, and show that the CP method may have slightly higher validation rates as m increases, though for modest values of m results are all quite similar, again emphasizing that high confidence results do not depend strongly on the normalization.
Aggregating at island level
The results at the single CpG level suggest that despite some differences between methods, the overall reproducibility is high, even for the original un-normalized raw data. Any improvements are generally modest. Even with differences between probe types, as long as analyses are conducted at the single probe level differences in probe type should not be strongly influential. However, it is possible that the need for normalization is more apparent when combining data across Type I vs. Type II probes. To examine this hypothesis, we aggregated the probes at the CpG island level via simple averaging and again examined the pair-wise correlation between duplicate samples (Fig. 7) as well as the 99th QAD and standard deviations across the two adult DNA samples (Figs. S25 and 26). Results show that reproducibility is reduced relative to the single CpG level since variability is also being aggregated. The aggregated SWAN normalized data were the most highly reproducible while the CP normalized data were the least, despite also reducing the desired variability in non-duplicate pairs. The raw data were again comparable to the BMIQ normalized data and both were slightly worse than using SWAN. Interestingly, the Illumina method actually performed better for the aggregated data than the original data. Overall, however, results indicate that aggregating reduces reproducibility with SWAN being slightly superior to the other methods, though the differences are once again modest.

Figure 7. (A) Pairwise Pearson correlation between CpG island level aggregate values for duplicate pairs (B) Comparison of the distribution of pairwise Pearson correlations between CpG island level aggregate values duplicate pairs and non-duplicate pairs following application of each normalization method. Correlations for non-duplicate pairs are represented by shaded boxes and are lower across all methods.
Discussion
In this study, we used a large genome wide methylation data set to systematically evaluate and compare the relative performance of using the raw un-normalized data and using the BMIQ, CP, Illumina, or SWAN normalized data. Specifically, we examined the reproducibility between technical replicates following application of each of the normalization procedures. We also compared the association analysis results from using data after applying each normalization. Collectively, the results based on examining the correlation and 99th QAD favor the use of BMIQ which reflects previous conclusions drawn by others.16 However, we find the SWAN procedure to also compare favorably—although SWAN does not perform as well on Type I, the Type I probes are already highly reproducible and SWAN does very well in increasing correlation across duplicates in Type II probes. Remarkably, the raw, un-normalized data are already highly reproducible and the improvements offered by using BMIQ and SWAN are modest. Both the Illumina and CP approaches may introduce additional variability into the data set. Results are similar when probes are aggregated at the CpG island level. In terms of probe bias reduction, BMIQ outperforms all of the other approaches followed by SWAN. Despite these important differences, the association analysis results reveal that applying different normalizations does not seem to make much difference for CpGs that are highly statistically significantly associated with the outcome or exposure variable, though differences are more apparent when the signal is weaker. When signal is weaker, the CP method finds more significance than other methods, but split sample analysis reveals that fewer CpGs validate when using the CP approach as well.
The strength of our work lies in the large number of technical replicates, which is larger than the sample sizes of many modestly sized experiments. This is among the first work to systematically compare the different normalization methods for Infinium 450K Methylation array in terms of both the reproducibility and the effect on downstream association analysis. A possible limitation of using a single large scale association study is the lack of a correspondingly large validation data set to verify the list of CpGs called significant in the illustrating association analysis. Although some two-stage analyses follow the same structure as our split sample strategy,17 our analysis does not exactly reflect a two-stage experiment using completely separate cohorts since both the Discovery and Validation sets were normalized together. This does not affect methods that only do within sample normalization, but for methods that consider cross-sample normalization, such as the CP, this means that the estimated validation rates may be optimistic and represent upper bounds (best case scenarios). In addition, due to differences in statistical power following each validation, failure to validate does not necessarily mean that individual CpGs are not associated with the outcome. Nevertheless, validation rate results are suggestive of the relative performance of the different approaches. We further note that in our previously published association analysis,4 we observed a striking degree of replication in an independent population when using the raw data.
Although it is true that Type II probes have greater variability, our results also show that both Type I and Type II probes, regardless of the normalization applied, are highly reproducible. This indicates that concerns regarding the issue may be somewhat over-inflated, particularly in light of our association analysis results. This also makes intuitive sense since single CpG based analyses will only focus on a single probe type at a time. Multi-CpG analyses will simultaneously test the effect of multiple probes (including probes of different design type), but any statistically valid method will automatically accommodate differences in variability. That said, however, assessment of whether the methylation values of different probe types actually reflect the underlying methylation level is challenging. Spike-in experiments or simultaneous application of alternative methylation platforms would be necessary.
The emphasis of our work is primarily on examining reproducibility, which from the perspective of many biomedical studies is of paramount importance. Consequently, we do not explore additional issues such as SNPs within the methylation probes as well as probes that map to multiple regions of the genome as they should be reproducible between technical replicates. Appropriate methods for assessing these features are important for interpretation of results and for quality control, but remain outside the scope of the present work.
Recently, sequencing based technologies for genome wide epigenetic profiling have emerged. While such technology may be able to better capture true methylation levels with higher resolution, such new technologies will undoubtedly present additional analytical and computational challenges. Combined with high costs we anticipate that the array based Infinium 450k Methylation platform will remain a popular technology for large scale CpG methylation profiling. Therefore, our results are reassuring in that despite some technical concerns, overall, the technology is highly reproducible and can yield results that are trustable, irrespective of the normalization procedure used
Methods
Normalization methods
The normalization methods considered in this work are: the Illumina normalization and preprocessing method implemented in Illumina’s GenomeStudio software (Illumina Inc.), the subset-quantile within array normalization (SWAN) method,12 the β-mixture quantile normalization13 (BMIQ) method, and the complete pipeline (CP) for preprocessing implemented by Touleimat and Tost.14 We briefly describe each method.
For each sample, the raw methylation value for each CpG is defined as β = M/(M + U + 100) where M and U are the intensities of the methylated and unmethylated probes, respectively. No processing, background subtraction, or normalization was done. The raw values we used were obtained directly exported from the GenomeStudio18 work space.
The Illumina normalization method is an optional normalization approach provided within GenomeStudio and separately implemented within the minfi19 Bioconductor package.20 The approach involves background subtraction which is intended to reduce variability between arrays due to differences in background levels and is accomplished by using negative control probes: probes that are thermodynamically equivalent to regular probes but that do not target specific parts of the transcriptome. Separate normalization to internal controls is accomplished by rescaling the probes for each sample such that the control probes have a common mean across samples. Methylated and unmethylated probes are normalized separately. We directly use the normalization implemented with the minfi package.
The SWAN method specifically addresses the bias and variability within each sample that arises from the different chemistry and design of Type I and Type II probes. SWAN assumes that conditional on the number of CpGs within the probe (an approximate reflection of its biological importance), the distribution of probe intensities should be the same. Consequently, subset quantile normalization can be used to enforce distributions to be similar. The SWAN adjusted intensities reduces technical differences between Type I and Type II probes within each array. No between array normalization is done.
As with the SWAN method, the BMIQ approach recognizes the differences in intensity due to probe design type and focuses on within sample normalization. The approaches focuses on transforming the only distribution of Type II probes to be similar to the Type I probes. Briefly, individual probes (of both types) on a sample are assigned to be methylated, hemi-methylated, and unmethylated. Then the Type II probes classified as methylated or unmethylated are quantile normalized to have identical distribution as the Type I probes of the corresponding class. Each hemi-methylated Type II probes is then location and scale adjusted to span the range between the methylated and unmethylated Type II probes.
The CP approach is an attractive method that comprehensively pre-processes the data through a sequence of steps that includes background subtraction and color bias correction, and within and across sample quantile normalization. Conveniently, the software also implements extensive quality control procedures including filtering of results based on the detection p-values, number of beads, and other probe characteristics such as presence of SNPs. The normalization focuses on using a subset quantile normalization to normalize the Type I probes and the Type I probes separately, with probes first divided into categories probe annotations and intelligently selected anchors for computing the reference distributions of the Type I and Type II probes.
MoBa methylation data
The Norwegian Mother and Child cohort (MoBa) enrolled over 100 000 women between 1999 and 2008 and has been described in detail elsewhere.21,22 The MoBa methylation study is an epigenetic profiling study within the broader MoBa birth cohort. Overall, epigenetic profiling of 1204 DNA samples was performed: in addition to cord blood DNA collected from 1131 singleton live births, additional duplicate and replicate samples were also generated. This included 13 pairs of technical duplicate samples from the infant cord blood samples as well as 2 adult DNA samples which were each replicated 13 times. The remaining samples consisted of additional cell line and quality control samples. For each sample, DNA methylation at 485 577 cytosine positions (CpG sites) was measured using the Illumina Infinium HumanMethylation450 BeadChip.2,3 Bisulfite conversion was performed using the EZ-96 DNA Methylation kit according to manufacture instructions (Zymo Research Corporation) and checked per methods previously described.2
We applied each of the four normalization approaches to the full 1204 samples from the MoBa study. In addition to these normalization approaches, we also considered the reproducibility of using the raw, un-normalized data (denoted as Raw). For each method, we used the standard defaults implemented within the corresponding software packages.
Following normalization, we conducted quality control (QC) of the data as previously described.4 Detection p-values and multidimensional scaling were used to identify erroneous samples and CpGs were excluded based on missing data and genomic position. Specifically, after omitting samples with potential gender mismatch probes with detection p-values greater than 10−5 were set to be missing. The CP approach includes additional built in QC that allowed for further filtering of probes with fewer than 3 beads. Samples with more than 5% of the CpGs missing were omitted such that 1068 of the 1131 infant DNA samples and 12 of 13 duplicate infant DNA pairs were available for analysis. In addition, 12 of 13 replicates of the first adult DNA sample and all 13 replicates of the second adult DNA sample survived QC and were available for analysis.
Assessing reproducibility in technical replicate samples
Our main approach for assessing reproducibility between pairs of replicates is to examine the reproducibility between pairs of technical replicates and the variation across technical replicates. Since the objective is to improve reproducibility, increased similarity between technical replicates and reduced variability between replicates are hallmarks of attractive normalization procedures.
We first assessed reproducibility by examining the Pearson correlation between pairs of duplicate samples. Since Pearson correlation measures similarity between two different sets of measurements, we can use this to examine similarity between duplicates. Thus, we randomly paired two of the replicate DNA samples for the first adult DNA sample and we separately paired two of the replicate DNA samples for the second adult DNA sample. Combined with the 12 infant duplicate samples, this yields a total of 14 pairs (28 samples) of technical duplicates. For each pair, we compute the standard Pearson correlation to obtain 14 correlations for each normalization method – since our objective is purely relative correlation the non-normality is not of concern. Higher Pearson correlation is indicative of improved reproducibility. Since the data are bimodal at zero and one, the correlation is necessarily high and should not be interpreted as an absolute measure but rather as a relative measure, which is our objective.
Although correlation is useful for obtaining an assessment of overall reproducibility, we are also interested in quantifying near “worst case” behavior since we want all of the data to be well normalized—not just the average case. Consequently, we also examined the Quantile of Absolute Difference (QAD) between duplicates. For any pair of samples, the qth QAD is found by computing the difference in methylation level for each probe, calculating the absolute value to obtain the absolute difference, and then determining the qth percentile of the absolute difference. The number q is between 0 and 100 and corresponds to the qth percentile of the absolute difference with 0 representing the minimum and 50 the median. Setting q to be 100 corresponds to assessing the reproducibility between a pair of replicates by the maximum absolute difference which corresponds to the absolute worst case. However, since this can be driven by a single outlier, we instead would set q to be a large number less than 100 in order to accommodate a few poorly performing probes while still assessing the near worst case behavior of each normalization method. In general, the QAD is useful metric for assessing reproducibility as it measures the dissimilarity between pairs of replicates. For each normalization method, we assessed the 99th QAD for each duplicate pair to obtain the 14 QADs. Since larger QADs correspond to larger differences between pairs of samples, a lower QAD is indicative of better reproducibility.
In addition to looking at reproducibility in duplicate pairs, we also examined across technical replicates in the 12 replicates of the first adult DNA sample and the 13 replicates of the second adult DNA sample. Briefly, for each of the CpGs in the study, we calculated the standard deviation in the methylation value across replicates. This was done separately for each of the two adult DNA samples in the study. The standard deviation is a direct measure of variability among a group of measurements. Since the subjects are all technical replicates, smaller standard deviations for each CpG, corresponding to lower variability, are representative of better reproducibility. Note that for each normalization method and adult DNA sample, we have a distribution of 485k standard deviations rather than single numbers.
Examination of non-replicate samples
Although reproducibility is the key metric for assessing preprocessing procedures, we also are interested in ensuring that the differences between individuals are not subsequently lost. Over-normalization would lead to reproducible data sets which would still allow for valid down-stream analysis, but at the expense of reduced power. To examine whether the methods that improve reproducibility are also removing inter-individual variability, we examined the same reproducibility metrics for duplicate pairs within non-duplicate pairs. For each of the 14 pairs of duplicate samples, we break the pairs and randomly pair each sample with a different sample. We then apply the same reproducibility metrics to the non-duplicate pairs.
Examination of probe design bias
In addition to examining reproducibility, another important metric for assessing preprocessing procedures lies in determining whether some procedures can reduce the bias between probe design types: essentially, does the measure methylation level well reflect the true methylation level and the associated variability. Therefore, we follow a similar approach used by others16 to compare the bias across different methods. The logic behind the approach is that CpGs in close proximity should share similar characteristics in terms of epigenetic relevance and should behave similarly irrespective of probe design type. To exploit this, we identified pairs of adjacent probes which are of differing design type, i.e., one Type I probe and one Type II probe. For each sample, we then examined the distribution of the Type I probes and the Type II probes comprising the pairs. Similarity in the distribution of Type I and Type II probes represents improved bias reduction. Separately, we also calculated the mean absolute difference between the probe pairs for each sample. Since we anticipate adjacent CpGs behaving similarly, a lower mean absolute difference is suggestive of lower bias.
Analysis of cotinine exposure data in the MoBa study
Using the 1062 infant samples on which we had complete covariate information, for each of the normalized data sets, we evaluated the association between plasma cotinine levels and methylation in cord blood at each of the CpG sites, one-at-a-time, using a similar approach as in the original analysis of these data4. Specifically, using the methylation β values as the dependent variable and the plasma cotinine as the predictor, we applied robust linear regression with sandwich-based estimators of the covariance in order to accommodate potential outliers and heteroskedasticity to compute a P value for each CpG. We adjusted for child sex, maternal parity, maternal age, folate,23 asthma, and season of birth as potential confounders. Note that this analysis differs from the original analysis of these data in that we used the methylation β values and we further adjusted for season of birth. We compared the number of probes that would be called significant by each of the methods at α = 10−5, 10−7, 10−9 levels, noting that 10−7 approximately corresponds to Bonferroni significance.
A limitation of using real data analysis results to compare methods is that the CpGs called significant may be false positives such that identification of more significant results is not necessarily indicative of a better approach. In general, determining false positives is difficult since it is unknown which probes are false positives, a priori. Therefore, we considered an alternative analysis to shed light on whether significant CpGs are false positives using a split sample strategy. Briefly, after applying each normalization approach, we split each of the normalized data sets into two equal data sets, treating half of the data as “Discovery” and half as “Validation.” We then analyzed the Discovery set using the same statistical tests as used previously in the analysis of the full (pooled) data set of 1062 samples and we identify the CpGs significant at the more liberal 0.05 Benjamini-Hochberg false discovery rate (FDR) level.24 We then attempted to validate each of the significant CpGs using the Validation set by again applying the same statistical analyses, except we controlled significance via the more stringent Bonferroni correction—note that the exact α-level for each method differs depending on the number of probes called significant in the Discovery set. We did this for each of the normalized data sets (splitting the subjects in the same way for each data set). The proportion of CpGs significant in the validation set is determined to be the validation rate. Ideally, a higher validation rate is suggestive (though not perfectly so) of lower false positive rate in the Discovery set. This analysis exactly replicates the Validation-Discovery process used in some split-sample analyses,17 but differs from Validation-Discovery processes that use two independent groups of subjects. This is due to the fact that the Validation and Discovery sets were normalized together such that for methods that do cross sample normalization, estimated validation rates are slightly more optimistic.
Assessing reproducibility in data aggregated at the CpG island level
When focusing on individual CpG analysis, wherein the CpGs are analyzed one-at-a-time, differences between probes in terms of design type may not play a large role since one is not comparing across probes. However, the result of differences between probe types may become more apparent if analyses are aggregated over CpGs measured with probes of different design type. To examine this hypothesis, we considered the 24 928 CpG islands comprised of more than 5 CpGs. Then for each sample we aggregated the CpGs within each island by simply averaging the CpG intensities to obtain 24 928 values. We then examined the reproducibility of these averaged methylation values by again computing the Pearson correlation and 99th-QAD between the same duplicate pairs as before. We acknowledge that simple averaging may not be the best way for aggregating values, but still serves as a qualitatively useful measure when examining reproducibility.
Supplementary Material
Disclosure of Potential Conflicts of Interest
No potential conflicts of interest were disclosed.
Acknowledgments
This research was supported in part by the Intramural Research Program of the NIH, National Institute of Environmental Health Sciences (Z01-ES-49019) and NIH grants P30ES010126 and R01HD058008. The Norwegian Mother and Child Cohort Study is supported by the Norwegian Ministry of Health and the Ministry of Education and Research, NIH/NIEHS (contract no NO-ES-75558), NIH/NINDS (grant no.1 UO1 NS 047537–01), and the Norwegian Research Council/FUGE (grant no. 151918/S10).
Supplemental Materials
Supplemental materials may be found here: www.landesbioscience.com/journals/epigenetics/article/27119
Footnotes
Previously published online: www.landesbioscience.com/journals/epigenetics/article/27119
References
- 1.Attar N. The allure of the epigenome. Genome Biol. 2012;13:419. doi: 10.1186/gb-2012-13-10-419. [DOI] [PMC free article] [PubMed] [Google Scholar]
- 2.Bibikova M, Barnes B, Tsan C, Ho V, Klotzle B, Le JM, Delano D, Zhang L, Schroth GP, Gunderson KL, et al. High density DNA methylation array with single CpG site resolution. Genomics. 2011;98:288–95. doi: 10.1016/j.ygeno.2011.07.007. [DOI] [PubMed] [Google Scholar]
- 3.Sandoval J, Heyn H, Moran S, Serra-Musach J, Pujana MA, Bibikova M, Esteller M. Validation of a DNA methylation microarray for 450,000 CpG sites in the human genome. Epigenetics. 2011;6:692–702. doi: 10.4161/epi.6.6.16196. [DOI] [PubMed] [Google Scholar]
- 4.Joubert BR, Håberg SE, Nilsen RM, Wang X, Vollset SE, Murphy SK, Huang Z, Hoyo C, Midttun Ø, Cupul-Uicab LA, et al. 450K epigenome-wide scan identifies differential DNA methylation in newborns related to maternal smoking during pregnancy. Environ Health Perspect. 2012;120:1425–31. doi: 10.1289/ehp.1205412. [DOI] [PMC free article] [PubMed] [Google Scholar]
- 5.Shen J, Wang S, Zhang YJ, Wu HC, Kibriya MG, Jasmine F, et al. Exploring genome-wide DNA methylation profiles altered in hepatocellular carcinoma using Infinium HumanMethylation 450 BeadChips. Epigenetics 2013; 8:0–1. [DOI] [PMC free article] [PubMed]
- 6.Heyn H, Carmona FJ, Gomez A, Ferreira HJ, Bell JT, Sayols S, Ward K, Stefansson OA, Moran S, Sandoval J, et al. DNA methylation profiling in breast cancer discordant identical twins identifies DOK7 as novel epigenetic biomarker. Carcinogenesis. 2013;34:102–8. doi: 10.1093/carcin/bgs321. [DOI] [PMC free article] [PubMed] [Google Scholar]
- 7.Heyn H, Li N, Ferreira HJ, Moran S, Pisano DG, Gomez A, Diez J, Sanchez-Mut JV, Setien F, Carmona FJ, et al. Distinct DNA methylomes of newborns and centenarians. Proc Natl Acad Sci U S A. 2012;109:10522–7. doi: 10.1073/pnas.1120658109. [DOI] [PMC free article] [PubMed] [Google Scholar]
- 8.Liu Y, Aryee MJ, Padyukov L, Fallin MD, Hesselberg E, Runarsson A, Reinius L, Acevedo N, Taub M, Ronninger M, et al. Epigenome-wide association data implicate DNA methylation as an intermediary of genetic risk in rheumatoid arthritis. Nat Biotechnol. 2013;31:142–7. doi: 10.1038/nbt.2487. [DOI] [PMC free article] [PubMed] [Google Scholar]
- 9.Bock C. Analysing and interpreting DNA methylation data. Nat Rev Genet. 2012;13:705–19. doi: 10.1038/nrg3273. [DOI] [PubMed] [Google Scholar]
- 10.Chen Y, Lemire M, Choufani S, Butcher DT, Grafodatskaya D, Zanke BW, et al. Discovery of cross-reactive probes and polymorphic CpGs in the Illumina Infinium HumanMethylation450 microarray. Epigenetics 2013; 8:0–1. [DOI] [PMC free article] [PubMed]
- 11.Dedeurwaerder S, Defrance M, Calonne E, Denis H, Sotiriou C, Fuks F. Evaluation of the Infinium Methylation 450K technology. Epigenomics. 2011;3:771–84. doi: 10.2217/epi.11.105. [DOI] [PubMed] [Google Scholar]
- 12.Maksimovic J, Gordon L, Oshlack A. SWAN: Subset-quantile within array normalization for illumina infinium HumanMethylation450 BeadChips. Genome Biol. 2012;13:R44. doi: 10.1186/gb-2012-13-6-r44. [DOI] [PMC free article] [PubMed] [Google Scholar]
- 13.Teschendorff AE, Marabita F, Lechner M, Bartlett T, Tegner J, Gomez-Cabrero D, Beck S. A beta-mixture quantile normalization method for correcting probe design bias in Illumina Infinium 450 k DNA methylation data. Bioinformatics. 2013;29:189–96. doi: 10.1093/bioinformatics/bts680. [DOI] [PMC free article] [PubMed] [Google Scholar]
- 14.Touleimat N, Tost J. Complete pipeline for Infinium(®) Human Methylation 450K BeadChip data processing using subset quantile normalization for accurate DNA methylation estimation. Epigenomics. 2012;4:325–41. doi: 10.2217/epi.12.21. [DOI] [PubMed] [Google Scholar]
- 15.Triche TJ, Jr., Weisenberger DJ, Van Den Berg D, Laird PW, Siegmund KD. Low-level processing of Illumina Infinium DNA Methylation BeadArrays. Nucleic Acids Res. 2013;41:e90. doi: 10.1093/nar/gkt090. [DOI] [PMC free article] [PubMed] [Google Scholar]
- 16.Marabita F, Almgren M, Lindholm ME, Ruhrmann S, Fagerström-Billai F, Jagodic M, Sundberg CJ, Ekström TJ, Teschendorff AE, Tegnér J, et al. An evaluation of analysis pipelines for DNA methylation profiling using the Illumina HumanMethylation450 BeadChip platform. Epigenetics. 2013;8:333–46. doi: 10.4161/epi.24008. [DOI] [PMC free article] [PubMed] [Google Scholar]
- 17.Huang YT, Lin X, Liu Y, Chirieac LR, McGovern R, Wain J, Heist R, Skaug V, Zienolddiny S, Haugen A, et al. Cigarette smoking increases copy number alterations in nonsmall-cell lung cancer. Proc Natl Acad Sci U S A. 2011;108:16345–50. doi: 10.1073/pnas.1102769108. [DOI] [PMC free article] [PubMed] [Google Scholar]
- 18.GenomeStudio® Methylation Module v1.8 User Guide. Illumina Inc., 2010.
- 19.Hansen KD, Aryee MJ. minfi: Analyze Illumina's 450k methylation arrays. R Foundation for Statistical Computing, 2012.
- 20.Gentleman RC, Carey VJ, Bates DM, Bolstad B, Dettling M, Dudoit S, Ellis B, Gautier L, Ge Y, Gentry J, et al. Bioconductor: open software development for computational biology and bioinformatics. Genome Biol. 2004;5:R80. doi: 10.1186/gb-2004-5-10-r80. [DOI] [PMC free article] [PubMed] [Google Scholar]
- 21.Magnus P, Irgens LM, Haug K, Nystad W, Skjaerven R, Stoltenberg C, MoBa Study Group Cohort profile: the Norwegian Mother and Child Cohort Study (MoBa) Int J Epidemiol. 2006;35:1146–50. doi: 10.1093/ije/dyl170. [DOI] [PubMed] [Google Scholar]
- 22.Nilsen RM, Vollset SE, Gjessing HK, Skjaerven R, Melve KK, Schreuder P, Alsaker ER, Haug K, Daltveit AK, Magnus P. Self-selection and bias in a large prospective pregnancy cohort in Norway. Paediatr Perinat Epidemiol. 2009;23:597–608. doi: 10.1111/j.1365-3016.2009.01062.x. [DOI] [PubMed] [Google Scholar]
- 23.Roth C, Bjørke-Monsen AL, Reichborn-Kjennerud T, Nilsen RM, Smith GD, Stoltenberg C, Surén P, Susser E, Ueland PM, Vollset SE, et al. Use of folic acid supplements in early pregnancy in relation to maternal plasma levels in week 18 of pregnancy. Mol Nutr Food Res. 2013;57:653–60. doi: 10.1002/mnfr.201200116. [DOI] [PMC free article] [PubMed] [Google Scholar]
- 24.Benjamini Y, Hochberg Y. Controlling the false discovery rate: a practical and powerful approach to multiple testing. J R Stat Soc, B. 1995;57:289–300. [Google Scholar]
Associated Data
This section collects any data citations, data availability statements, or supplementary materials included in this article.