Abstract
Adipose dysfunction resulting from chronic inflammation and impaired adipogenesis has increasingly been recognized as a major contributor to obesity-mediated insulin resistance, but the molecular mechanisms that maintain healthy adipocytes and limit adipose inflammation remain unclear. Here, we used genetic and pharmacological approaches to delineate a novel role for sphingosine kinase 1 (SK1) in metabolic disorders associated with obesity. SK1 phosphorylates sphingosine to form sphingosine 1 phosphate (S1P), a bioactive sphingolipid with numerous roles in inflammation. SK1 mRNA expression was increased in adipose tissue of diet-induced obese (DIO) mice and obese type 2 diabetic humans. In DIO mice, SK1 deficiency increased markers of adipogenesis and adipose gene expression of the anti-inflammatory molecules IL-10 and adiponectin and reduced adipose tissue macrophage (ATM) recruitment and proinflammatory molecules TNFα and IL-6. These changes were associated with enhanced insulin signaling in adipose and muscle and improved systemic insulin sensitivity and glucose tolerance in SK1−/− mice. Specific pharmacological inhibition of SK1 in WT DIO mice also reduced adipocyte and ATM inflammation and improved overall glucose homeostasis. These data suggest that the SK1-S1P axis could be an attractive target for the development of treatments to ameliorate adipose inflammation and insulin resistance associated with obesity and type 2 diabetes.
Keywords: sphingosine kinase 1, sphingosine 1 phosphate, adipose inflammation, insulin resistance, adipogenesis
the adipose tissue lies at the heart of the metabolic syndrome, and growing evidence indicates that obesity-associated metabolic disease occurs because of dysregulation of metabolic, endocrine, and immune functions of the adipose tissue (14, 19, 28). Impaired adipogenesis due to nutritional overload causes lipid deposition in ectopic tissues, including liver, muscle, and pancreases, and disrupts normal metabolic function (14, 20, 45, 47). Adipose inflammation driven by both adipocytes and infiltration and activation of adipose tissue macrophages (ATM) further disrupts normal adipose function and is linked to the development of insulin resistance/type 2 diabetes (T2D) (28, 29). Understanding the mechanisms that maintain metabolically healthy adipocytes and limit chronic adipose inflammation may identify novel targets for the treatment of obesity-related metabolic complications.
The bioactive sphingolipid sphingosine 1 phosphate (S1P) regulates signaling pathways crucial to cell growth, survival, migration, immune cell trafficking, angiogenesis, and inflammation (25, 41, 42). S1P is generated by phosphorylation of the ceramide metabolite sphingosine by two sphingosine kinases (SK1, SK2). S1P is synthesized by most cells, including platelets, erythrocytes, endothelial cells, mast cells, and macrophages (25, 41, 42). The major cellular and secreted source of S1P is derived from SK1 and mediates its functions through five cell-surface GPCRs (S1P1–5) or poorly defined intracellular targets (25, 41, 42). Sphingolipid metabolism generating ceramide and S1P can be activated by proinflammatory cytokines, growth factors, and free fatty acids (FFAs) present in the adipose tissue milieu in obesity (28, 29). In obese mice, ceramide levels are increased in plasma (36, 38) and adipose tissue (38, 43). Ceramide and S1P levels are also increased in the adipose tissue and plasma of obese humans (6, 7, 16, 21, 37). In lipid-infused or diet-induced obese (DIO) animal models, inhibition of de novo ceramide synthesis reduces protein phosphatase 2A activity, activates insulin-mediated Akt phosphorylation, and leads to increased insulin sensitivity (17, 37, 49). SK1/S1P signaling, with crucial roles in inflammation and immune cell trafficking (25, 41, 42), has the potential to contribute to insulin resistance via mechanisms that overlap with or are distinct from ceramide. However, its role in obesity-mediated adipose inflammation and insulin resistance has not been clearly defined.
The contribution of specific sphingolipids to insulin resistance is unclear because the synthesis of bioactive sphingolipids is regulated by a network of interconnected pathways, and an alteration in levels of one sphingolipid affects others. Studies have suggested that increased SK1 activity and S1P negatively regulate ceramide levels (22, 26) and that inhibition of SK1 increases ceramide (30). However, this is not always the case in vivo, where the network of regulatory pathways is more complex. HFD-fed SK1-transgenic mice showed no significant changes for muscle S1P levels, whereas ceramide levels were decreased (8). Mice deficient for S1P lyase, the enzyme that breaks down S1P, had increased levels of both S1P and ceramide (4). Improved insulin resistance after inhibition of de novo ceramide synthesis in genetically obese ob/ob and DIO mice resulted in decreased plasma ceramide and a modest but significant decrease in S1P (49). These studies underscore the complexity of the ceramide-S1P rheostat in vivo and the challenge in elucidating in vivo roles for specific sphingolipids in the metabolic complications of obesity.
Here, we used genetic and pharmacological approaches to uncover a novel role for SK1 in obesity-mediated insulin resistance. The data suggest that SK1/S1P signaling induces adipose inflammation and reduces adipogenesis, leading to adipose dysfunction and subsequent insulin resistance. The results have strong translational implications for the development of drugs targeting S1P at the level of synthesis via SK1 to treat the metabolic complications in obesity.
MATERIALS AND METHODS
Animals.
All experiments were approved by the Institutional Animal Care and Use Committee of the Torrey Pines Institute for Molecular Studies. C57BL/6J [wild-type (WT)] mice were from The Jackson Laboratory. SK1-deficient (SK1−/−) mice were bred from pairs supplied by Dr. Richard Proia [National Institutes of Health (NIH)] and back-crossed for at least 10 generations onto the C57BL/6J genetic background. Male mice were fed a palmitate-rich high-fat diet (HFD; 60% kcal from fat, D12492; Research Diets) or low-fat diet (LFD; 10% kcal from fat; Research Diets; D12450B) for 16 wk beginning at 6–8 wk of age. Body weights and food intake were monitored weekly. In some experiments, DIO mice were treated with the specific SK1 inhibitor 5c (2 mg/kg ip; Cayman Chemical) or vehicle (PBS) once daily for 3 days prior to metabolic evaluation.
Human subjects.
Human subject protocols were approved by the Committee on Human Investigation at University of California San Diego (UCSD), and all subjects provided written, informed consent. Subjects were recruited from diabetes clinics and classified as diabetic or nondiabetic by their response to a 75-g oral glucose tolerance test according to American Diabetes Association criteria and classified as obese if their BMI was >30 kg/m2, as described previously (32). Adipose tissue was obtained by needle biopsy of the lower subcutaneous abdominal depot (32). Other clinical data are summarized in Table 1. A majority of the T2D subjects were not taking any antidiabetic medications at the time of biopsy and were controlled by diet alone as part of a 6-wk washout of antidiabetic medications. Of the other T2D subjects, one was on glucovance, one was taking rosiglitazone, and the other was on glyburide and metformin at the time of biopsy.
Table 1.
Subject characteristics
| Nondiabetics | Diabetics | |
|---|---|---|
| n (Females/males) | 6 (2/4) | 10 (5/5) |
| Age, yr | 49 ± 6 | 57 ± 8 |
| BMI, kg/m2 | 36.1 ± 6.3 | 38.3 ± 6.9 |
| Weight, kg | 110 ± 20 | 115 ± 14 |
| Fasting glucose, mg/dl | 90.1 ± 5.8 | 146.7 ± 23* |
| Fasting insulin, pmol/l | 80 ± 23 | 196 ± 54* |
| FFA, mmol/l | 0.28 ± 0.09 | 0.6 ± 0.2* |
| Hb A1c, % | 5 ± 0.2 | 7.4 ± 1.1* |
| TG, mg/dl | 142 ± 98 | 211 ± 76 |
Data are means ± SE. BMI, body mass index; FFA, free fatty acids; TG, triglycerides.
P < 0.05 vs. nondiabetics.
Metabolic parameters.
Glucose tolerance tests (GTT) were performed on mice fasted for 6 h, and insulin tolerance tests (ITT) were performed on nonfasted mice. Mice were injected intraperitoneally with glucose (2 g/kg body wt) or human insulin (0.75 U/kg, Humulin; Eli Lilly), and blood samples were drawn via the tail vein at baseline and 15, 30, 60, 90, and 120 min postinjection. Plasma insulin levels were measured with an insulin assay kit (Mercodia Ultrasensitive Insulin ELISA; Alpco Diagnostics), and glucose was monitored with a Glucometer Elite Blood Glucose Meter (Bayer). Plasma FFA was measured with an NEFA -C kit and triglycerides with a Triglyceride E test (Wako).
Insulin signaling and Western blot analysis.
Mice were injected through the tail vein with 0.75 U/kg of human insulin or an equal volume of saline and euthanized 10 min later. The liver, epididymal adipose tissue (EAT), and muscle were collected for Western blot analysis with antibodies to Akt, phospho-Akt (p-Akt; Cell Signaling Technology), PPARγ (Cell Signaling Technology), and phospho-PPARγ (Millipore), as described previously (2, 49).
Sphingolipid analysis.
Ceramide, sphingosine, and S1P were analyzed by HPLC-tandem mass spectroscopy, as described (5, 49), at the Lipidomics core facility, Medical University of South Carolina. Briefly, plasma or tissue homogenates (in 50 mM Tris, pH 7.4, 25 mM KCl, 0.25 M sucrose, and 0.5 mM EDTA) were spiked with internal standards and extracted into a one-phase neutral organic solvent system (ethyl acetate-isopropanol-water, 60:30:10, vol/vol). The solvents were evaporated, and the sample was reconstituted in methanol and analyzed with an HP1100/TSQ 7000 LC/MS system. Quantitative analysis of analytes was performed in positive multiple reaction monitoring mode based on calibration curves generated by spiking an artificial matrix with known amounts of target analytes, synthetic standards, and internal standards. Sphingolipid levels were normalized to total protein levels (1 mg protein/sample).
Adipose tissue fractionation and adipogenesis.
EAT was washed and minced in PBS containing 0.5% BSA and incubated at 37°C with collagenase (1 mg/ml in PBS/0.5% BSA) for 20 min on a shaking platform. The mixture was filtered through a nylon filter (pore size 250 μm) and centrifuged (5 min, 200 g at 4°C), and floating cells and pellets were recovered as mature adipocyte and the stromal vascular fraction (SVF), respectively. The adipocyte fraction was further washed twice with PBS prior to mRNA isolation. The SVF was incubated in RBC lysis buffer (5 min), resuspended in DMEM/h 10% FBS, and cultured for three passages before differentiation. Adipogenesis was induced 2 days after preadipocyte culture was 100% confluent by treating cells with 200 nM insulin, 250 nM dexamethasone, and 0.5 mM isobutylmethylxanthine (Sigma-Aldrich) for 3 days and then for an additional 3 days in the absence of differentiating agents, with media replaced every 2 days. Twelve days postdifferentiation, cells were harvested for mRNA isolation and gene analysis.
Flow cytometry and CD11c+ selection.
Flow cytometry of EAT-derived SVF cells was performed as described previously (2). Cells were resuspended in fluorescence-activated cell sorter (FACS)buffer (PBS containing 1% FCS and 1 mM EDTA) and stained at 4°C for 30 min with fluorophore-labeled monoclonal antibodies to CD11b and CD11c (eBioscience) in the presence of Fc receptor-blocking antibodies (anti-CD16/CD32; eBioscience). Propidium iodide (Invitrogen) was added for live cell gating. Cells were washed, fixed in 1% formaldehyde, and analyzed on an LSR-II cytometer (BD Biosciences) with data processing using FlowJo (Tree Star). CD11c+ cells were positively selected from EAT SVF cells using anti-CD11c paramagnetic microbeads (Miltenyi Biotec).
Real-time quantitative RT-PCR.
cDNAs synthesized from total RNA (Ultraspec RNA isolation system; Biotecx Laboratories) were analyzed with gene-specific primer sets (Invitrogen) and SYBR Green PCR Master mix (PerkinElmer) in an iCycler (Bio-Rad) (2, 49). Relative gene expression levels were calculated after normalization to β-actin using the ΔΔCT method (Bio-Rad). The expression of the housekeeping gene β-actin was stable in the samples measured. Separate control experiments demonstrated that the efficiencies of target and reference (i.e., β-actin) amplifications were equal, thus validating the use of ΔΔCT for all of the transcripts that were measured.
Histology and immunohistology.
Formalin-fixed, paraffin-embedded sections (6 μm) of adipose and liver were stained with hematoxylin and eosin. Average adipocyte diameters were calculated by measuring the diameters from six random microscopic fields from each mouse using e image analysis software (SPOT; Diagnostic Instruments). For immunohistology, formalin-fixed paraffin sections of adipose tissues were incubated overnight at 4°C with the primary antibody rat anti-mouse F4/80 (Serotec). Negative controls were done without the primary antibody. The slides were then washed and treated sequentially with biotinylated goat anti-rat IgG (Jackson Immunoresearch), streptavidin-peroxidase conjugate (Zymed), and diaminobenzidine chromogen containing 0.03% hydrogen peroxide (Vector Laboratories). After rinsing in distilled water, the slides were counterstained with Gill modified hematoxylin for 20 s, rinsed, and mounted in GVA-mount (Zymed). Crown-like structures with positive macrophage staining were counted from six random microscopic fields from each mouse.
Statistical analysis.
The statistical significance of differences between groups was analyzed using the unpaired Student t-test.
RESULTS
Adipose SK1/S1P expression increases with obesity and T2D.
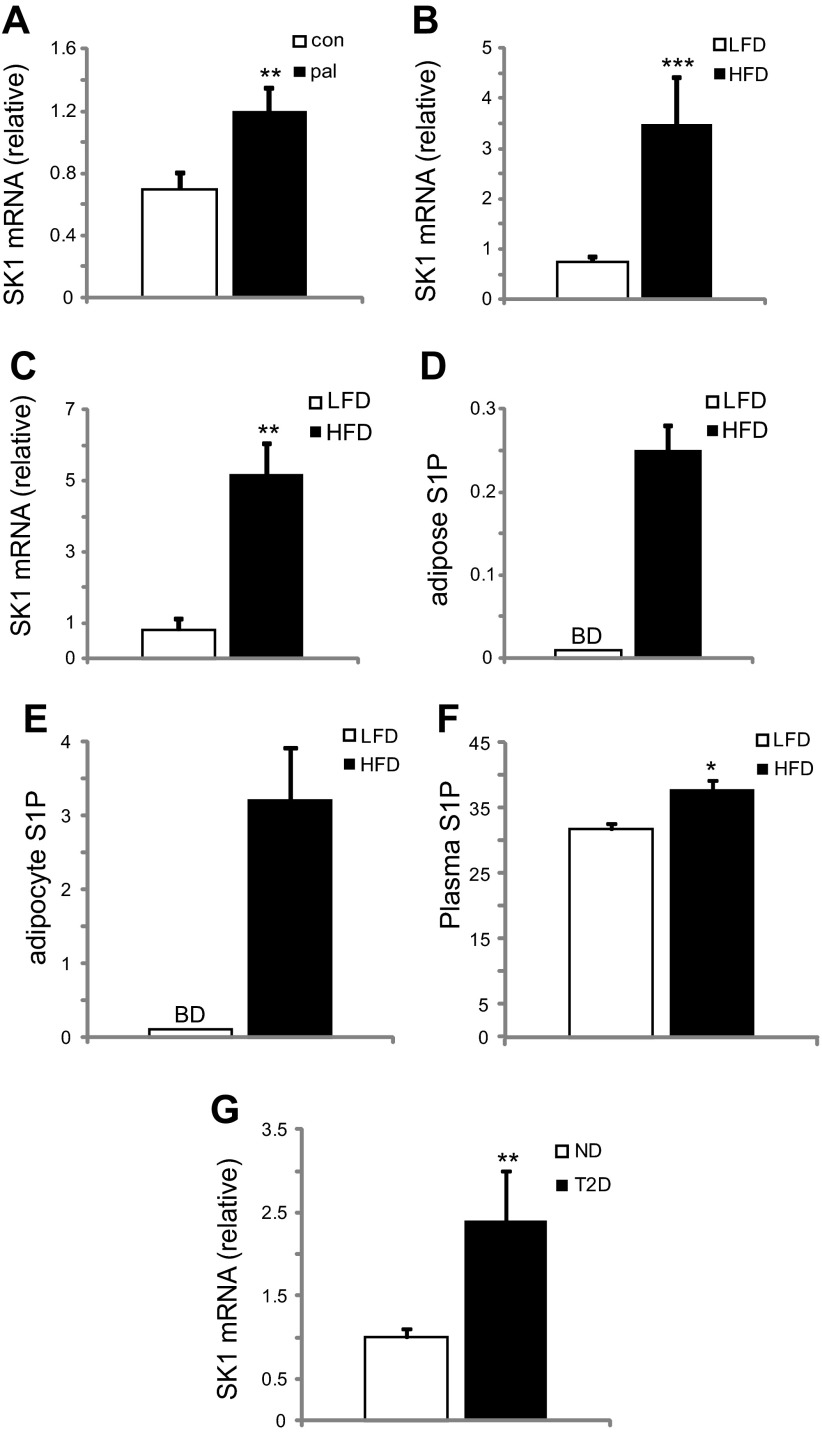
Because plasma FFAs are elevated in obesity, we first examined the effect of palmitate on primary adipocytes from C57BL/6 (WT) mice. Adipocytes cultured for 24 h with 1 mM palmitate showed increased levels of SK1 mRNA levels compared with control cells (Fig. 1A). These findings were confirmed in a DIO model where male C57BL/6J WT mice were fed a palmitate-rich HFD for 16 wk. EAT and adipocytes isolated from DIO mice showed increased SK1 mRNA levels compared with LFD-fed mice (Fig. 1, B and C). Consistent with SK1 expression, S1P levels were increased in EAT, isolated adipocytes, and plasma of DIO mice (Fig. 1, D–F). To gain insight into the clinical relevance of these observations, we analyzed SK1 expression in adipose tissues of obese (BMI >30 kg/m2) humans with or without T2D (Table 1). SK1 mRNA levels in adipose tissue from obese T2D patients were significantly higher than in nondiabetic subjects (Fig. 1G), suggesting that the adipose SK1/S1P axis may be functionally significant in insulin resistance related to obesity and T2D.
Fig. 1.
Adipose sphingosine kinase 1 (SK1)/sphingosine 1 phosphate (S1P) expression increases with obesity. A: SK1 mRNA in control and 24-h palmitate-treated (1 mM) adipocytes. Adipocytes were differentiated from stromal vascular fraction (SVF) of adipose tissues from C57BL/6J WT mice, as described (50). For A, n = 6 ± SD. **P < 0.01 for control vs. palmitate treated. SK1 mRNA in epididymal adipose tissue (EAT; B) and adipocytes (C) of C57BL/6J mice on high- (HFD) and low-fat diets (LFD). Eight-week-old male mice were fed either a HFD (60% fat; Research Diets, New Brunswick, NJ) or an isocaloric control LFD (10% fat) for 16 wk. S1P (pmol/mg tissue protein) in EAT (D) and adipocytes (E) of C57BL/6J mice on HFD and LFD. F: plasma S1P (pmol/100 μl) in LFD- and HFD-fed mice. For B–F, n = 10 ± SD. *P < 0.05, **P < 0.01, and ***P < 0.001 for LFD vs. HFD. BD, below detection threshold. G: SK1 mRNA in adipose tissues of obese nondiabetics (ND) compared with type 2 diabetics (T2D); n = 6–10 ± SD. **P < 0.01 ND vs. T2D. Clinical characteristics of research subjects are given in Table 1.
SK1 regulates adiposity and causes insulin-resistance.
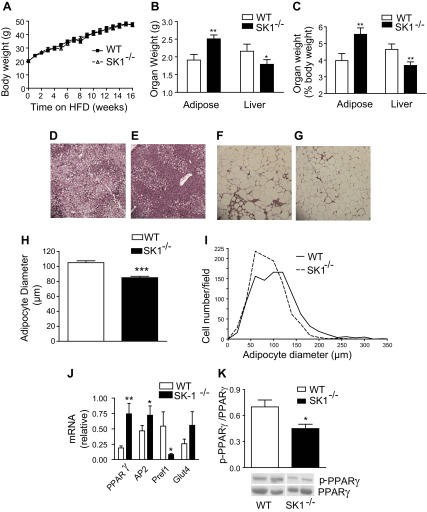
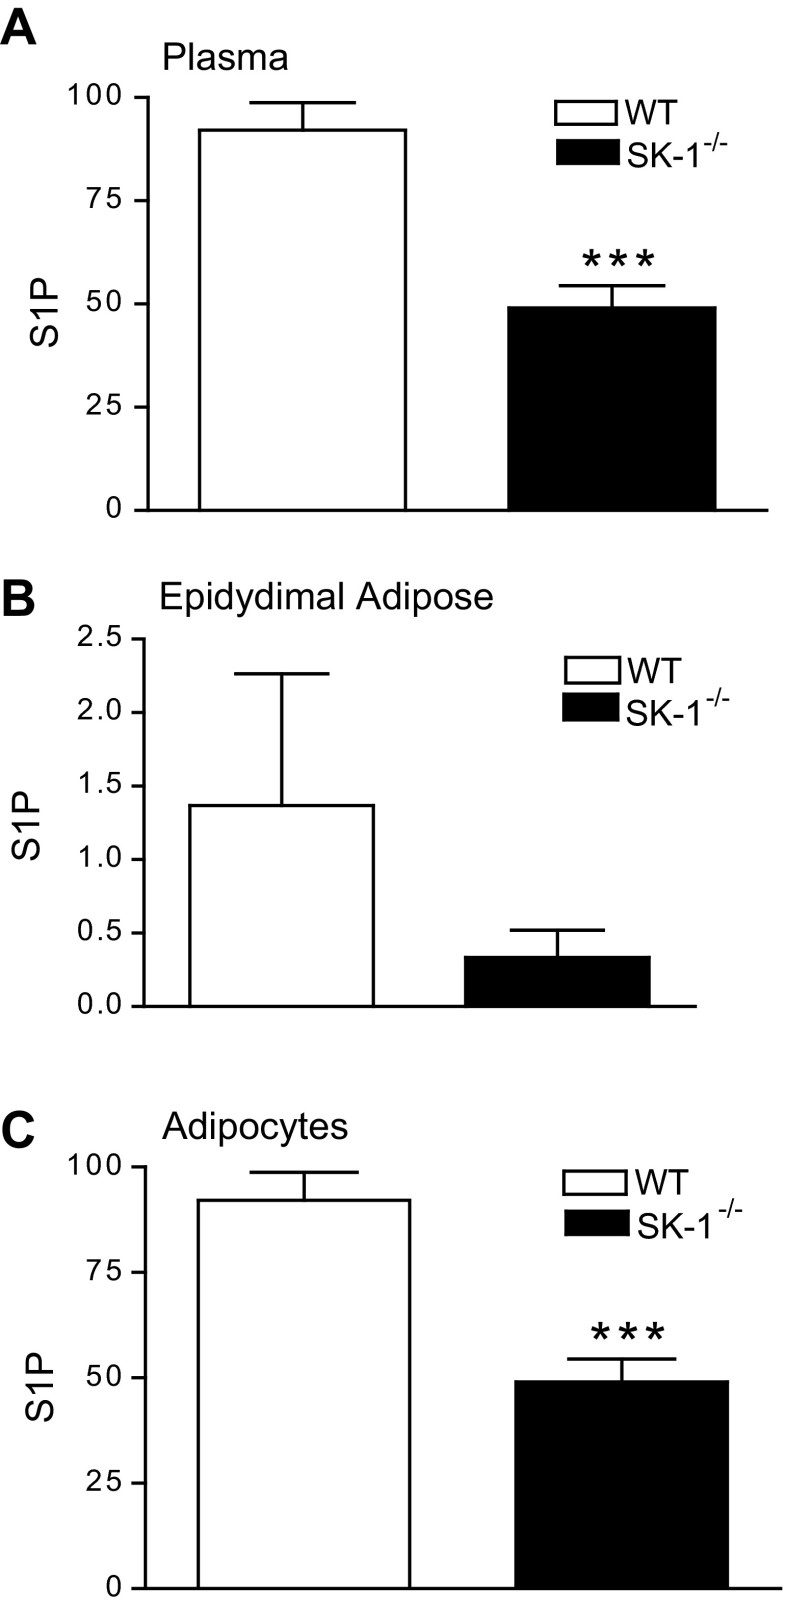
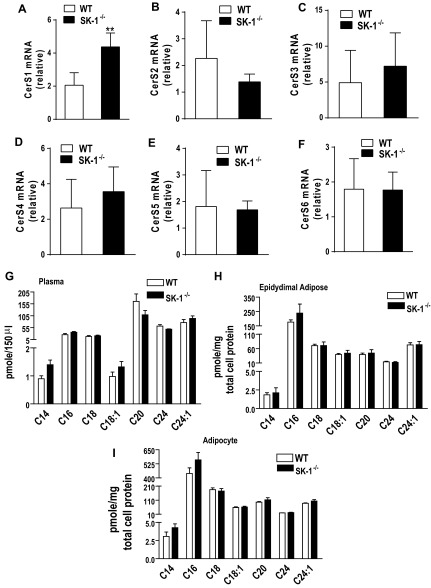
To directly assess the contribution of SK1 to obesity and its metabolic consequences, we compared the physiological and biochemical consequences of a 16-wk HFD on WT and SK1−/− mice. WT and SK1−/− mice on the HFD showed no differences in food intake (data not shown) and gained weight at a similar rate (Fig. 2A). However, the SK1−/− mice had higher EAT and lower liver weights (Fig. 2, B and C) and decreased steatosis (Fig. 2, D and E). Histological examination of EAT and quantification of adipocyte diameters revealed that DIO SK1−/− mice contained a larger number of smaller, less hypertrophic adipocytes than DIO WT mice (Fig. 2, F–I). Lipidomics analysis confirmed that S1P levels were decreased in the plasma, EAT, and adipocytes of DIO SK1−/− mice compared with WT mice (Fig. 3, A–C). In adipose tissues, no significant differences were observed between WT and SK1−/− mice in the transcriptional activity of enzymes that contribute to ceramide production via de novo ceramide synthesis [serine palmitoyl transferase (SPT); Fig. 4, A and B] or via hydrolysis of membrane sphingomyelin (acid sphingomyelinase and neutral sphingomyelinase; Fig. 4, C and D). Total ceramide and sphingosine levels in plasma, adipose tissues, and adipocytes were also similar in HFD-fed WT and SK1-null mice (Fig. 4, E–G). Our data are consistent with those of Baker et al. (3), who showed that plasma ceramide levels were similar in WT and SK1−/− mice transgenic for human TNFα. Other studies suggest that C16 and C18 ceramides may play significant roles in the pathogenesis of obesity and related metabolic complications (35). The fatty acid composition of ceramide is regulated by a family of genes known as ceramide synthases (CerS), with six members (CerS1–6) identified thus far. Measurement of gene expression of CerS1–6 in adipose tissues indicates that, with the exception of CerS1, which was higher in SK1−/− mice, no significant differences were observed in any of the other CerS between WT and SK1−/− mice (Fig. 5, A–F). CerS1 preferentially drives C18 and C20 ceramide; however, by lipidomics analysis we found no differences in C18 or any of the other ceramide species measured in the plasma, EAT, or adipocytes of HFD-fed WT and SK1−/− mice (Fig. 5, G–I). Thus, SK1 deficiency specifically reduces plasma and adipose levels of S1P in this model of DIO mouse.
Fig. 2.
SK1 regulates adiposity and steatosis. A: body and organ weights (B and C) of male wild-type (WT) and SK1−/− mice fed a HFD for 16 wk. For A–C, n = 10 ± SD. D–G: hematoxylin and eosin-stained sections of liver (D: WT; E: SK1−/−) and EAT (F: WT; G: SK1−/−) of HFD fed mice. H and I: adipocyte diameter distribution of adipocyte size in EAT of HFD-fed WT and SK1−/− mice. J: gene expression of adipogenic markers in adipocyte cultures from adipose tissue SVF 12 days postdifferentiation. K: Western blot of adipose PPARγ phosphorylation on Ser112 (top) and non-phospho-PPARγ (bottom); n = 6 ± SD. The bands of WT and SK1−/− in the Western blot are from the same blot and at the same exposure level. The separating white space denotes membrane splicing for clear presentation. *P < 0.05, **P < 0.01 WT vs. SK1−/−.
Fig. 3.
S1P (pmol/150 μl) levels in plasma (A), epididymal adipose (pmol/mg total cell protein; B), and adipocytes (pmol/mg total cell protein; C) isolated from EAT of 16-wk HFD fed WT and SK1−/− mice; n = 5 ± SD. ***P < 0.001, WT vs. SK1−/−.
Fig. 4.
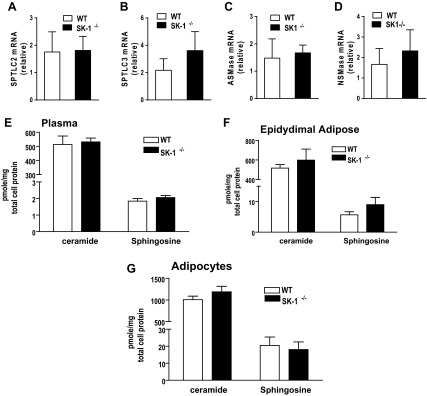
A–D: serine palmitoyl transferase (SPT) and long-chain base subunit 2 (SPTLC2) and 3 (SPTLC3) (A and B) and acid sphingomyelinase (ASMAse; C) and neutral sphingomyelinase (NSMase; D) mRNA levels in EAT of 16-wk HFD fed WT and SK1−/− mice. Ceramide and sphingosine levels in plasma (E), EAT (F), and adipocytes from epididymal adipose (G) of HFD-fed WT and SK1−/− mice; n = 5 ± SD.
Fig. 5.
A–F: ceramide synthase 1–6 (CerS) gene expression in EAT of 16-wk HFD-fed WT and SK1−/− mice. Levels of individual ceramide species in plasma (G), epididymal adipose (H), and adipocytes (I) isolated from EAT of HFD-fed WT and SK1−/− mice; n = 5 ± SD.
One mechanism that could contribute to adipocyte hyperplasia in SK1−/− mice is enhanced adipogenesis. To test this, we examined cells derived from the SVF of adipose tissue, which can differentiate into adipocytes in primary culture (1). SVF cultures derived from SK1−/− EAT showed enhanced expression of adipogenic markers PPARγ, AP2, and GLUT4 and a parallel decrease in the preadipocyte marker Pref1 compared with cultures from WT mice (Fig. 2J). Since a major mechanism that regulates adipogenesis is the phosphorylation status of PPARγ (11), we determined whether SK1 regulates PPARγ phosphorylation. Phosphorylation of PPARγ on Ser112 inhibits ligand binding by PPARγ and reduces its ability to promote adipogenesis (46). PPARγ Ser112 phosphorylation was reduced in adipose tissue from SK1−/− mice compared with WT mice (Fig. 2K), identifying a potential mechanism whereby SK1/S1P signaling might impair adipogenesis. These observations suggest that in response to a HFD, deficiency of SK1 allows healthy expansion of the adipose tissue via recruitment of adipose precursor cells into the adipogenic program.
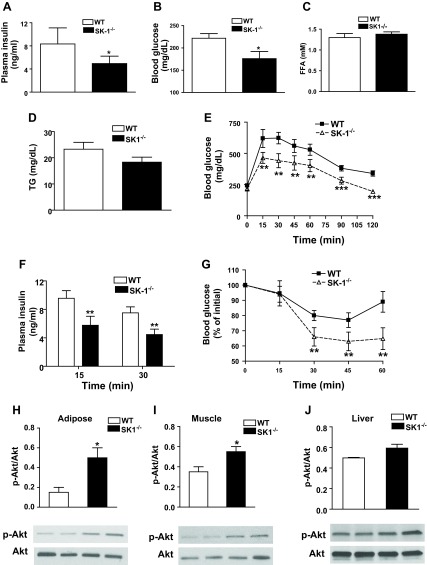
An inability to store lipids in the adipose tissue during nutritional excess causes lipid accumulation and disruption of insulin signaling in extra adipose tissues (44, 45, 47). Because HFD-fed SK1−/− mice displayed increased adipogenesis and adipose tissue expansion and decreased steatosis we asked whether glucose homeostasis was improved. Compared with HFD-fed WT mice, HFD-fed SK1−/− mice had lower fasting plasma insulin and glucose (Fig. 6, A and B), but plasma FFA and triglyceride levels were similar in both genotypes (Fig. 6, C and D). In GTT, SK1−/− mice more efficiently cleared an intraperitoneal bolus injection of glucose, demonstrating improved glucose tolerance (Fig. 6E), and plasma insulin levels at 15 and 30 min during GTT were also lower in SK1−/− mice (Fig. 6F). SK1−/− mice also demonstrated improved insulin sensitivity, shown by more efficient insulin-mediated suppression of plasma glucose in ITT (Fig. 6G). To determine the primary insulin-sensitive tissues that contributed to enhanced systemic insulin sensitivity, we analyzed insulin-mediated phosphorylation of Akt. Akt phosphorylation was higher in the EAT, muscle, and liver of DIO SK1−/− than DIO WT mice following injection of insulin (5 U iv), although the change in liver did not reach statistical significance (Fig. 6, H–J). These data indicate that SK1 deficiency improves systemic insulin sensitivity in DIO mice primarily by restoring adipose tissue and muscle insulin sensitivity.
Fig. 6.
SK1 contributes to HFD-mediated glucose tolerance and insulin resistance. Fasting plasma insulin (A), glucose (B), free fatty acids (FFA; C), and triglycerides (TG; D) in male WT and SK1−/− mice fed a HFD for 16 wk. Glucose tolerance test (GTT; E), plasma insulin after GTT (F), and insulin tolerance test (ITT; G) in 16-wk HFD-fed WT and SK1−/− mice. For GTT and ITT, mice were injected ip with either insulin (0.75 U/kg body wt Himulin) or glucose (2 g/kg body wt), and blood glucose was determined at indicated times. For A–G, n = 10 ± SD. Phosphorylated Akt in EAT (H), muscle (I), and liver (J) of HFD-fed WT and SK1−/− mice. For analysis of Akt, mice were fasted for ∼6 h, injected with 0.75 U/kg insulin via the tail vein, and euthanized 10 min later. Tissues were collected for Western blotting using antibodies to phosphorylated Ser473 of Akt and Akt. For H–J, n = 5 ± SD. *P < 0.05, **P < 0.01, and ***P < 0.001, WT vs. SK1−/−.
Loss of SK1 ameliorates adipocyte proinflammatory responses and restores an anti-inflammatory phenotype.
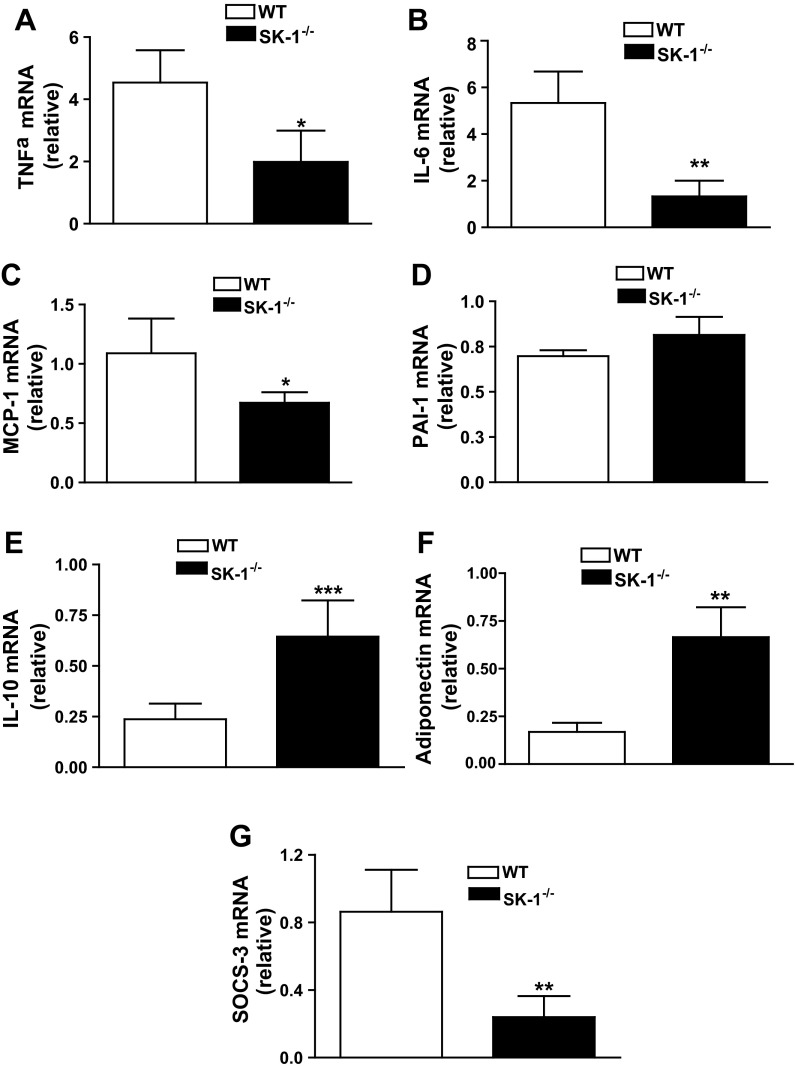
Adipose tissue inflammation initiated by inflammatory signals generated by adipocytes and propagated by infiltration and activation of immune cells, particularly macrophages, is a key factor in the development of insulin resistance and T2D. Although aspects of adipose inflammation are well understood, initial cues driving obesity-related adipocyte inflammation are unclear. To determine whether SK1/S1P signaling influences adipocyte inflammation in vivo, we measured the expression of inflammatory genes in adipocytes purified from DIO WT or SK1−/− mice. Proinflammatory cytokines TNFα, IL-6, and monocyte chemotactic protein-1 (MCP-1) were lower in EAT of SK1−/− compared with WT mice, but there was no difference in plasminogen activator inhibitor 1 mRNA levels (Fig. 7, A–D). The reduction in proinflammatory molecules was accompanied by a concurrent increase in transcription of the anti-inflammatory mediator IL-10 (Fig. 7E) and adiponectin (Fig. 7F), known to protect from insulin resistance (28, 29). We also examined expression of suppressor of cytokine signaling 3 (SOCS3), which contributes to inflammation-driven insulin resistance in adipocytes (39, 40). Adipocytes from HFD-fed SK1-deficient mice had dramatically reduced SOCS3 mRNA levels compared with WT mice (Fig. 7G), providing additional mechanisms by which SK1 may contribute to insulin resistance. These findings are consistent with a model where adipocyte SK1/S1P signaling plays a key role in the adipose tissue inflammatory response accompanying obesity.
Fig. 7.
SK1 promotes adipocyte proinflammatory responses. TNFα (A), IL-6 (B), monocyte chemotactic protein-1 (MCP-1; C), plasminogen activator inhibitor-1 (PAI-1; D), IL-10 (E), adiponectin (F), and suppressor of cytokine signaling 3 (SOCS3; G) mRNA levels in adipocytes isolated from EAT of WT and SK1−/− fed a HFD for 16 wk; n = 10 ± SD. *P < 0.05, **P < 0.01, and ***P < 0.001, WT vs. SK1−/−.
SK1 contributes to ATM recruitment and regulates the macrophage inflammatory phenotype.
In the context of the total macrophage population in the adipose tissue, increased numbers of M1 (CD11b+/CD11c+) macrophages that are primarily proinflammatory account for the majority of the increase in ATM in obesity, and >90% of recruited monocytes become CD11c+ adipose tissue macrophages, and this is linked to insulin resistance (28, 29). Although the resident population of M2 (CD11b+/CD11c−) macrophages is considered to be anti-inflammatory with homeostatic function, their origin and role in adipose function and insulin resistance are less understood. Because S1P is a potent chemoattractant for monocytes and macrophages (13), we hypothesized that adipocyte-derived S1P might act in concert with other adipocyte mediators (e.g., MCP-1) to facilitate ATM recruitment. In obese adipose tissue, an increase in the number of histological features known as crown-like structures (CLS) that represent accumulation of one or more macrophages around a single adipocyte correlate with adipose inflammation and insulin resistance. Although CLS-containing macrophages were readily observed surrounding adipocytes in the EAT of DIO WT mice (Fig. 8A), the number of CLS was markedly lower in EAT of DIO SK1−/− mice (Fig. 8, A–C). Moreover, transcription of the macrophage markers F4/80 and CD68 was significantly lower in adipose tissues of DIO SK1−/− mice (Fig. 8, D and E). FACS analysis of SVF cells from these mice indicates that the population of M1 (CD11b+/CD11c+) macrophages was significantly reduced in EAT of SK1−/− mice compared with WT mice (Fig. 8, F and G). With respect to the population of M2 (CD11b+/CD11c−) macrophages, although there appeared to be a modest decrease in this population in the SK1−/− mice, this change was not significant (Fig. 8, F and G). Thus SK1 is a significant instigator of M1 macrophage recruitment observed in the adipose tissues in obesity and does not have a major role in the regulation of the M2 resident population.
Fig. 8.
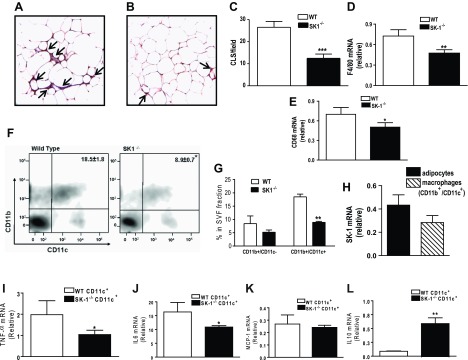
SK1/S1P signaling promotes adipose tissue macrophage recruitment during diet-induced obesity (DIO). Immunohistochemistry for F4/80 from sections of EAT from WT (A) and SK1−/− mice (B) showing macrophage staining within “crown-like structures” (CLS; arrows). C: quantification of CLS in EAT from HFD-fed WT and SK1−/− mice; n = 6 ± SD. D and E: macrophage marker F4/80 (D) and CD68 mRNA expression (E) in EAT of WT and SK1−/− mice; n = 10 ± SD. F and G: FACS analysis of CD11b+/CD11c+ macrophages in EAT SVF from DIO WT and SK1−/− mice. SVFs from 2 or 3 mice were typically pooled; n = 3. H: relative SK1 mRNA in adipocytes and macrophages from EAT of WT DIO mice. SK1/S1P signaling contributes to adipose macrophage inflammation. I–L: TNFα (I), IL-6 (J), MCP-1 (K), and IL-10 (L) mRNA levels in CD11c+ macrophages isolated from EAT of WT and SK1−/− mice fed a HFD for 16 wk. For H–J, n = 5 ± SD. *P < 0.05, **P < 0.01, and ***P < 0.001, WT vs. SK1−/−.
Although ATMs were lower in SK1-null mice compared with their WT counterparts, whether SK1/S1P signaling contributes to its proinflammatory phenotype remains to be determined. This is potentially important since SK1 is expressed in monocytes and macrophages (34) and is also expressed in adipose tissue-derived M1 macrophages; however, its relative expression is modestly but insignificantly lower than in adipocytes (Fig. 8H). To determine the inflammatory phenotype in this population of macrophages, we analyzed expression of cytokine genes in the CD11c+ cell population isolated from adipose SVF from WT and SK1−/− mice. SK1-deficient CD11c+ cells expressed lower levels of TNFα and IL-6 mRNA and higher levels of IL-10 mRNA than cells from WT mice (Fig. 8, I, J, and L). MCP-1 mRNA levels were similar in CD11c+ macrophages from WT and SK1−/− mice (Fig. 8K). These results suggest that loss of SK1 induces an anti-inflammatory macrophage phenotype associated with protection from insulin resistance.
Pharmacological inhibition of SK1 reduces adipose inflammation and improves glucose homeostasis in DIO mice.
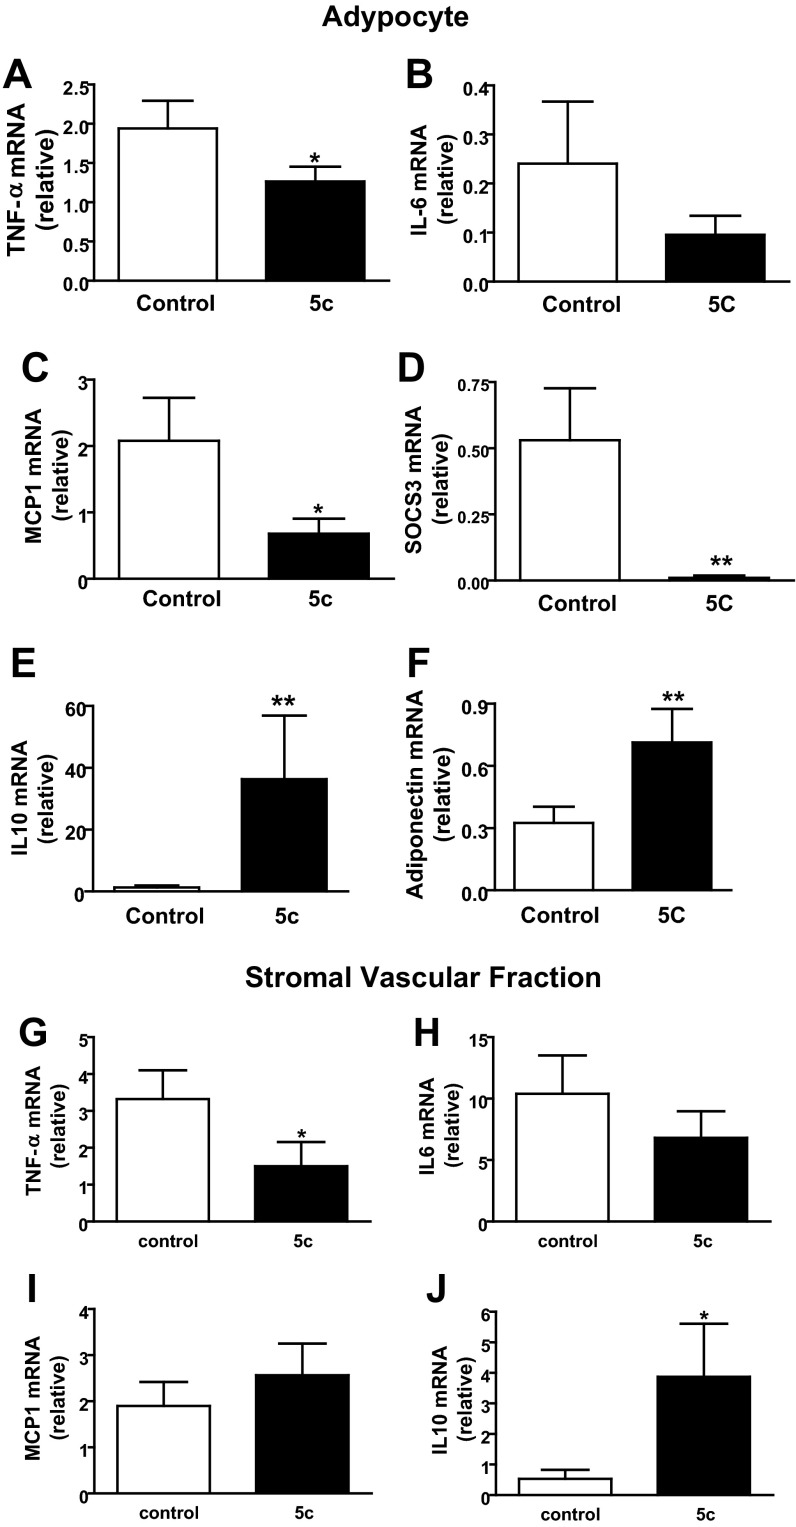
To evaluate the potential of SK1 as a therapeutic target to improve glucose homeostasis, we treated mice with 5c, a small-molecule inhibitor of SK1 with documented effects in vivo (34). 5c is specific for the SK1 isoform, does not inhibit SK2 or PKC, and shows no cytotoxicity at effective doses (30, 34). Inhibition of SK1 with 5c ameliorates endotoxin-induced proinflammatory cytokine production by phagocytes and protects mice from endotoxin shock (34). DIO WT mice were administered 5c (2 mg/kg ip) or vehicle once daily for 3 days (34), and glucose homeostasis was evaluated. This treatment regimen with 5c significantly improved glucose tolerance and insulin resistance (Fig. 9, A and B) and lowered fasting blood glucose levels (Fig. 9C) but had no effect on plasma FFA or triglyceride levels (not shown). In response to 5c treatment, insulin-mediated Akt phosphorylation was increased in adipose, liver, and muscle, although the increase in muscle did not reach significance (Fig. 9, D–F). These data suggest that acute pharmacological inhibition of SK1 in DIO mice improves systemic glucose homeostasis by increasing insulin-signaling pathways in these primary insulin target tissues. To determine whether these metabolically favorable changes were mechanistically related to decreased adipose inflammation, we analyzed the expression of key inflammatory markers in EAT-derived adipocytes and SVF cells from control and 5c-treated mice. In adipocytes, specific inhibition of SK1 reduced TNFα, IL-6, MCP-1, and SOCS3 mRNA levels (Fig. 10, A–D) and concordantly increased IL-10 and adiponectin mRNA levels (Fig. 10, E and F). In the SVF cells, which include ATM, SK1 inhibition suppressed TNFα and insignificantly reduced IL-6 transcription (Fig. 10, G and H) and increased IL-10 (Fig. 10J) but had no effect on MCP-1 gene expression (Fig. 10I). Collectively, these data show that the transcriptional profile of adipocytes and SVF cells from SK1 inhibitor-treated mice phenocopies that of adipocytes and ATM from SK1−/− mice, providing further support for a critical role for SK1 in obesity-induced adipose inflammatory responses that drive insulin resistance and T2D.
Fig. 9.
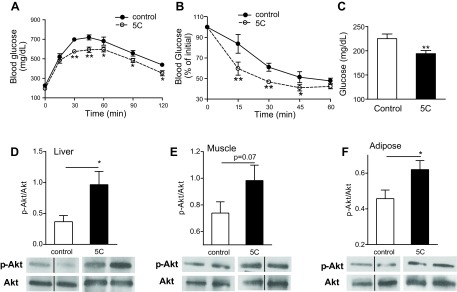
Pharmacological inhibition of SK1 improves insulin sensitivity. GTT (A), ITT (B), and fasting glucose levels (C) in DIO WT mice treated daily for 3 days with specific SK1 inhibitor 5c (2 mg/kg ip) or with vehicle control. Insulin-mediated Akt phosphorylation in liver (D), muscle (E), and EAT (F) of control and 5c-treated DIO mice. The bands of vehicle and 5c-treated DIO WT mice in the Western blot are from the same blot and at the same exposure level. D–F, bottom: same blot stripped and reprobed with anti-Akt. Black line between some of the bands indicates noncontiguous lanes. The separating white space between control and 5c-treated samples denotes membrane splicing for clear presentation; n = 6 ± SD. *P < 0.05 and **P < 0.01, 5c vs. control.
Fig. 10.
Pharmacological inhibition of SK1 ameliorates inflammatory responses in adipocytes and adipose SVF cells. TNFα (A), IL-6 (B), MCP-1 (C), SOCS3 (D), IL-10 (E), and adiponectin (F) mRNA levels in adipocytes isolated from EAT of DIO mice treated daily for 3 days with the specific SK1 inhibitor 5c (2 mg/kg ip) or with vehicle control. TNFα (G), IL-6 (H), MCP-1 (I), and IL-10 (J) mRNA levels in SVF cells from control and 5c-treated mice as above; n = 6 ± SD. *P < 0.05 and **P < 0.01, 5c vs. control.
DISCUSSION
This study establishes a role for SK1 in obesity-mediated adipose dysfunction and insulin resistance. We found that genetic disruption of the SK1/S1P signaling pathway decreased adipocyte proinflammatory and chemotactic signals, attenuated ATM accumulation and inflammation, increased adipogenesis, decreased steatosis, and contributed to improved systemic insulin sensitivity. Similarly, pharmacological inhibition of SK1 in DIO WT mice shifted the adipose tissue milieu from proinflammatory to anti-inflammatory, resulting in upregulation of IL-10 and adiponectin, enhanced insulin sensitivity, and improved glucose homeostasis.
SK1 and S1P are increased in adipose tissues of DIO mice. Our finding that SK1 mRNA is also increased in adipose tissues from obese T2D patients is clinically relevant and consistent with studies showing increased adipose S1P in obese humans (6) and high SK1 activity in humans with abnormally higher levels of adipose tissue inflammation and liver fat (21). Plasma S1P is also reported to be higher in obese T2D subjects (12). Compared with WT DIO mice, SK1-deficient DIO mice accumulated fewer ATM, and their adipocytes produced lower levels of TNFα, IL-6, MCP-1, and SOCS3 and higher levels of IL-10 and adiponectin. Moreover, specific pharmacological inhibition of SK1 in WT DIO mice increased IL-10 and adiponectin levels and decreased SOCS3. These cytokine responses are well-documented mechanisms that improve insulin sensitivity and overall glucose homeostasis (28, 29). Our findings that adipocyte and macrophage inflammatory responses are reduced in HFD-fed SK1−/− mice complement a growing body of literature implicating SK1/S1P signaling in inflammation, immune cell function, and disease (25, 41). The SK1-S1P axis contributes to Toll-like receptor 4 signaling (31, 41) and promotes activation of IKK and NF-κB (33, 41), responses that can directly inhibit insulin signaling (29). Our observation that ATM accumulation is reduced in DIO SK1−/− mice is consistent with decreased levels of MCP-1 in SK1−/− mice and established roles of SK1/S1P in trafficking and migration of numerous immune cells, including macrophages (13). Contribution of S1P to macrophage recruitment has been demonstrated in systems where apoptotic cells upregulate SK1 and secrete S1P, which directly attracts macrophages (13). Indeed, macrophages are found in CLS around hypertrophic and apoptotic adipocytes in obese mice and humans (10).
The insulin-sensitive phenotype of the HFD-fed SK1−/− mice, despite increased adiposity, is consistent with numerous studies indicating that overall adipose function and not adiposity per se contributes to metabolic dysfunction. For example, overexpression of adiponectin in obese mice led to adipose tissue expansion without inflammation and maintained insulin sensitivity despite profound obesity (20). Both obese mice deficient in macrophage galactose-type C-type lectin 1 (48) and mice with adipocyte-specific deletion of the nuclear corepressor NCoR (23) were protected from glucose intolerance, insulin resistance, and steatosis despite having more visceral fat. We found that increased adiposity in HFD-fed SK1−/− mice was related to increased adipogenesis, suggesting that adipose SK1/S1P signaling may be a pathological signal that limits adipogenesis and during weight gain. These results are consistent with data indicating that the S1P analog FTY720 inhibits the differentiation of 3T3-L1 preadipocytes (27) but contrast with a study using siRNA-mediated SK1 knockdown in 3T3-L1 adipocytes, which concluded that SK1 enhances adipogenesis (15). Our in vivo studies using primary adipocytes may better reflect the contribution of SK1/S1P to adipogenesis than cell lines in vitro. The mechanism of increased adipogenesis in our SK1−/− mice may be related to decreased phosphorylation of PPARγ on Ser112, which inhibits ligand binding by PPARγ and reduces its ability to promote adipogenesis (11).
Ceramide, which lies upstream of S1P, not only inhibits insulin signaling but also contributes to obesity via effects on energy expenditure and metabolism (17, 37). In contrast, the SK1-S1P signaling axis does not drive overall obesity per se, but plays a significant role in adipose inflammation leading to insulin resistance. In rat adipocytes, S1P increases lipolysis and suppresses insulin-induced leptin secretion, consistent with a role in promoting insulin resistance (18). However, Ma et al. (24) showed that adenoviral-mediated expression of human SK1 in KK/Ay T2D diabetic mice (Ad-SPHK1) reduced blood glucose levels and improved insulin sensitivity. In this instance, the effect of SK1 gene delivery on the tissue distribution of ceramide in these mice was not reported. SK1-derived S1P can negatively regulate ceramide levels in some systems (22, 26). Thus, increases in SK-1/S1P in Ad-SPHK1 mice could decrease levels of total ceramide or specific ceramide subspecies, which would explain the improved insulin sensitivity observed in this model. Consistent with this possibility, HFD-fed SK1 transgenic mice show reduced muscle insulin resistance associated with decreased levels of muscle ceramide but no change in S1P (8). Treating HFD-fed mice with the S1P analog FTY720 reduced muscle ceramide and improved glucose tolerance (9). In both of the above instances, the specific decrease in ceramide was also associated with reduced obesity. In the DIO SK1−/− mice studied here, decreases in S1P were not associated with changes in plasma or adipose tissue ceramide, suggesting that the improvements in adipose function and glucose homeostasis in this model are due to the decrease in SK1/S1P signaling.
Although mice where SK1 has been genetically deleted have revealed interesting potential actions of the SK1-S1P signaling axis in adipose inflammation and systemic insulin resistance, these may also represent potential secondary indirect effects mediated by downregulation of SK1/S1P in other tissues as well, particularly in insulin target tissues such as the liver and the muscle. Moreover, in the adipose tissue itself, the heterogeneity in terms of constituent cell types increases the challenge of determining cell-specific functions of SK1 in this tissue. In this respect, adipose tissue macrophages also express SK1, and proinflammatory gene expression was reduced in adipose CD11c+ macrophages from HFD-fed SK1−/− mice. Thus a role for adipose macrophage SK1/S1P signaling in modulating adipose inflammation also cannot be excluded. Generation of mice in which SK1 is ablated specifically in adipocytes or macrophages is needed to provide direct evidence of the functional significance of cell-specific SK1/S1P signaling to obesity-mediated adipose inflammation and systemic insulin resistance.
S1P signals via five G protein-coupled receptors (S1PR1–5). The effect of S1P on a given cell type is determined by the pattern and level of expression of its receptors, which are coupled to different downstream signaling cascades. Identification of specific S1PRs and downstream signaling pathways that regulate adipogenesis, ATM recruitment, and inflammation is currently being investigated in our laboratory.
In conclusion, our data indicate that the SK1-S1P axis contributes to impaired adipogenesis and adipose inflammation and to insulin resistance. Therefore, inhibition of SK1 merits consideration as a potential therapeutic strategy to treat or reduce insulin resistance, T2D, and the metabolic syndrome.
GRANTS
This study was supported by NIH grants HL-71146 and HL-104232 (F. Samad), a grant from the Diabetes National Research Group (F. Samad), and grants from the Medical Research Service, Department of Veterans Affairs, Veterans Affairs San Diego Healthcare system (R. R. Henry), and the American Diabetes Association (T. P. Ciaraldi and R. R. Henry).
DISCLOSURES
No conflicts of interest, financial or otherwise, are declared by the authors.
AUTHOR CONTRIBUTIONS
J.W., L.B., J.B., T.P.C., and F.S. performed experiments; J.W., L.B., and F.S. analyzed data; J.W., L.B., and F.S. interpreted results of experiments; J.W., L.B., and F.S. prepared figures; J.W., J.B., T.P.C., and F.S. approved final version of manuscript; T.P.C. and F.S. edited and revised manuscript; F.S. conception and design of research; F.S. drafted manuscript.
ACKNOWLEDGMENTS
We thank Dr. Richard Proia (NIH) for proving the SK1−/− mice. We thank Dr. Robert R. Henry (UCSD) for providing the human samples used in the study. We thank A. Samad for the preparation of figures.
REFERENCES
- 1.Armani A, Mammi C, Marzolla V, Calanchini M, Antelmi A, Rosano GM, Fabbri A, Caprio M. Cellular models for understanding adipogenesis, adipose dysfunction, and obesity. J Cell Biochem 110: 564–572, 2010 [DOI] [PubMed] [Google Scholar]
- 2.Badeanlou L, Furlan-Freguia C, Yang G, Ruf W, Samad F. Tissue factor-protease-activated receptor 2 signaling promotes diet-induced obesity and adipose inflammation. Nat Med 17: 1490–1497, 2011 [DOI] [PMC free article] [PubMed] [Google Scholar]
- 3.Baker DA, Barth J, Chang R, Obeid LM, Gilkeson GS. Genetic sphingosine kinase 1 deficiency significantly decreases synovial inflammation and joint erosions in murine TNF-alpha-induced arthritis. J Immunol 185: 2570–2579, 2010 [DOI] [PMC free article] [PubMed] [Google Scholar]
- 4.Bektas M, Allende ML, Lee BG, Chen W, Amar MJ, Remaley AT, Saba JD, Proia RL. Sphingosine 1-phosphate lyase deficiency disrupts lipid homeostasis in liver. J Biol Chem 285: 10880–10889, 2010 [DOI] [PMC free article] [PubMed] [Google Scholar]
- 5.Bielawski J, Szulc ZM, Hannun YA, Bielawska A. Simultaneous quantitative analysis of bioactive sphingolipids by high-performance liquid chromatography-tandem mass spectrometry. Methods 39: 82–91, 2006 [DOI] [PubMed] [Google Scholar]
- 6.Blachnio-Zabielska AU, Koutsari C, Tchkonia T, Jensen MD. Sphingolipid content of human adipose tissue: relationship to adiponectin and insulin resistance. Obesity (Silver Spring) 20: 2341–2347, 2012 [DOI] [PMC free article] [PubMed] [Google Scholar]
- 7.Boon J, Hoy AJ, Stark R, Brown RD, Meex RC, Henstridge DC, Schenk S, Meikle PJ, Horowitz JF, Kingwell BA, Bruce CR, Watt MJ. Ceramides contained in LDL are elevated in type 2 diabetes and promote inflammation and skeletal muscle insulin resistance. Diabetes 62: 401–410, 2013 [DOI] [PMC free article] [PubMed] [Google Scholar]
- 8.Bruce CR, Risis S, Babb JR, Yang C, Kowalski GM, Selathurai A, Lee-Young RS, Weir JM, Yoshioka K, Takuwa Y, Meikle PJ, Pitson SM, Febbraio MA. Overexpression of sphingosine kinase 1 prevents ceramide accumulation and ameliorates muscle insulin resistance in high-fat diet-fed mice. Diabetes 61: 3148–3155, 2012 [DOI] [PMC free article] [PubMed] [Google Scholar]
- 9.Bruce CR, Risis S, Babb JR, Yang C, Lee-Young RS, Henstridge DC, Febbraio MA. The sphingosine-1-phosphate analog FTY720 reduces muscle ceramide content and improves glucose tolerance in high fat-fed male mice. Endocrinology 154: 65–76, 2013 [DOI] [PubMed] [Google Scholar]
- 10.Cinti S, Mitchell G, Barbatelli G, Murano I, Ceresi E, Faloia E, Wang S, Fortier M, Greenberg AS, Obin MS. Adipocyte death defines macrophage localization and function in adipose tissue of obese mice and humans. J Lipid Res 46: 2347–2355, 2005 [DOI] [PubMed] [Google Scholar]
- 11.Farmer SR. Transcriptional control of adipocyte formation. Cell Metab 4: 263–273, 2006 [DOI] [PMC free article] [PubMed] [Google Scholar]
- 12.Gorska M, Dobrzyn A, Baranowski M. Concentrations of sphingosine and sphinganine in plasma of patients with type 2 diabetes. Med Sci Monit 11: CR35–CR38, 2005 [PubMed] [Google Scholar]
- 13.Gude DR, Alvarez SE, Paugh SW, Mitra P, Yu J, Griffiths R, Barbour SE, Milstien S, Spiegel S. Apoptosis induces expression of sphingosine kinase 1 to release sphingosine-1-phosphate as a “come-and-get-me” signal. FASEB J 22: 2629–2638, 2008 [DOI] [PMC free article] [PubMed] [Google Scholar]
- 14.Guilherme A, Virbasius JV, Puri V, Czech MP. Adipocyte dysfunctions linking obesity to insulin resistance and type 2 diabetes. Nat Rev Mol Cell Biol 9: 367–377, 2008 [DOI] [PMC free article] [PubMed] [Google Scholar]
- 15.Hashimoto T, Igarashi J, Kosaka H. Sphingosine kinase is induced in mouse 3T3-L1 cells and promotes adipogenesis. J Lipid Res 50: 602–610, 2009 [DOI] [PMC free article] [PubMed] [Google Scholar]
- 16.Haus JM, Kashyap SR, Kasumov T, Zhang R, Kelly KR, DeFronzo RA, Kirwan JP. Plasma ceramides are elevated in obese subjects with type 2 diabetes and correlate with the severity of insulin resistance. Diabetes 58: 337–343, 2009 [DOI] [PMC free article] [PubMed] [Google Scholar]
- 17.Holland WL, Brozinick JT, Wang LP, Hawkins ED, Sargent KM, Liu Y, Narra K, Hoehn KL, Knotts TA, Siesky A, Nelson DH, Karathanasis SK, Fontenot GK, Birnbaum MJ, Summers SA. Inhibition of ceramide synthesis ameliorates glucocorticoid-, saturated-fat-, and obesity-induced insulin resistance. Cell Metab 5: 167–179, 2007 [DOI] [PubMed] [Google Scholar]
- 18.Jun DJ, Lee JH, Choi BH, Koh TK, Ha DC, Jeong MW, Kim KT. Sphingosine-1-phosphate modulates both lipolysis and leptin production in differentiated rat white adipocytes. Endocrinology 147: 5835–5844, 2006 [DOI] [PubMed] [Google Scholar]
- 19.Kahn SE, Hull RL, Utzschneider KM. Mechanisms linking obesity to insulin resistance and type 2 diabetes. Nature 444: 840–846, 2006 [DOI] [PubMed] [Google Scholar]
- 20.Kim JY, van de Wall E, Laplante M, Azzara A, Trujillo ME, Hofmann SM, Schraw T, Durand JL, Li H, Li G, Jelicks LA, Mehler MF, Hui DY, Deshaies Y, Shulman GI, Schwartz GJ, Scherer PE. Obesity-associated improvements in metabolic profile through expansion of adipose tissue. J Clin Invest 117: 2621–2637, 2007 [DOI] [PMC free article] [PubMed] [Google Scholar]
- 21.Kolak M, Gertow J, Westerbacka J, Summers SA, Liska J, Franco-Cereceda A, Orešič M, Yki-Järvinen H, Eriksson P, Fisher RM. Expression of ceramide-metabolising enzymes in subcutaneous and intra-abdominal human adipose tissue. Lipids Health Dis 11: 115, 2012 [DOI] [PMC free article] [PubMed] [Google Scholar]
- 22.Laviad EL, Albee L, Pankova-Kholmyansky I, Epstein S, Park H, Merrill AH, Jr, Futerman AH. Characterization of ceramide synthase 2: tissue distribution, substrate specificity, and inhibition by sphingosine 1-phosphate. J Biol Chem 283: 5677–5684, 2008 [DOI] [PubMed] [Google Scholar]
- 23.Li P, Fan W, Xu J, Lu M, Yamamoto H, Auwerx J, Sears DD, Talukdar S, Oh D, Chen A, Bandyopadhyay G, Scadeng M, Ofrecio JM, Nalbandian S, Olefsky JM. Adipocyte NCoR knockout decreases PPARgamma phosphorylation and enhances PPARgamma activity and insulin sensitivity. Cell 147: 815–826, 2011 [DOI] [PMC free article] [PubMed] [Google Scholar]
- 24.Ma MM, Chen JL, Wang GG, Wang H, Lu Y, Li JF, Yi J, Yuan YJ, Zhang QW, Mi J, Wang LS, Duan HF, Wu CT. Sphingosine kinase 1 participates in insulin signaling and regulates glucose metabolism and homeostasis in KK/Ay diabetic mice. Diabetologia 50: 891–900, 2007 [DOI] [PubMed] [Google Scholar]
- 25.Maceyka M, Harikumar KB, Milstien S, Spiegel S. Sphingosine-1-phosphate signaling and its role in disease. Trends Cell Biol 22: 50–60, 2012 [DOI] [PMC free article] [PubMed] [Google Scholar]
- 26.Maceyka M, Sankala H, Hait NC, Le Stunff H, Liu H, Toman R, Collier C, Zhang M, Satin LS, Merrill AH, Jr, Milstien S, Spiegel S. SphK1 and SphK2, sphingosine kinase isoenzymes with opposing functions in sphingolipid metabolism. J Biol Chem 280: 37118–37129, 2005 [DOI] [PubMed] [Google Scholar]
- 27.Moon MH, Jeong JK, Lee JH, Park YG, Lee YJ, Seol JW, Park SY. Antiobesity activity of a sphingosine 1-phosphate analogue FTY720 observed in adipocytes and obese mouse model. Exp Mol Med 44: 603–614, 2012 [DOI] [PMC free article] [PubMed] [Google Scholar]
- 28.Olefsky JM, Glass CK. Macrophages, inflammation, and insulin resistance. Annu Rev Physiol 72: 219–246, 2010 [DOI] [PubMed] [Google Scholar]
- 29.Osborn O, Olefsky JM. The cellular and signaling networks linking the immune system and metabolism in disease. Nat Med 18: 363–374, 2012 [DOI] [PubMed] [Google Scholar]
- 30.Paugh SW, Paugh BS, Rahmani M, Kapitonov D, Almenara JA, Kordula T, Milstien S, Adams JK, Zipkin RE, Grant S, Spiegel S. A selective sphingosine kinase 1 inhibitor integrates multiple molecular therapeutic targets in human leukemia. Blood 112: 1382–1391, 2008 [DOI] [PMC free article] [PubMed] [Google Scholar]
- 31.Pchejetski D, Nunes J, Coughlan K, Lall H, Pitson SM, Waxman J, Sumbayev VV. The involvement of sphingosine kinase 1 in LPS-induced Toll-like receptor 4-mediated accumulation of HIF-1alpha protein, activation of ASK1 and production of the pro-inflammatory cytokine IL-6. Immunol Cell Biol 89: 268–274, 2011 [DOI] [PubMed] [Google Scholar]
- 32.Phillips SA, Ciaraldi TP, Kong AP, Bandukwala R, Aroda V, Carter L, Baxi S, Mudaliar SR, Henry RR. Modulation of circulating and adipose tissue adiponectin levels by antidiabetic therapy. Diabetes 52: 667–674, 2003 [DOI] [PubMed] [Google Scholar]
- 33.Price MM, Oskeritzian CA, Falanga YT, Harikumar KB, Allegood JC, Alvarez SE, Conrad D, Ryan JJ, Milstien S, Spiegel S. A specific sphingosine kinase 1 inhibitor attenuates airway hyperresponsiveness and inflammation in a mast cell-dependent murine model of allergic asthma. J Allergy Clin Immunol 131: 501–511, 2013 [DOI] [PMC free article] [PubMed] [Google Scholar]
- 34.Puneet P, Yap CT, Wong L, Lam Y, Koh DR, Moochhala S, Pfeilschifter J, Huwiler A, Melendez AJ. SphK1 regulates proinflammatory responses associated with endotoxin and polymicrobial sepsis. Science 328: 1290–1294, 2010 [DOI] [PubMed] [Google Scholar]
- 35.Samad F, Badeanlou L, Shah C, Yang G. Adipose tissue and ceramide biosynthesis in the pathogenesis of obesity. Adv Exp Med Biol 721: 67–86, 2011 [DOI] [PubMed] [Google Scholar]
- 36.Samad F, Hester KD, Yang G, Hannun YA, Bielawski J. Altered adipose and plasma sphingolipid metabolism in obesity: a potential mechanism for cardiovascular and metabolic risk. Diabetes 55: 2579–2587, 2006 [DOI] [PubMed] [Google Scholar]
- 37.Samad FB, Shah C, Yang G. Adipose tissue and ceramide biosynthesis in the pathogenesis of obesity. In: Sphingolipids and Metabolic Disease, edited by Cowart A. New York: Springer Science and Business Media, Landes Bioscience, 2010 [Google Scholar]
- 38.Shah C, Yang G, Lee I, Bielawski J, Hannun YA, Samad F. Protection from high fat diet-induced increase in ceramide in mice lacking plasminogen activator inhibitor 1. J Biol Chem 283: 13538–13548, 2008 [DOI] [PMC free article] [PubMed] [Google Scholar]
- 39.Shi H, Cave B, Inouye K, Bjørbaek C, Flier JS. Overexpression of suppressor of cytokine signaling 3 in adipose tissue causes local but not systemic insulin resistance. Diabetes 55: 699–707, 2006 [DOI] [PubMed] [Google Scholar]
- 40.Shi H, Tzameli I, Bjørbaek C, Flier JS. Suppressor of cytokine signaling 3 is a physiological regulator of adipocyte insulin signaling. J Biol Chem 279: 34733–34740, 2004 [DOI] [PubMed] [Google Scholar]
- 41.Spiegel S, Milstien S. The outs and the ins of sphingosine-1-phosphate in immunity. Nat Rev Immunol 11: 403–415, 2011 [DOI] [PMC free article] [PubMed] [Google Scholar]
- 42.Taha TA, Hannun YA, Obeid LM. Sphingosine kinase: biochemical and cellular regulation and role in disease. J Biochem Mol Biol 39: 113–131, 2006 [DOI] [PubMed] [Google Scholar]
- 43.Turner N, Kowalski GM, Leslie SJ, Risis S, Yang C, Lee-Young RS, Babb JR, Meikle PJ, Lancaster GI, Henstridge DC, White PJ, Kraegen EW, Marette A, Cooney GJ, Febbraio MA, Bruce CR. Distinct patterns of tissue-specific lipid accumulation during the induction of insulin resistance in mice by high-fat feeding. Diabetologia 56: 1638–1648, 2013 [DOI] [PubMed] [Google Scholar]
- 44.Unger RH, Scherer PE. Gluttony, sloth and the metabolic syndrome: a roadmap to lipotoxicity. Trends Endocrinol Metab 21: 345–352, 2010 [DOI] [PMC free article] [PubMed] [Google Scholar]
- 45.van Tienen FH, van der Kallen CJ, Lindsey PJ, Wanders RJ, van Greevenbroek MM, Smeets HJ. Preadipocytes of type 2 diabetes subjects display an intrinsic gene expression profile of decreased differentiation capacity. Int J Obes (Lond) 35: 1154–1164, 2011 [DOI] [PubMed] [Google Scholar]
- 46.van Beekum O, Fleskens V, Kalkhoven E. Posttranslational modifications of PPAR-gamma: fine-tuning the metabolic master regulator. Obesity (Silver Spring) 17: 213–219, 2009 [DOI] [PubMed] [Google Scholar]
- 47.Wang MY, Grayburn P, Chen S, Ravazzola M, Orci L, Unger RH. Adipogenic capacity and the susceptibility to type 2 diabetes and metabolic syndrome. Proc Natl Acad Sci USA 105: 6139–6144, 2008 [DOI] [PMC free article] [PubMed] [Google Scholar]
- 48.Westcott DJ, Delproposto JB, Geletka LM, Wang T, Singer K, Saltiel AR, Lumeng CN. MGL1 promotes adipose tissue inflammation and insulin resistance by regulating 7/4hi monocytes in obesity. J Exp Med 206: 3143–3156, 2009 [DOI] [PMC free article] [PubMed] [Google Scholar]
- 49.Yang G, Badeanlou L, Bielawski J, Roberts AJ, Hannun YA, Samad F. Central role of ceramide biosynthesis in body weight regulation, energy metabolism, and the metabolic syndrome. Am J Physiol Endocrinol Metab 297: E211–E224, 2009 [DOI] [PMC free article] [PubMed] [Google Scholar]


