

Abstract
Purpose
Alveolar soft part sarcoma (ASPS) is a soft tissue sarcoma with poor prognosis, and little molecular evidence for its origin, initiation and progression. The aim of this study was to elucidate candidate molecular pathways involved in tumor pathogenesis.
Experimental Design
We employed high-throughput array comparative genomic hybridization and cDNA-Mediated Annealing, Selection, Ligation, and Extension Assay to profile the genomic and expression signatures of primary and metastatic ASPS from 17 tumors derived from 11 patients. We used an integrative bioinformatics approach to elucidate the molecular pathways associated with ASPS progression. Fluorescence in situ hybridization was performed to validate the presence of the t(X;17)(p11.2;q25) ASPL-TFE3 fusion and hence confirm the aCGH observations.
Results
FISH analysis identified the ASPL-TFE3 fusion in all cases. ArrayCGH revealed a higher number of numerical aberrations in metastatic tumors relative to primaries, but failed to identify consistent alterations in either group. Gene expression analysis highlighted 1,063 genes which were differentially expressed between the two groups. Gene set enrichment analysis identified 16 enriched gene sets (p < 0.1) associated with differentially expressed genes. Notable among these were several stem cell gene expression signatures and pathways related to differentiation. In particular, the paired box transcription factor PAX6 was up-regulated in the primary tumors, along with several genes whose mouse orthologs have previously been implicated in Pax6-DNA binding during neural stem cell differentiation.
Conclusion
In addition to suggesting a tentative neural line of differentiation for ASPS, these results implicate transcriptional deregulation from fusion genes in the pathogenesis of ASPS.
Keywords: ASPS, ASPL-TFE3, aCGH, DASL, PAX6
INTRODUCTION
Alveolar soft-part sarcoma (ASPS) is a rare mesenchymal tumor of uncertain histogenesis. The tumor occurs primarily in adolescent and young adults with a female predilection, and accounts for 0.4–1% of all soft tissue sarcomas (1). Commonly the tumor involves the deep soft tissues of the extremities, buttocks, abdominal or thoracic wall in adults, and the head and neck region in children. ASPS has also been reported in tissues where skeletal muscle is not usually found, such as the stomach, pituitary gland, sacral bone, breast, lung, retroperitoneum, and female genital tract (1–3). ASPS is a malignant tumor with a slow, indolent clinical course, with survival rates of 77% at 2 years, 60% at 5 years, 35% at 10 years and only 15% at 20 years (1). It is not particularly responsive to adjuvant chemotherapy, although there may be some role for adjuvant radiotherapy in reducing the risk of local recurrence (1). Vascular invasion is common with subsequent hematogenous metastases to lung and brain, and although prolonged survival is possible in such patients, the longer term disease-specific mortality is high. Whilst tumor size has been correlated to the survival in the past (4), no specific clinical or histopathological features exist currently that are reliably predictive of disease course in ASPS.
Since its description by Christopherson in 1952, the histogenesis of ASPS has remained controversial. Histologically, ASPS exhibits variable architecture ranging from alveolar to solid patterns composed of nonspecific, uniform round cells with central nuclei, diastase periodic acid Schiff (DPAS)-positive granular cytoplasmic crystals, and characteristic rectangular/ rhomboid cytoplasmic crystals seen with the electron microscope. Based on the morphology, this entity has been designated in the past as both malignant organoid granular cell myoblastoma and malignant nonchromaffin paraganglioma, inferring myogenic and neurogenic differentiation, respectively.
The current singular defining molecular feature of ASPS is the non-reciprocal translocation t(X;17)(p11;q25), resulting in the fusion of the nuclear transcription factor gene TFE3 to the ASPL gene (5). Whilst this translocation is not specific to ASPS (occurring in a subset of renal cell carcinoma) (6), it is consistently and uniformly present in all ASPS cases. In this study, we employed high-throughput technology to profile the genomic and gene expression signatures of primary and metastatic ASPS. Moreover, we used an integrative bioinformatics approach to elucidate the molecular pathways associated with the progression of ASPS.
MATERIALS AND METHODS
Case Selection
Paraffin blocks from surgical specimens covering a 13-year period (1994–2007) were obtained from the archives of Massachusetts General Hospital (MGH), Brigham and Women’s Hospital (BWH) and Boston Children’s Hospital (BCH) in accordance with the regulations for excess tissue use stipulated by the institution review board at each hospital. Altogether, seventeen tumors from 11 patients were used for this study. Archival material corresponding to both the primary tumor sites as well as from metastases or re-excisions was available for 4 of the cases. All cases were fixed in 10% neutral-buffered formalin and routinely embedded in paraffin. Pertinent clinical data are summarized in Table 1. Diagnosis was confirmed by retrospective review of hematoxylin and eosin (H&E) stained sections by study pathologist EC. World Health Organization diagnostic criteria were used for assigning histopathology diagnoses (7). Where necessary, PAS staining, TFE3 immunohistochemistry, and electron microscopy were utilized as ancillary aids to diagnosis (Figure 1).
Table 1.
Summary of clinical features in ASPS study cohort
| Patient/Site | Age/Sex | Outcome | Survival | Treatment | Diagnosis | FISH# | aCGH alterations |
|---|---|---|---|---|---|---|---|
| 1MT(lung) | 30F | Dead | 84 | Systemic chemotherapy | TFE3 + | NA | None observed |
| 2MT(lung) | 36M | Awd | 132 | Clinical Trial: Gleevec | EM, DPAS+ | 46%; multiple fusion signals | loss of 1 chrX; breakpoint at Xp11.2 (gain to pter); loss at 17q25; loss of 8p, 17p; loss of chr1 (slight shift); chr12 gain |
| 3MT(adrenal) | 41F | Dead | 72 | None | EM | 22% | NA |
| 4MT(lung) | 27M | Lost to fu | 72 | Systemic chemotherapy | TFE3+ | 20% | loss of 1 chrX; breakpoint at Xp11.2 (gain to pter); copy loss of 19q & 22q |
| 5MT(pancreas) | 47M | Awd | 156 | None | TFE3 + | 72% | loss of 1 chrX; breakpoint at Xp11.2 (gain to pter); loss of 17q25 band; loss of 1p & 18p |
| 6P(thigh)* | 29M | Dead | 60 | None | EM | 17% | loss of 1 chrX; breakpoint at Xp11.2 (gain to pter); no additional alterations |
| 6MT1(colon)* | None | TFE3 + | 66% | loss of 1 chrX; breakpoint at Xp11.2 (gain to pter); no additional alterations | |||
| 6MT2(abdomen)* | TFE3 + | 20% | loss of 1 chrX; breakpoint at Xp11.2 not identified; no additional alterations | ||||
| 7P(retro-orbital)* | 27M | Awd | 60 | None | Morphology∞ | NA | NA |
| 7MT(brain)* | None | TFE3 + | NA | 1 copy loss of 10q & 22q; BRUNOL4 loss (18q12.2); breakpoint at Xp11.2 (gain to pter) | |||
| 8MT(brain) | 28M | Dead | 16 | Systemic chemotherapy | Morphology∞ | NA | NA |
| 9P(thigh)* | 28F | Dead | 36 | None | EM | 80% | Multiple alterations |
| 9MT(brain)* | Radiotherapy | Morphology∞ | 48% | None observed | |||
| 10P(back) | 20M | Ned | 24 | None | DPAS+ | 80% | 1 copy loss of 21q; loss of 1 chrX; breakpoint at Xp11.2 (gain to pter) |
| 11MT1(intestine)* | 27F | Awd | 168 | Intestinal chemotherapy | EM | 56% | Breakpoint at Xp11.2 not identified; multiple alterations |
| 11MT2(femur)* | Radiotherapy | Morphology∞ | NA | NA | |||
| 12P(buttock) | 26F | Awd | 72 | None | EM | 46% | Breakpoint at Xp11.2; no additional alterations |
| 13P(neck) | 47F | Awd | 96 | None | EM | 35%; multiple fusion signals | 11 alterations; breakpoint at Xp11.2 BUT loss from TFE3 to pter & breakpoint is downstream of TFE3 |
Key:
Paired samples;
Similar to primary tumor;
Percentage of tumor nuclei with fusion
P = Primary, MT = metastases, M = Male, F = Female, Awd = Alive with disease, Ned = No evidence of disease, EM = Electron Microscopy, chr = chromosome
Figure 1. Case of ASPS.
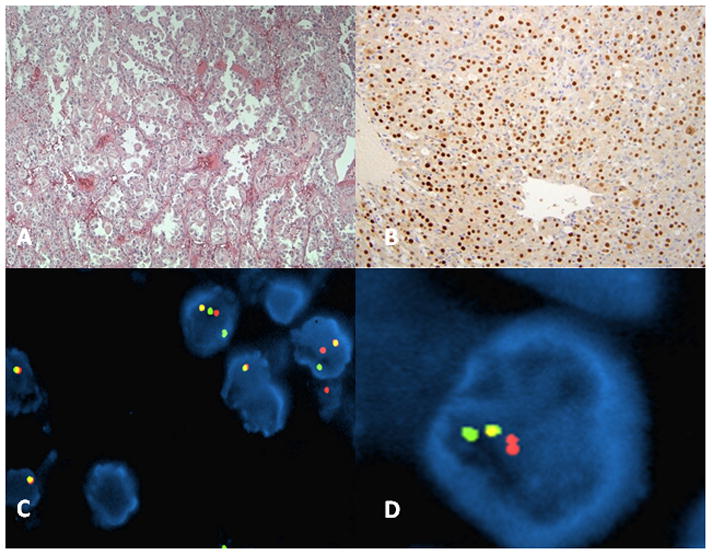
A. Haematoxylin and Eosin (x10) of tumor highlighting the alveolar to solid pattern B. Positive nuclear TFE3 immunohistochemistry (x40). C–D. Interphase FISH with BAC-based probes harboring TFE3 and ASPL on a male patient with ASPS.
Immunohistochemistry
We used the P-16 polyclonal antibody to TFE3 (Santa Cruz# sc-5958; Santa Cruz Biotechnology, Santa Cruz, CA, USA) which binds to the C-terminal portion of the TFE3 protein downstream of the region encoded by exon 6 to help confirm the diagnosis of ASPS (6). Representative 5-μm FFPE sections from each case were mounted onto positively charged slides, and subsequently processed for immunohistochemical staining using a standard protocol. Briefly, the sections were deparaffinized in xylene, rehydrated using graded ethanol concentrations, and then subjected to antigen retrieval by boiling in citrate buffer at pH 6.0 for 10 minutes. Following quenching with peroxidase and blocking with avidin, sections were incubated overnight with a 1:500 dilution of the polyclonal antibody to TFE3 in phosphate buffered saline (PBS). Detection of antibody binding was achieved using a biotinylated secondary antibody and horseradish peroxidase-conjugated streptavidin (Dako, Carpinteria, CA, USA) and 3,3,5,5′-diaminobenzidine as chromogen.
Fluorescence in situ hybridization
Loci corresponding to the TFE3 and ASPL genes were visualized by dual color, single fusion fluorescence in situ hybridization (FISH) design. Fluorescent probes were generated by nick translation of BAC clones RP11-634L102 (labeled SpectrumOrange) and CTD-2311N12 (SpectrumGreen) BACs (obtained from CHORI; www.chori.org), which map to 17q25 and Xp11.2, respectively. RP11-634L102 includes almost the entire ASPL gene, while the latter includes the entire TFE3 locus (Supplementary Figure 1).
Four-micrometer FFPE sections were mounted on standard glass slides and baked at 60°C overnight. Following deparaffinization in xylene, the sections were dehydrated in ethanol and air dried. The sections were subsequently treated in 1M sodium isothiocyanate in 2x SSC for 20 min at 75°C, and rinsed in 2x SSC for 5 min at room temperature, prior to digestion in 0.25 mg/mL proteinase K (Roche) in 2x sodium chloride sodium citrate (SSC) at 45°C for 20 min. The slides were rinsed in 2xSSC, then dehydrated in ethanol series and air dried. The probe and target DNA (tissue sections) were co-denatured at 80°C for 10 min (Hybrite; Abbott Molecular Inc), and allowed to hybridize for 16 hours at 37°C. Post-hybridization washes were carried out in 2XSSC at 70°C for 10 minutes, then at room temperature for 5 min. The sections were counterstained with 4′,6-diamidino-2-phenylindole (DAPI; Abbott Molecular Inc), and signals visualized on Olympus BX51 fluorescence microscope (Olympus, Center Valley, PA). Individual images were captured using an Applied Imaging system running Cyto-Vision Genus version 3.9 (Applied Imaging, Grand Rapids, MI).
Tumor regions were identified on each section by a pathologist (EC & RF) from corresponding H&E sections of the FFPE block. Analysis was limited to the intact, non-truncated and non-overlapping tumor cell nuclei. A total of 50 nuclei per section were sampled from 2 separate regions and FISH signals were scored for the number of TFE3 (green), ASPL (red) and fusion signals in each nucleus. Signals were deemed to be fused when the red and the green signals were separated by less than 3 signal diameters. The FISH criteria used to evaluate the ASPL-TFE3 rearrangement were as follows: (1) in female patients, visualization of 2 green TFE3 (another normal Xp11 signal) and 1 red ASPL separate signals in addition to a fusion signal; (2) in male patients, visualization of 1 green and 1 red ASPL signal in addition to a fusion signal (Figure 1 and Supplementary Figure 1).
Oligonucleotide human genome 500k array CGH
Normal female genomic DNA was obtained from Promega (Madison, WI). Genomic DNA was extracted from 15 samples of ASPS tumors (5 primary, 10 metastases) using QIAamp DNA FFPE Tissue Kit (Qiagen, Valencia, CA). The Genomic DNA ULS labeling kit for FFPE Samples (Agilent) was used to chemically label 1 μg of genomic DNA with either ULS-Cy5 (tumor) or ULS-Cy3 dye (normal/reference DNA) according to the manufacturer’s protocol (Agilent Technologies, Inc., Palo Alto, CA). Equimolar mixture of labeled normal and tumor DNA was applied to the Agilent Human Genome CGH 2×400k Microarray, which features 411,056 in situ synthesized 60-mer oligonucleotide probes that span coding and noncoding sequences with an average spatial resolution of 5.3kb. Hybridization was carried out at 65°C for 40 hours, in a rotating oven at 20 rpm. The arrays were washed according to the manufacturer’s protocol, then scanned using an Agilent DNA microarray scanner. CGH Analytics software version 3.4 (Agilent Technologies, CA) was used to analyze the aCGH data.
The data quality of each microarray was assessed using the Quality Metrics report generated by the Agilent CGH analytics software (v.3.4). Copy number aberrations were detected using the Aberration Detection Method (ADM-1) algorithm, based on computing significance scores for all genomic intervals. Aberrations were assigned as either gain (ratio ≥ 0.5), loss (≤ −1.0) or amplification (≥ 2.0). A contiguous change of imbalance level within a chromosome was considered to be indicative of an unbalanced translocation event. For this study, the threshold was optimized to a value of 6.0 to reduce inherent sample noise contribution in the analysis, without negating true consistent imbalances along each chromosome. Only aberrations spanning a minimum of 10 consecutive oligonucleotide probes were marked as significant, so that only imbalances spanning greater than ~50 kb will be included. Further details concerning these principles are available at the Agilent website (www.agilent.com/chem/goCGH). Array data has been published in compliance with MIAME 2.0 guidelines and deposited in the publicly available NCBI GEO database (GSE49327).
cDNA-Mediated Annealing, Selection, Ligation, and Extension Assay
Thirteen cases were amenable to global gene expression analysis (five primary tumors and nine metastases). Two samples were matched primary and metastatic tumors; two were paired cases of metastatic lesions from different sites. For each sample, H&E sections were viewed by a pathologist (RF) to ensure at least 80% tumor content. Five consecutive 20 μm sections were collected for analysis. Total RNA was extracted, cleaned up, and eluted using the RNeasy MiniKit and RNeasy MinElute Cleanup Kit, respectively (Qiagen), according to the manufacturer’s protocol. The total RNA yield per sample ranged from 191ng to 2ug. cDNA-mediated annealing, selection, ligation, and extension (DASL) expression assay (Illumina) was performed as per manufacturer’s instructions on a panel comprising 24,526 probes for a total of 18,631 genes (Human Ref-8 Expression; BeadChip).
Data was quantile-normalized and a 2-sample t-test was used to detect differential expression of every gene across 5 primary and 8 metastatic sarcomas using Broad Institute’s GenePattern platform. We obtained gene sets representing key biological processes from Gene Ontology (GO), disease pathways from Molecular Signature Database (MSigDB) and gene expression signatures from the literature from GenesigDB were used for geneset enrichment analysis. The enrichment of each geneset among the top DE genes was tested with 2-sided hypergeometric test in R. Finally we used the Ingenuity Pathway Analysis tool to construct a network of direct and indirect interactions among the differentially expressed genes that contain Pax6 specific putative regulatory binding sites in their promoter regions.
Clinicopathological Correlation
We examined whether the presence of simple or complex chromosomal abnormalities were associated with clinicopathological features of the ASPS samples (simple chromosomal abnormalities was defined as the presence of 2 or less gross abnormalities including the breakpoint at Xp11.2). Two by two group comparison was performed using the Fischer Exact test. In addition, we examined whether the presence of simple or complex chromosomal abnormalities were associated with patient survival. Kaplan-Meier survival analysis was performed using the log-rank test. Statistical analysis was performed with both Analyse-It™ Software Ltd and MedCalc™ Software Ltd.
RESULTS
Differential Gene Expression Analysis and Pathway Analysis
Based on t-test for differential gene expression across primary and metastatic sarcomas, 1,063 genes were found to be significant at the nominal p-value level of 0.05 of which 323 genes with t-test score greater than 3 were most differentially expressed (DE); full set of data may be downloaded at NCBI GEO (GSE49327). Among these top DE genes, 207 were up-regulated in primary and 116 in metastases. The differential expression heat map is shown in Figure 2. Gene set enrichment analysis identified 16 gene-sets as enriched (p-value less than 0.1) both among genes that are up-regulated in primary and metastatic sarcomas (Supplementary Figure 2). We observed that several stem cell gene expression signatures and pathways related to differentiation are enriched among the top DE genes (Figure 3 and Supplementary Figure 2). In particular, we noted distinct up-regulation of the paired box transcription factor Pax-6 and Pax-6 target genes in primary sarcomas (Figures 3 and 4). Interestingly, one of the targets, the LIM/homeobox protein Lhx6, is an important transcription regulator that is known to control differentiation and development of neural cells (8). By observing the known direct and indirect interactions among the DE genes which have putative binding sites in their promoters, we noted interesting subnetworks of hub nodes and GeneGO processes. Moreover, indirect connections between TFE3 and Pax6 via genes involved in TGF-β signaling pathway could be inferred (Supplementary Figure 3).
Figure 2. Top 323 differentially expressed (DE) genes.

The heatmap depicts the expression of genes with t-test score greater than 3. Each row represents a gene. The samples (in columns) are grouped as 5 primary (green labels) and 8 metastatic (gold labels) sarcomas. Red and blue entries in the heatmap indicate high and low gene expressions respectively. The black horizontal line separates the genes up-regulated in primary sarcomas (above the line) from those up-regulated in metastases.
Figure 3. Gene Set Enrichment Anaylsis for all top differentially expressed genes.

Each column represents a geneset that is either a key biological process/ pathway/ gene signature from the literature that is enriched among the top 323 DE genes. Each horizontal orange bar represents one of the top DE genes depicted in the sorted order t test score. The black horizontal line separates the genes up-regulated in primary sarcomas (above the line) from those up-regulated in metastases. The occurrence of Pax6, as a stem cell transcription factor, is marked with a green arrow and the distribution of its targets among the DE genes according to mouse ChIP studies [Sansom et al.] is shown with green marks beside the plot.
Figure 4. Differential Expression of Pax-6 Targets.
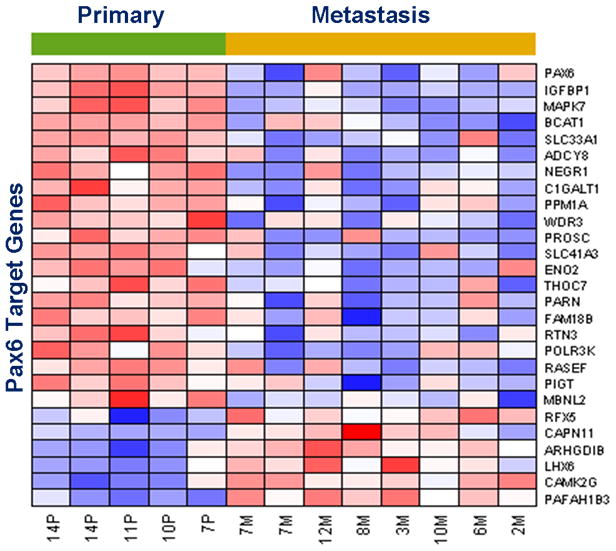
The heatmap depicts the top DE genes (in rows) whose mouse orthologs show Pax-6 binding with DNA in ChIP studies [ Sansom et al.] in the process of neural stem cell differentiation in the developing mouse cerebral cortex. The samples (in columns) are grouped as primary (green labels) and metastatic (gold labels) sarcomas. Red and blue rectangles indicate high and low gene expressions respectively. The expression of the paired box transcription factor Pax6 is shown in the topmost row.
Oligonucleotide human genome 500k array CGH
Genomic aberrations in ASPS were analyzed using the Agilent 2×500k high-resolution aCGH platform with protocols optimized for FFPE tumor material (9). As expected from the unbalanced rearrangement involving the X chromosome, the most frequent genomic aberration detected was a large segmental gain on Xp with the breakpoint localizing at TFE3 and extending telomeric to it (10/14 cases; Table 1 and Figure 5). Genomic loss at 17q25 was also observed frequently, although the amplitude of the alteration showed variation between samples. The only shared alteration that was observed in two metastatic samples was a 1 copy loss of chromosome 22. A few samples displayed multiple aberrations, such as sample 2M, which is a metastatic tumor sample from the lungs of a patient being treated with the kinase inhibitor, Gleevec. This patient was a male, and as expected, the chromosome X profile showed a relative loss from Xp11.2 to Xqter, and gain of sequences from Xp11.2 to Xpter that one would expect in a fusion-positive sample. We also observed multiple fusion signals in addition to numerous whole chromosomal as well as whole-arm imbalances in this sample, such as loss of 8p and 17p, and gain of entire chromosomes 12 and 14. Sample 14P, which is a primary tumor excised from the neck of a female patient, showed an atypical genomic profile for chromosome X. Instead of showing the characteristic gain from the TFE3 locus to pter, we actually observed the opposite, which was a large segmental loss of the p-arm from TFE3 to pter. Not only did this sample show multiple fusion signals with FISH analysis, but like sample 2M, also had a segmental loss on chromosome 17 from 17p12 to pter, among numerous other alterations. Otherwise we did not observe any consistent genomic imbalances when comparing primary and metastatic tumors, and no high-level amplifications were found in any of the tumors.
Figure 5. Composite analysis of the break at Xp11.23 and subsequent imbalance in 3 primary and 4 metastatic tumors.
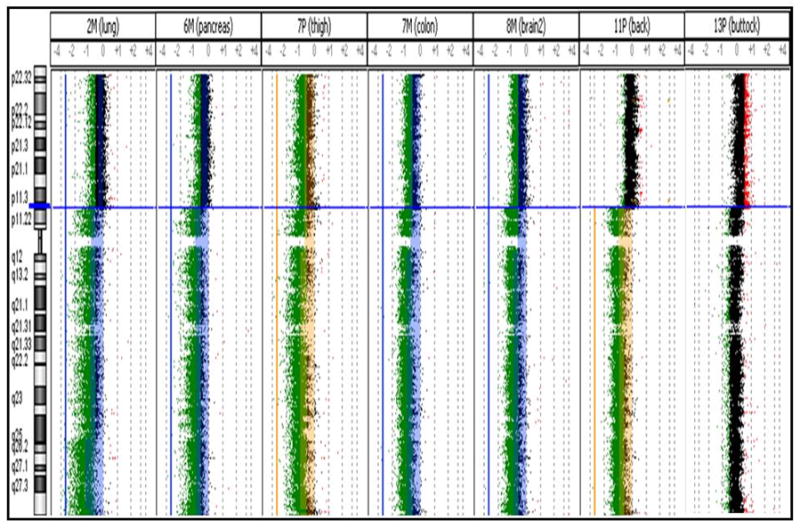
Blue horizontal line represents the location of the break at TFE3. Aberrations above the ADM-1 threshold of 10.0 are represented by the colored regions deviating to the left (relative loss to control) or right (relative loss to control). Imbalances in the primary and metastatic tumors are color coded as yellow and blue, respectively.
Fluorescence in situ hybridization
Dual color, single fusion fluorescence in situ hybridization (FISH) was performed on four micron tissue sections to validate the presence of the t(X;17)(p11.2;q25) ASPL-TFE3 fusion and hence to confirm the aCGH observations. For each sample, a total of 50 interphase nuclei were analyzed using the RP11-634L102 (SpectrumOrange) and CTD-2311N12 (SpectrumGreen) home-brew probes. A baseline for false positive fusion signals of 1% was established by probing synovial sarcoma, which harbors a t(X;18) rearrangement. Of the 15 tumors analyzed, 2 samples failed to show signals, and showed perinuclear chromatin halos, consistent with severe degradation of DNA. The remaining 13 samples consistently exhibited the characteristic ASPL-TFE3 fusion (Figure 1), according to the expected gender-specific pattern. It is noteworthy, however, that the fusion was not uniformly present in all cells within the analyzed tissue regions; the vast majority of the samples contained less than 50% fusion positive cells, with 2 samples exceeding 70% fusion positive cells (Table 1). Genomic heterogeneity was further indicated by the presence of additional fusion signals in two of the samples (2M and 14P) as also observed on aCGH. In these sections, the majority of the cells showed the characteristic pattern, with few interspersed populations of cells that displayed two fusion signals in addition to separately localized red and green signals. No consistent differences were observed between the primary, recurrent and metastatic tumors with regards to the pattern or number of fusion positive nuclei.
Clinicopathological Features
There was no statistically significant relationship between the presence of simple or complex chromosomal abnormalities and the clinicopathological features of age, sex, site of disease, patient status, whether adjuvant therapy was received and type of therapy (Supplementary Table 1). Genomic imbalance did not exhibit a statistically significant relationship with overall patient survival (p=0.13 by log-rank test).
DISCUSSION
In this study, we employed high-throughput approaches to profile the genomic and expression signatures of primary and metastatic ASPS. Moreover, we used an integrative bioinformatics approach to elucidate the molecular pathways associated with the progression of ASPS. To our knowledge this is the most comprehensive and largest cohort of ASPS cases analyzed to date.
Gene expression profiling identified a number of key gene sets in ASPS pathogenesis, a number of which were previously identified in three previous microarray studies, thereby providing cross-validation for our current analysis (10–12). These included the hypoxia, HIF and angiogenesis pathways suggesting an active role for these genesets in ASPS pathogenesis and further supporting the rationale for use of anti-angiogenic inhibitors in therapeutic regimens for the disease. Interestingly, the study by Kobos et al, examined the functional properties of the ASPSCR1-TFE3 fusion oncoprotein, defined its target promoters on a genome-wide basis and performed a high-throughput RNA interference screen to identify which of its transcriptional targets contribute to cancer cell proliferation (12). HIF1a was observed to be a shared target between both this study and our own analysis. Whilst HIF1a has a central role in the adaptation of tumor cells to hypoxia by activating the transcription of targeting genes, its dysregulation is seen in numerous other types of neoplasias (13). Whilst this is a comprehensive study, the overall biological question addressed is significantly different from the one being addressed in our study. Specifically, the study design by Kobos et al, 2013 questions the mechanism by which the primary tumors arise, thus profiling the molecular signature of the early events in ASPS oncogenesis. In contrast, our study specifically interrogates the molecular mechanisms in the critical events of metastasis.
Recurrent regions of copy number abnormalities in the genomic DNA of tumors can identify genes that drive disease pathogenesis. In this study, we therefore focused on identifying recurrent regions of gain or loss in primary and metastatic samples using a unique high-throughput approach. Prior to now, there has only been one metaphase CGH study on ASPS, which revealed gains of 1q, 8q and 16q, including gain of Xp11~pter (14). In this study, high-resolution aCGH revealed a higher number of numerical aberrations in metastatic tumors relative to primaries, but failed to identify any consistent alterations in either group. Indeed, our analysis identified gains and losses not previously observed in ASPS such as the imbalances seen in sample 2M (Table 1). Multiple and complex abnormalities involving deletions, translocations, trisomy 12, and loss of chromosome 17, obtained after chemotherapy, have been described (15). Given that we saw multiple fusion signals in sample 2M, it is likely that this tumor exhibits aneuploidy as a result of increasing chromosomal instability during the metastatic process. The only shared alteration that was observed in two metastatic samples was a 1 copy loss of chromosome 22. As expected from the unbalanced rearrangement involving the X chromosome, the most frequent chromosomal aberration detected was a large segmental gain on Xp with the breakpoint localizing at the TFE3 gene and extending telomeric to it. Genomic loss at 17q25 was also observed frequently, though the amplitude of the alteration showed variation between samples. This seemed to correlate with the percentage of fusion positive cells in the tumor samples (data not shown). As previously reported this is the hallmark translocation of ASPS. Ladanyi et al showed that this unbalanced translocation results in the fusion of TFE3 on Xp11.2, a member of the basic-helix-loop-helix family of transcription factors, to ASPL on 17q25. The resulting fusion gene encodes chimeric ASPL-TFE3 RNA transcripts. Two mutually exclusive types of fusion products, designated type 1 and type 2, are observed (5). ASPL exons 1–7 are fused to TFE3 exon 6 in type 1 and exon 5 in type 2 transcripts (16). Interestingly, TFE3 is also found to be rearranged by specific reciprocal translocations involving Xp11.2 in a subset of pediatric renal cell carcinomas (RCCs), of which one variant translocation is a balance t(X;17)(p11.2;q25), the breakpoints of which are cytogenetically identical to the translocation that is characteristic of ASPS (6).
A remarkable observation was that the low prevalence of the t(17;X)(q25;11.2) rearrangement in tumor samples was belied by the uniform nuclear staining that was observed with TFE3 immunohistochemical (IHC) staining. Discrepancy may arise from the fact that we were comparing a quantitative (FISH) method to a semi-quantitative (IHC) method. While the enumeration process in FISH is based on quantifying discrete signals, interpretation of IHC staining is generally made in a qualitative and subjective manner, where a positive result might refer to the presence of staining in any part of the studied tissue. Another reason for this discrepancy stems from a limitation of detecting rearrangements in FFPE tissue sections. Part of the cell can be lost during the sectioning process, leading to artificially induced loss of a significant percentage of nuclei. This truncation effect can generate a high false negative rate of cells losing signals due to section artifact when using a 5 micron section. Lastly, it is noteworthy that the IHC and the FISH assays for a given tumor were not always performed on the same FFPE blocks. Specifically, the IHC were routinely performed on the samples as a part of the diagnostic workup, and in some cases, the particular blocks were not available for the retrospective FISH assays. Given the heterogeneous nature of the sarcomas, a part of the discrepancy may be attributable to the variation in the tumor makeup.
Conflicting theories on the cellular origin of ASPS (i.e. myogenic versus neurogenic) have been proposed in the literature, with the former hypothesis favored by some solely based on the preferential involvement of skeletal muscle (2,3,11, 17–23). Indeed, early studies using immunohistochemistry highlighted tumor positivity for myogenic antibodies (including MyoD1, desmin and sarcomeric actin) in ASPS, which supported the hypothesis that ASPS is of muscular origin (19, 22). Moreover recent gene expression profiling studies have identified a number of differentially expressed muscle related transcripts in patients with ASPS adding further weight to the case for a muscle cell progenitor as origin of the disease (11,21). However, many other immunohistochemical and PCR based studies have failed to support these findings (2, 20, 23). In this study, several stem cell gene expression signatures and pathways related to differentiation are enriched among the top DE genes. Furthermore, we noted distinct up-regulation of the paired box transcription factor PAX6 in primary sarcomas along with several genes whose mouse orthologs have previously been implicated in Pax6-DNA binding during neural stem cell differentiation (Figures 3 and 4). PAX6 has important functions in the development of the eye, nose, pancreas and central nervous system. Interestingly, PAX6 is necessary and sufficient for human neuroectoderm (NE) specification through repression of pluripotent genes and activation of neural genes (24). Furthermore, one of the PAX6 targets, the LIM/homeobox protein Lhx6, is an important transcription regulator that is known to control differentiation and development of neural cells (8). Indeed, PAX6 as a putative tumor suppressor may have a role in the pathogenesis of many cancers (including breast, oral, lung, gastric, bladder, brain) through promoter hypermethylation or through the sonic hedgehog-GLI signaling pathway (25–31). It is noteworthy, however, that many of the translocation-associated sarcomas use abberant transcription factors in their pathogenesis, and tend to be difficult to classify in terms of their cell of origin, even when dominant patterns are found in terms of lines of differentiation. The signature reported herein, however, does bear a strong resemblance to the molecular mechanism observed in neural stem cells.
In conclusion, our findings seem to indicate that in addition to suggesting a tentative neural line of differentiation for ASPS, transcriptional deregulation from fusion genes may have a critical role in the pathogenesis of ASPS, rather than extensive chromosomal instability.
Supplementary Material
Statement of Translational Relevance.
In this manuscript we provide one of the largest high-resolution oligonucleotide array CGH and expression analyses of primary and metastatic ASPS samples to elucidate candidate molecular pathways involved in tumor pathogenesis. We also used an integrative bioinformatic approach to elucidate the molecular pathways associated with the ASPS progression. We report numerous gene sets which were differentially expressed between primary and metastatic tumors. Notable among these were several stem cell gene expression signatures and pathways related to differentiation including the paired box transcription factor PAX6. In addition to suggesting a tentative neural line of differentiation for ASPS, these results implicate transcriptional deregulation from fusion genes in the ASPS pathogenesis, rather than extensive chromosomal instability. In this regard, an improved understanding of the aberrant transcriptional mechanisms in ASPS pathogenesis can lead to the identification of key genes in pathways that can represent potential therapeutic targets and/or potential markers for sensitivity to specific anti-cancer treatments.
Acknowledgments
Funding for this work was obtained from iCureASPS and a gift from Nuclea Biomarkers to the Jimmy Fund and the Loda laboratory. This work was also supported in part by the National Cancer Institute (RO1CA131945, PO1CA89021, P50 CA90381) to ML. The authors would like to thank Ewa T. Sicinska, DFCI for her help in sample procurement.
Footnotes
Disclosure of Potential Conflicts of Interest: The authors have declared that no competing interests exist.
The authors declare no conflict of interests.
References
- 1.Folpe AL, Deyrup AT. Alveolar soft-part sarcoma: a review and update. J Clin Pathol. 2006;59:1127–32. doi: 10.1136/jcp.2005.031120. [DOI] [PMC free article] [PubMed] [Google Scholar]
- 2.Gomez JA, Amin MB, Ro JY, Linden MD, Lee MW, Zarbo RJ. Immunohistochemical profile of myogenin and MyoD1 does not support skeletal muscle lineage in alveolar soft part sarcoma. Arch Pathol Lab Med. 1999;123:503–7. doi: 10.5858/1999-123-0503-IPOMAM. [DOI] [PubMed] [Google Scholar]
- 3.Guillou L, Lamoureux E, Masse S, Costa J. Alveolar soft-part sarcoma of the uterine corpus: histological, immunocytochemical and ultrastructural study of a case. Virchows Arch A Pathol Anat Histopathol. 1991;418:467–71. doi: 10.1007/BF01605935. [DOI] [PubMed] [Google Scholar]
- 4.Evans HL. Alveolar soft-part sarcoma. A study of 13 typical examples and one with a histologically atypical component. Cancer. 1985;55:912–7. doi: 10.1002/1097-0142(19850215)55:4<912::aid-cncr2820550434>3.0.co;2-g. [DOI] [PubMed] [Google Scholar]
- 5.Ladanyi M, Lui MY, Antonescu CR, Krause-Boehm A, Meindl A, Argani P, et al. The der(17)t(X;17)(p11;q25) of human alveolar soft part sarcoma fuses the TFE3 transcription factor gene to ASPL, a novel gene at 17q25. Oncogene. 2001;20:48–57. doi: 10.1038/sj.onc.1204074. [DOI] [PubMed] [Google Scholar]
- 6.Argani P, Antonescu CR, Illei PB, Lui MY, Timmons CF, Newbury R, et al. Primary renal neoplasms with the ASPL-TFE3 gene fusion of alveolar soft part sarcoma: a distinctive tumor entity previously included among renal cell carcinomas of children and adolescents. Am J Pathol. 2001;159:179–92. doi: 10.1016/S0002-9440(10)61684-7. [DOI] [PMC free article] [PubMed] [Google Scholar]
- 7.Fletcher CDM, Unni K, Mertens F. World Health Organization Classification of Tumours. 2002. Pathology and Genetics of Tumours of Soft Tissue and Bone. [Google Scholar]
- 8.Flandin P, Zhao Y, Vogt D, Jeong J, Long J, Potter G, et al. Lhx6 and Lhx8 coordinately induce neuronal expression of Shh that controls the generation of interneuron progenitors. Neuron. 2011;70:939–50. doi: 10.1016/j.neuron.2011.04.020. [DOI] [PMC free article] [PubMed] [Google Scholar]
- 9.De Witte A, Lea-Chou E, Collins J. Copy Number Analysis of Archival FFPE Tumor Samples by Oligo Array CGH. Application Note. Agilent Technologies; Santa Clara, CA: [Google Scholar]
- 10.Lazar AJ, Das P, Tuvin D, Korchin B, Zhu Q, Jin Z, et al. Angiogenesis-promoting gene patterns in alveolar soft part sarcoma. Clin Cancer Res. 2007;13:7314–21. doi: 10.1158/1078-0432.CCR-07-0174. [DOI] [PubMed] [Google Scholar]
- 11.Stockwin LH, Vistica DT, Kenney S, Schrump DS, Butcher DO, Raffeld M, et al. Gene expression profiling of alveolar soft-part sarcoma (ASPS) BMC Cancer. 2009;9:22. doi: 10.1186/1471-2407-9-22. [DOI] [PMC free article] [PubMed] [Google Scholar]
- 12.Kobos R, Nagai M, Tsuda M, Merl MY, Saito T, Laé M, et al. Combining integrated genomics and functional genomics to dissect the biology of a cancer-associated, aberrant transcription factor, the ASPSCR1-TFE3 fusion oncoprotein. J Pathol. 2013;229:743–54. doi: 10.1002/path.4158. [DOI] [PMC free article] [PubMed] [Google Scholar]
- 13.Semenza GL. Targeting HIF-1 for cancer therapy. Nat Rev Cancer. 2003;3:721–32. doi: 10.1038/nrc1187. [DOI] [PubMed] [Google Scholar]
- 14.Kiuru-Kuhlefelt S, El-Rifai W, Sarlomo-Rikala M, Knuutila S, Miettinen M. DNA copy number changes in alveolar soft part sarcoma: a comparative genomic hybridization study. Mod Pathol. 1998;11:227–31. [PubMed] [Google Scholar]
- 15.Craver RD, Heinrich SD, Correa H, Kao YS. Trisomy 8 in alveolar soft part sarcoma. Cancer Genet Cytogenet. 1995;81:94–6. doi: 10.1016/s0165-4608(99)80002-8. [DOI] [PubMed] [Google Scholar]
- 16.Aulmann S, Longerich T, Schirmacher P, Mechtersheimer G, Penzel R. Detection of the ASPSCR1-TFE3 gene fusion in paraffin-embedded alveolar soft part sarcomas. Histopathology. 2007;50:881–6. doi: 10.1111/j.1365-2559.2007.02693.x. [DOI] [PubMed] [Google Scholar]
- 17.Cullinane C, Thorner PS, Greenberg ML, Kwan Y, Kumar M, Squire J. Molecular genetic, cytogenetic, and immunohistochemical characterization of alveolar soft-part sarcoma. Implications for cell of origin. Cancer. 1992;70:2444–50. doi: 10.1002/1097-0142(19921115)70:10<2444::aid-cncr2820701010>3.0.co;2-6. [DOI] [PubMed] [Google Scholar]
- 18.Foschini MP, Eusebi V. Alveolar soft-part sarcoma: a new type of rhabdomyosarcoma? Semin Diagn Pathol. 1994;11:58–68. [PubMed] [Google Scholar]
- 19.Hirose T, Kudo E, Hasegawa T, Abe J, Hizawa K. Cytoskeletal properties of alveolar soft part sarcoma. Hum Pathol. 1990;21:204–11. doi: 10.1016/0046-8177(90)90130-w. [DOI] [PubMed] [Google Scholar]
- 20.Hoshino M, Ogose A, Kawashima H, Izumi T, Hotta T, Hatano H, et al. Molecular analyses of cell origin and detection of circulating tumor cells in the peripheral blood in alveolar soft part sarcoma. Cancer Genet Cytogenet. 2009;190:75–80. doi: 10.1016/j.cancergencyto.2008.11.014. [DOI] [PubMed] [Google Scholar]
- 21.Nakano H, Tateishi A, Imamura T, Miki H, Ohno T, Moue T, et al. RT-PCR suggests human skeletal muscle origin of alveolar soft-part sarcoma. Oncology. 2000;58:319–23. doi: 10.1159/000012119. [DOI] [PubMed] [Google Scholar]
- 22.Rosai J, Dias P, Parham DM, Shapiro DN, Houghton P. MyoD1 protein expression in alveolar soft part sarcoma as confirmatory evidence of its skeletal muscle nature. Am J Surg Pathol. 1991;15:974–81. doi: 10.1097/00000478-199110000-00008. [DOI] [PubMed] [Google Scholar]
- 23.Wang NP, Bacchi CE, Jiang JJ, McNutt MA, Gown AM. Does alveolar soft-part sarcoma exhibit skeletal muscle differentiation? An immunocytochemical and biochemical study of myogenic regulatory protein expression. Mod Pathol. 1996;9:496–506. [PubMed] [Google Scholar]
- 24.Zhang X, Huang CT, Chen J, Pankratz MT, Xi J, Li J, et al. Pax6 is a human neuroectoderm cell fate determinant. Cell Stem Cell. 2010;7:90–100. doi: 10.1016/j.stem.2010.04.017. [DOI] [PMC free article] [PubMed] [Google Scholar]
- 25.Agundez M, Grau L, Palou J, Algaba F, Villavicencio H, Sanchez-Carbayo M. Evaluation of the methylation status of tumour suppressor genes for predicting bacillus Calmette-Guerin response in patients with T1G3 high-risk bladder tumours. Eur Urol. 2011;60:131–40. doi: 10.1016/j.eururo.2011.04.020. [DOI] [PubMed] [Google Scholar]
- 26.Gasche JA, Hoffmann J, Boland CR, Goel A. Interleukin-6 promotes tumorigenesis by altering DNA methylation in oral cancer cells. Int J Cancer. 2011;129:1053–63. doi: 10.1002/ijc.25764. [DOI] [PMC free article] [PubMed] [Google Scholar]
- 27.Lian ZQ, Wang Q, Li WP, Zhang AQ, Wu L. Screening of significantly hypermethylated genes in breast cancer using microarray-based methylated-CpG island recovery assay and identification of their expression levels. Int J Oncol. 2012;41:629–38. doi: 10.3892/ijo.2012.1464. [DOI] [PubMed] [Google Scholar]
- 28.Moelans CB, Verschuur-Maes AH, van Diest PJ. Frequent promoter hypermethylation of BRCA2, CDH13, MSH6, PAX5, PAX6 and WT1 in ductal carcinoma in situ and invasive breast cancer. J Pathol. 2011;225:222–31. doi: 10.1002/path.2930. [DOI] [PubMed] [Google Scholar]
- 29.Pesek M, Kopeckova M, Benesova L, Meszarosova A, Mukensnabl P, Bruha F, et al. Clinical significance of hypermethylation status in NSCLC: evaluation of a 30-gene panel in patients with advanced disease. Anticancer Res. 2011;31:4647–52. [PubMed] [Google Scholar]
- 30.Yao D, Shi J, Shi B, Wang N, Liu W, Zhang G, et al. Quantitative assessment of gene methylation and their impact on clinical outcome in gastric cancer. Clin Chim Acta. 2012;413:787–94. doi: 10.1016/j.cca.2012.01.013. [DOI] [PubMed] [Google Scholar]
- 31.Zong X, Yang H, Yu Y, Zou D, Ling Z, He X, et al. Possible role of Pax-6 in promoting breast cancer cell proliferation and tumorigenesis. BMB Rep. 2011;44:595–600. doi: 10.5483/bmbrep.2011.44.9.595. [DOI] [PubMed] [Google Scholar]
Associated Data
This section collects any data citations, data availability statements, or supplementary materials included in this article.