Abstract
Purpose
To demonstrate the feasibility of performing bone microarchitecture, high- resolution cartilage, and clinical imaging of the hip at 7 Tesla.
Materials and Methods
This study had institutional review board approval. Using an 8-channel coil constructed in-house, we imaged the hips of 15 subjects on a 7 T MRI scanner. We applied: 1) a T1-weighted 3-dimensional fast low angle shot (3-D FLASH) sequence (0.23 × 0.23 × 1–1.5 mm3) for bone microarchitecture imaging; 2) T1-weighted 3-D FLASH (water excitation) and volumetric interpolated breath-hold examination (VIBE) sequences (0.23 × 0.23 × 1.5 mm3) with saturation or inversion recovery-based fat suppression for cartilage imaging; 3) 2-D intermediate-weighted fast spin-echo (FSE) sequences without and with fat saturation (0.27 mm × 0.27 mm × 2 mm) for clinical imaging.
Results
Bone microarchitecture images allowed visualization of individual trabeculae within the proximal femur. Cartilage was well-visualized and fat was well-suppressed on FLASH and VIBE sequences. FSE sequences allowed visualization of cartilage, the labrum (including cartilage and labral pathology), joint capsule, and tendons.
Conclusion
This is the first study to demonstrate the feasibility of performing a clinically-comprehensive hip MRI protocol at 7 T, including high-resolution imaging of bone microarchitecture and cartilage, as well as clinical imaging.
Keywords: 7 Tesla, MRI, hip, bone microarchitecture, cartilage, clinical
INTRODUCTION
Over the last several years, there has been increasing interest in ultra high field (UHF, ≥ 7 Tesla) magnetic resonance imaging (MRI) of the musculoskeletal system (1–6). The main benefit of scanning at UHF is the increased signal-to-noise ratio (SNR), which scales approximately linearly with the magnitude of the main magnetic field, B0. Deniz et al. found that 7 T provided a 2.3-fold SNR gain over 3 T in hip articular cartilage (7). The extra SNR available at 7 T can be used: 1) to image with higher spatial resolution, which may improve the diagnostic quality of images, or 2) to image with shorter scan times, which may decrease the risk of patient motion artifact and/or patient discomfort. Additional benefits of performing MRI at 7 T include improved sensitivity for the detection of low gamma nuclei (8–11) and improved spectral resolution for magnetic resonance spectroscopy (MRS) applications (12, 13).
To take full advantage of the potential benefits of scanning at UHF, numerous technical challenges must be addressed. Among these challenges is the need for radiofrequency coils specifically tailored to the body part of interest. While dedicated musculoskeletal coils designed for imaging the wrist, knee, foot/ankle, shoulder, and pelvis are commercially available at 3 T, 7 T musculoskeletal commercial coils are generally limited to the knee. As a result, musculoskeletal studies at 7 T have focused predominantly on knee disorders (4, 14–17). In this work, we utilize a home-built 8-channel transmit/receive array (18) to image the hip. Besides this lack of a diverse radiofrequency coil portfolio at 7 T, other issues that must be considered when performing UHF MRI include: B1+ field inhomogeneity, which may lead to spatial signal variation or inhomogeneous fat suppression; elevated specific absorption rate, which is particularly problematic when imaging deep anatomic structures such as the hip, and may preclude the performance of certain protocols, such as fast spin-echo sequences; and unfamiliarT1, T2, and T2* relaxation values, which necessitate custom protocols to provide conventional image contrast.
Because musculoskeletal disease such as osteoporosis and osteoarthritis frequently affect the hip, the goal of this study was to demonstrate the feasibility of performing a comprehensive musculoskeletal MRI protocol of the hip at 7 T, including bone microarchitecture, high-resolution cartilage, and clinical fast spin-echo imaging.
MATERIALS AND METHODS
Subject Recruitment
This study had institutional review board approval, and we obtained written informed consent from all subjects. We recruited 15 subjects (3 males, 11 females, mean age = 60.6 ± 16.2 years). Five subjects reported no history of hip pain or musculoskeletal disorder. Four subjects had a diagnosis of osteopenia (dual-energy x-ray absorptiometry areal bone mineral density T-score less than −1.0, but greater than −2.5) and five subjects had a diagnosis of osteoporosis (bone mineral density T-score less than −2.5). One male subject had a history of labral debridement and femoral neck osteochondroplasty for femoroacetabular impingement.
7 T MRI System
We scanned subjects’ hips on a 7 Tesla whole body MRI scanner equipped with an eight-channel parallel transmit system (Siemens, Erlangen, Germany) using an eight-channel flexible transmit-receive array coil(18) (Figure 1). Local RF shimming was used to achieve transmit field (B1+) phase coherence in the hip(19), thereby maximizing transmit efficiency.
Figure 1.
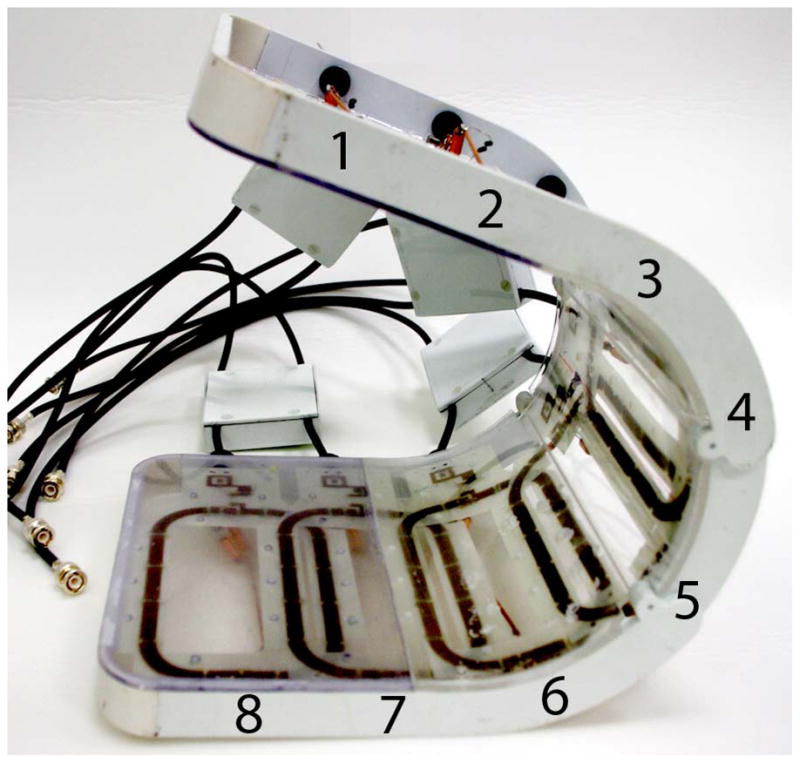
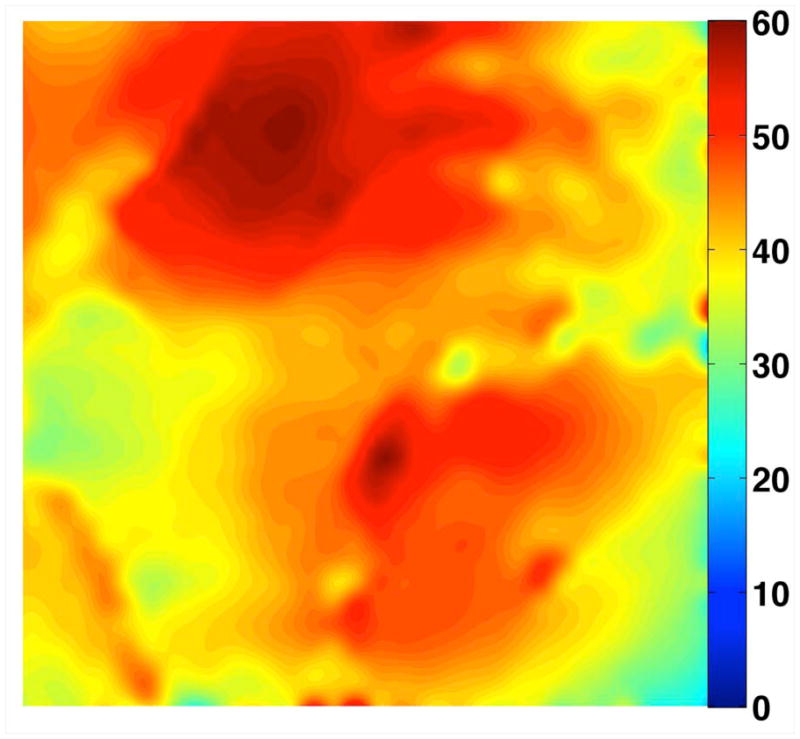
Photograph of the eight-channel transmit/receive array (a). Representative flip angle map in the coronal plane (b). Coronal SNR maps (c) and SNR profiles in graphical format (d) were obtained at 3 T (4 element receive coil) and 7 T (8 element receive coil). There is 10-fold higher in the femoral neck and 5-fold higher at the superior hip joint space at 7 T compared to 3 T. The greater than expected linear SNR gains at 7 T are likely due to the use of more elements at 7 T.
Bone microarchitecture, Cartilage, and Clinical Imaging Protocols
For bone microarchitecture imaging, we implemented a T1-weighted 3-D fast low angle shot (3-D FLASH) sequence similar to prior studies (14, 22, 23). First, we tried a protocol with the same voxel size as in a prior 3T study of the proximal femur (24) (TR/TE = 31 ms/5.1 ms, matrix = 512 × 512, field-of-view = 120 mm, slice thickness = 1.5 mm, 60 slices, acquisition time = 21 minutes, parallel acceleration factor = 1). We tried this protocol on both the 7 T MRI scanner and for comparison in one subject, a 3 T MRI scanner (Siemens Trio) using a 4 element body matrix coil. Since this protocol is time-consuming (increasing the risk for motion artifact) and the slices are thick compared to the in-plane resolution, we utilized the 7 T SNR advantage to also try faster, higher resolution versions of the sequence with shorter TRs and a thinner slice thickness (TR/TE = 9 ms/4.1 ms, matrix = 512 × 512, field of view = 120 mm, slice thickness = 1 mm, 60 slices, acquisition time = 6 minutes 56 seconds, parallel acceleration factor = 1; and TR/TE = 18 ms/4.1 ms, acquisition time = 7 minutes 8 seconds, parallel acceleration factor = 2, all other parameters identical). We then assessed whether we could spatially resolve individual trabeculae within the proximal femur on the images.
For high-resolution cartilage imaging, we implemented a variety of 3-D GRE acquisitions. Keeping in mind that fat suppression is essential to generate contrast between the cartilage and adjacent bone, but can be difficult to achieve at high-field due to inhomogeneous B0 and B1+, three fat-suppression methods were explored: 1) 3-D FLASH sequence with water excitation, which is a well-established sequence for cartilage imaging (25, 26) (TR/TE = 12 ms/TE = 5.1 ms, matrix = 512 × 512, field-of-view = 120 mm, slice thickness = 1.5 mm, 60 slices, acquisition time = 6 minutes 39 seconds, parallel acceleration factor = 2). 2) 3-D volumetric interpolated breath hold examination (VIBE) sequence with saturation-based fat suppression. The VIBE sequence was recently proposed by Zheng et al. as a faster and motion-impervious alternative to 3-D FLASH for cartilage imaging (27). We implemented VIBE with the following parameters: TR/TE = 10 ms/3 ms, 512 × 512, field of view = 120 mm, slice thickness = 1.5 mm, 40 slices, acquisition time = 3 minutes 48 seconds, parallel acceleration factor = 2. 3) Adiabatic pulses can be advantageous at high field due to their inherent robustness to B1+ inhomogeneity. Accordingly, we implemented 3-D VIBE with spectrally adiabatic inversion recovery (SPAIR) fat suppression (TR/TE = 9 ms/ 4.3 ms, 512 × 512, field of view = 120 mm, slice thickness = 1.5 mm, 40 slices, acquisition time = 6 minutes 1 second, parallel acceleration factor = 1). To convert the 3 T product SPAIR module to 7 T, the SPAIR pulse duration was reduced from 23 ms to 10 ms to improve robustness against B0 variation and take advantage of the increased fat-water spectral separation, and the assumed T1 value of fat was increased to 540 ms based on preliminary phantom and in vivo measurements.
For the clinical imaging, we implemented an intermediate-weighted fast spin echo sequence, both without and with fat saturation (TR/TE = 3000 ms/26 ms, matrix = 448 × 448, field of view = 124 mm, slice thickness = 2 mm, echo train length = 6, 9 slices, acquisition time =2 minutes 8 seconds, parallel acceleration factor = 2).
RESULTS
Radiofrequency Shimming
Local phase shimming provided reasonable transmit homogeneity in the femoral neck region, where the flip angle non-uniformity was 15% (standard deviation divided by the mean flip angle) (Figure 1b).
Bone Microarchitecture Imaging
Representative 7 T images of proximal femur bone microarchitecture in patients with osteopenia and osteoporosis are shown in Figures 2a through 2f. Figures 2a and 2b show images obtained with the original 21 minute protocol (TR/TE = 31 ms/5.1 ms, voxel size = 0.23 × 0.23 × 1.5 mm3). Figures 2c and 2d show images obtained with a 7 minute protocol and smaller slice thickness (TR/TE = 9 ms/4.1 ms, 0.23 × 0.23 × 1 mm3). Figures 2e and 2f show images obtained in the same patient with two different 7 minute protocols and the smaller slice thickness (TR/TE = 9 ms/4.1 ms, 0.23 × 0.23 × 1 mm3 and TR/TE = 18 ms/4.1 ms, 0.23 × 0.23 × 1 mm3, parallel imaging acceleration factor = 2). Finally, as a comparison, Figure 2g shows a figure obtained in one osteoporotic subject on a 3 T MRI scanner using the 21 minute protocol (TR/TE = 31 ms/5.1 ms, voxel size = 0.23 × 0.23 × 1 mm3). The trabeculae are difficult to visualize at 3 T.
Figure 2.
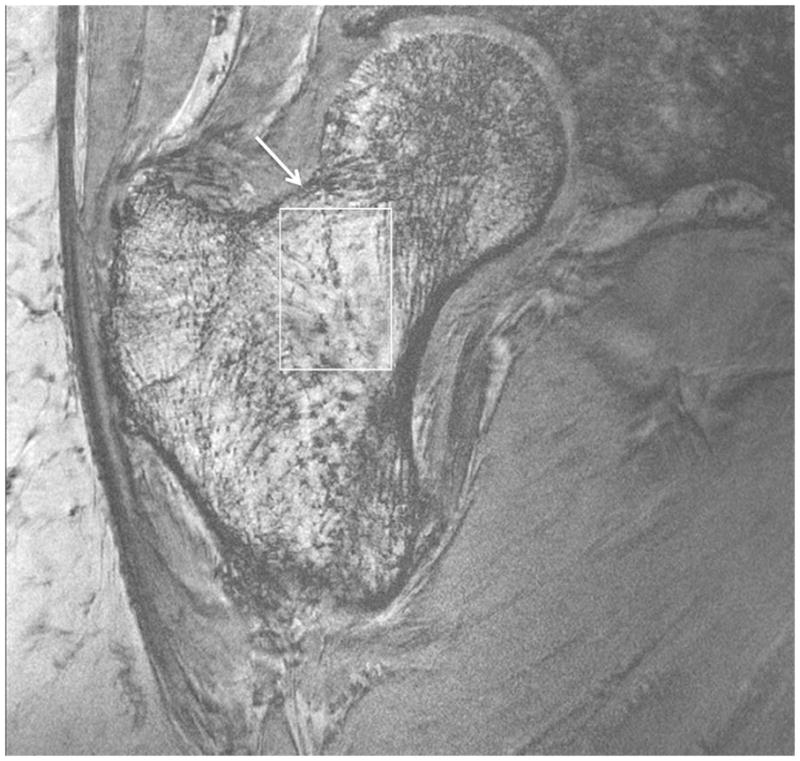
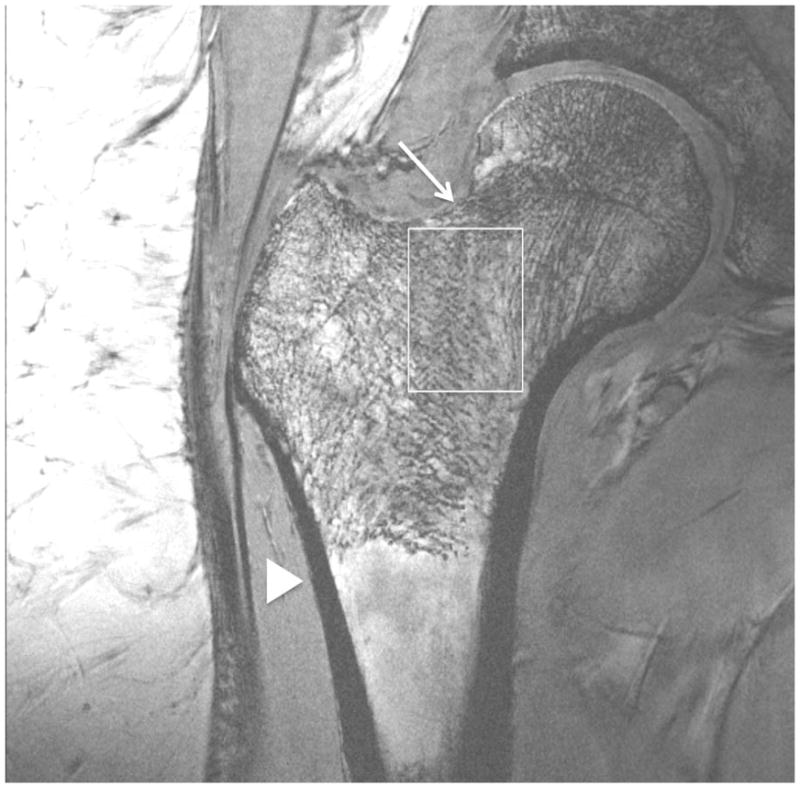
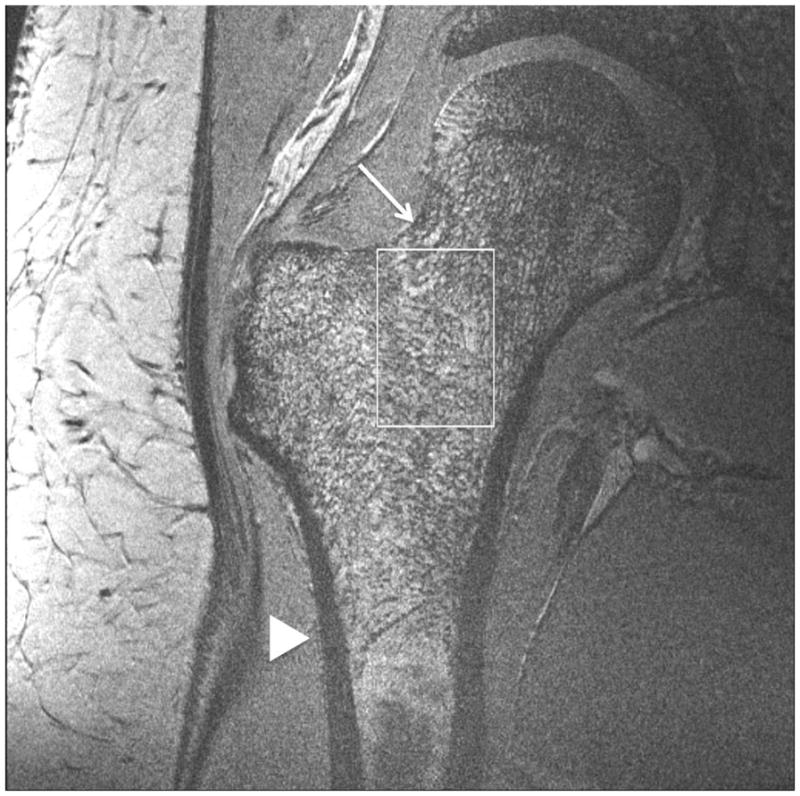
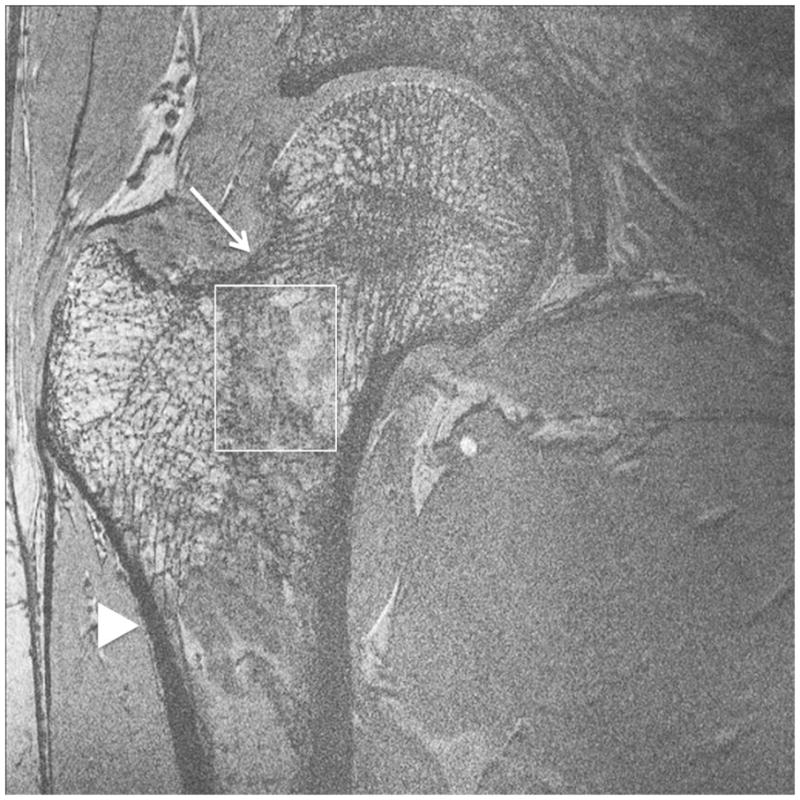
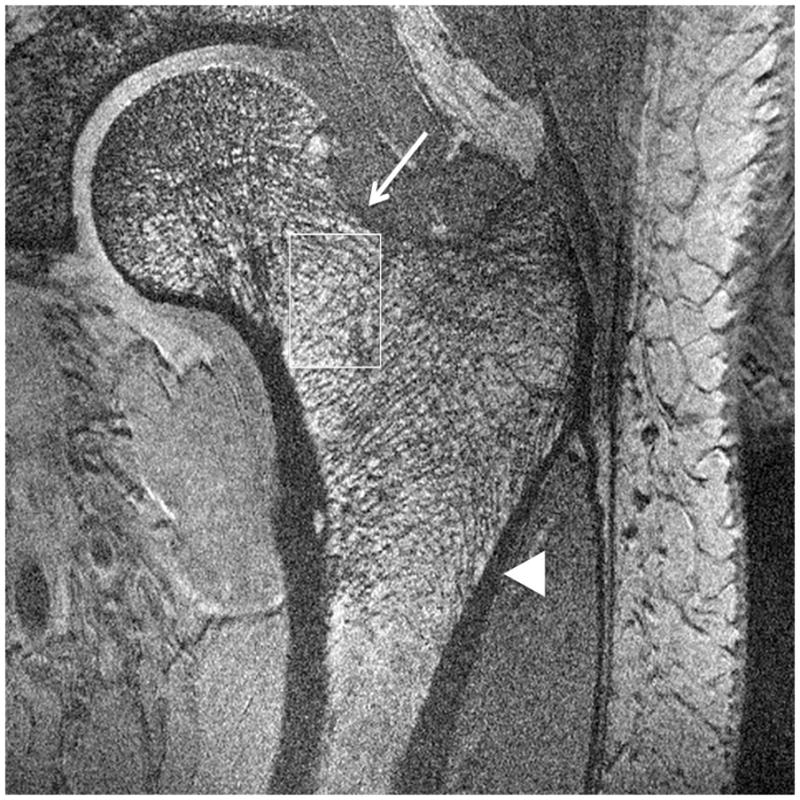
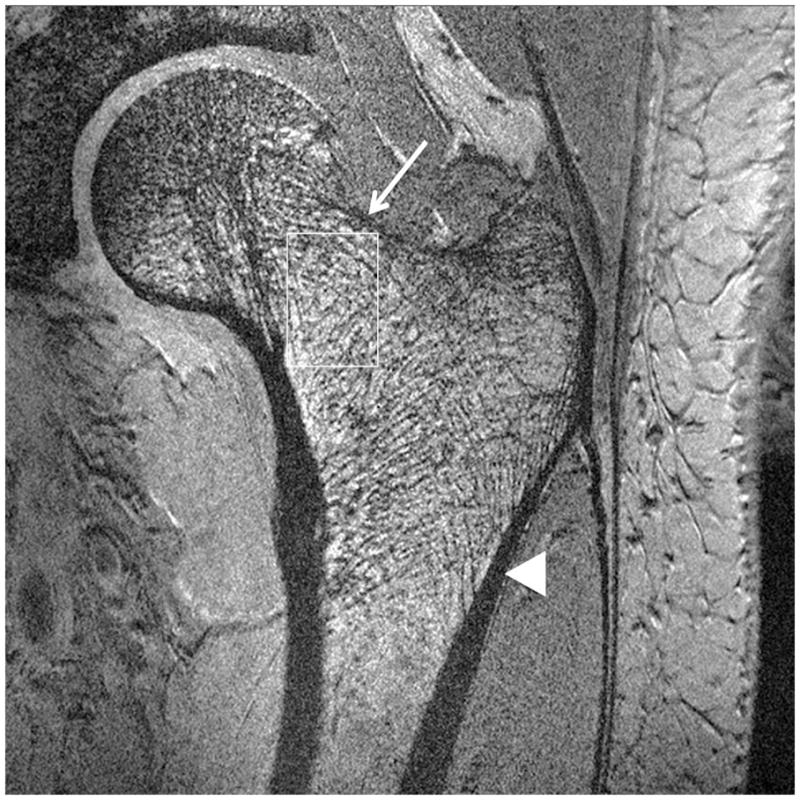
Imaging of bone microarchitecture of the proximal femur. Images in (a) and (b) were obtained at 7 T with a longer protocol (3-D FLASH, TR/TE = 31 ms/5.1 ms, 0.234 × 0.234 × 1.5 mm3, acquisition time = 21 minutes). The images in (c) and (d) were obtained at 7 T with a shorter protocol and smaller voxel size (TR/TE = 9 ms/4.1 ms, 0.234 × 0.234 × 1 mm3, 6 minutes 56 seconds). The images in (e) and (f) were obtained at 7 T in the same subject with two different shorter protocols. In (e), we used TR/TE = 9 ms/4.1 ms, 0.234 × 0.234 × 1 mm3, 6 minutes 56 seconds without parallel imaging. In (f), we used TR/TE = 18 ms/4.1 ms, 0.234 × 0.234 × 1 mm3, 7 minutes 6 seconds, parallel imaging acceleration factor of 2. Regardless of the protocol used at 7 T, individual trabeculae are visualized in the proximal femur in all images. The patients with a diagnosis of osteoporosis (bone mineral density T-scores less than −2.5) in (a) and (d) have fewer trabeculae (boxes) in the femoral neck compared to patients with osteopenia (bone mineral density T-scores between −2.5 and −1.0) in (b), (c), (e). There is thinning of the superolateral cortex of the femoral neck (arrows). Within the proximal femoral diaphysis, there are few trabeculae, but cortex is thicker (arrowheads). In the subject in (d), intermediate signal within the intertrochanteric region of the femur represents red marrow. Finally, for comparison, the image in (g) was obtained in one osteoporotic subject at 3 T using the longer protocol (TR/TE = 31 ms/5.1 ms, 0.234 × 0.234 × 1.5 mm3, acquisition time = 21 minutes). In (g), trabeculae are difficult to visualize.
Regardless of the protocol used at 7 T, we could visualize individual trabeculae within the femoral neck, including longitudinally oriented trabeculae, which are consistent with compressive trabeculae described in anatomy textbooks. Of note, there is spatial variation in the pattern of trabeculae in the femoral neck and intertrochanteric region. Patients with osteoporosis (Figures 2a, 2d) demonstrated fewer trabeculae within the femoral neck compared to patients with osteopenia (Figures 2b, 2c, 2e). Cortical thinning at the superolateral aspect of the femoral neck was visible. In the proximal diaphysis of the femur, few trabeculae were seen, but the cortex both medially and laterally is thick.
Cartilage Imaging
Representative 7 T high-resolution images of cartilage are shown in Figure 3. Images were acquired with 3-D FLASH water excitation, 3-D VIBE saturation-based fat-suppression, and 3-D VIBE SPAIR fat suppression sequences at a voxel size of 0.23 mm × 0.23 mm × 1.5 mm. On all images, cartilage was well-delineated with hyperintense signal, and subchondral bone was hypointense. All three fat suppression methods provided excellent nulling of the fat signal within the hip region. Efficacy of the water excitation and saturation-based fat suppression was slightly less reliable in the subcutaneous fat, likely due to inhomogenous B0 and B1+ fields.
Figure 3.
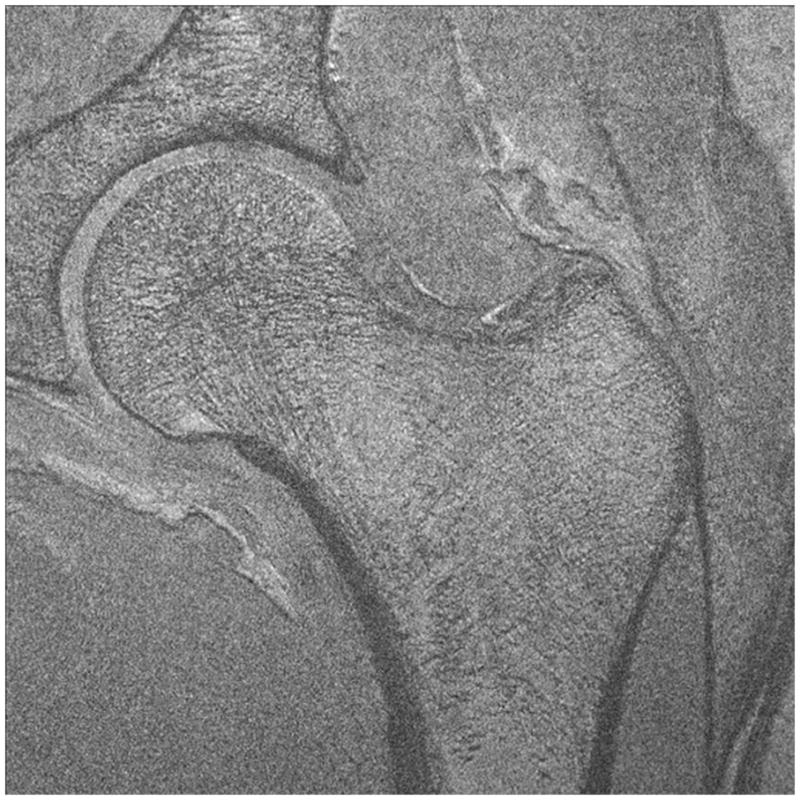
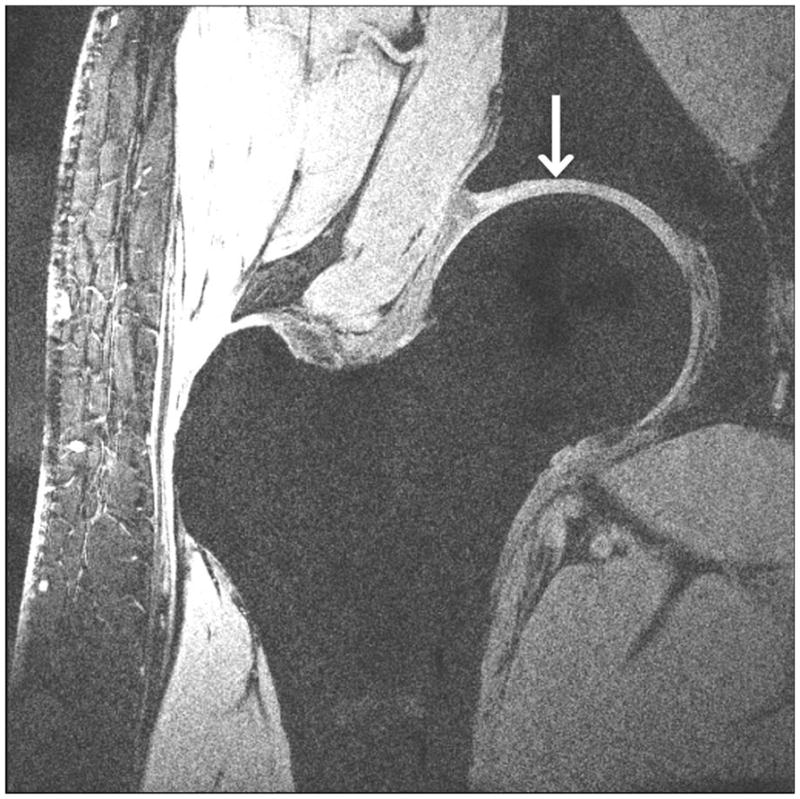
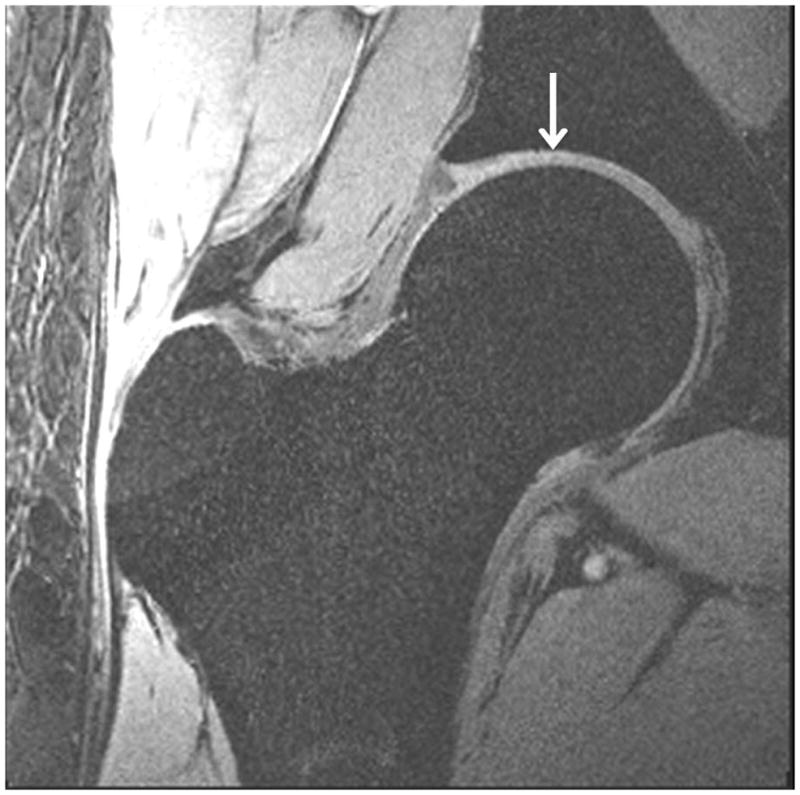
High-resolution cartilage imaging of hip joint cartilage at 7 T. We obtained images with: (a) 3-D FLASH water excitation (TR/TE = 12 ms/5.1 ms); (b) 3-D VIBE frequency-selective fat suppressed (TR/TE = 10 ms/3 ms); and (c) 3-D VIBE SPAIR fat suppressed (TR/TE = 9.3 ms/4.3 ms) sequences at a resolution of 0.23 × 0.23 × 1.5 mm3. Cartilage is hyperintense and subchondral is overall hypointense with uniform fat suppression.
Clinical Imaging
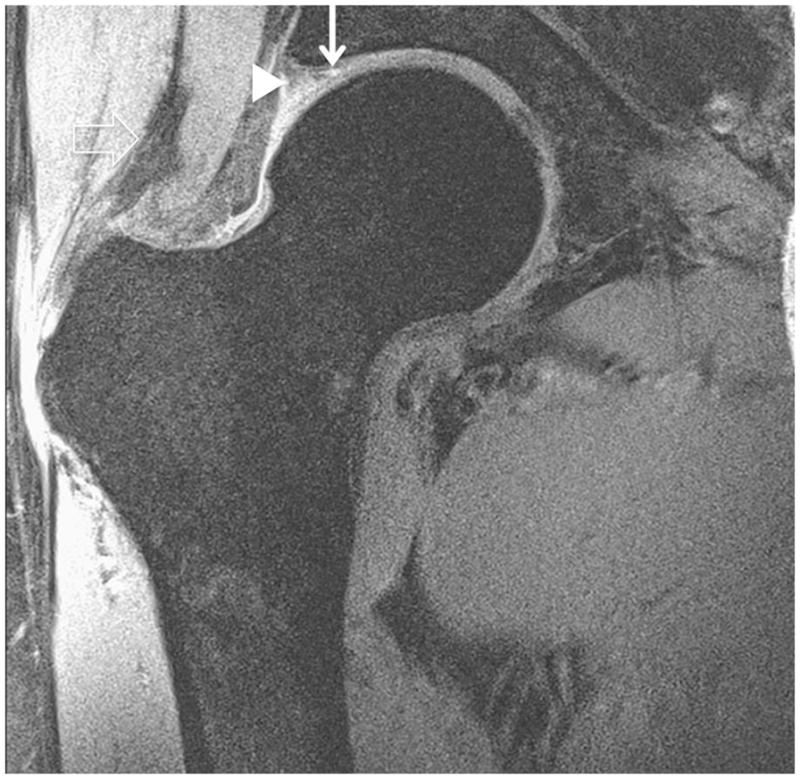
Representative 7 T FSE images obtained without and with fat suppression are shown in Figures 4 and 5. We obtained images at a resolution of 0.27 mm × 0.27 mm × 2 mm. Normal labra (Figures 4a, 4b, 4c) and tiny perilabral sulci (Figures 4a, 4c), normal anatomic variants, were visualized. Labral abnormalities were also delineated, including degenerative tearing of the labra in a 57 year old subject (Figure 4d) and a 70 year old subject (Figure 4e). We also had one case of a labral debridement in a 36 year old subject who was status post femoral neck osteochondroplasty for treatment of femoracetabular impingement (Figure 5b). Small delaminating cartilage fissures were also visible in two subjects (Figures 4e, 5b). Additional hip joint structures, such as the joint capsule, synovial fluid, and tendons, were also easily visualized.
Figure 4.
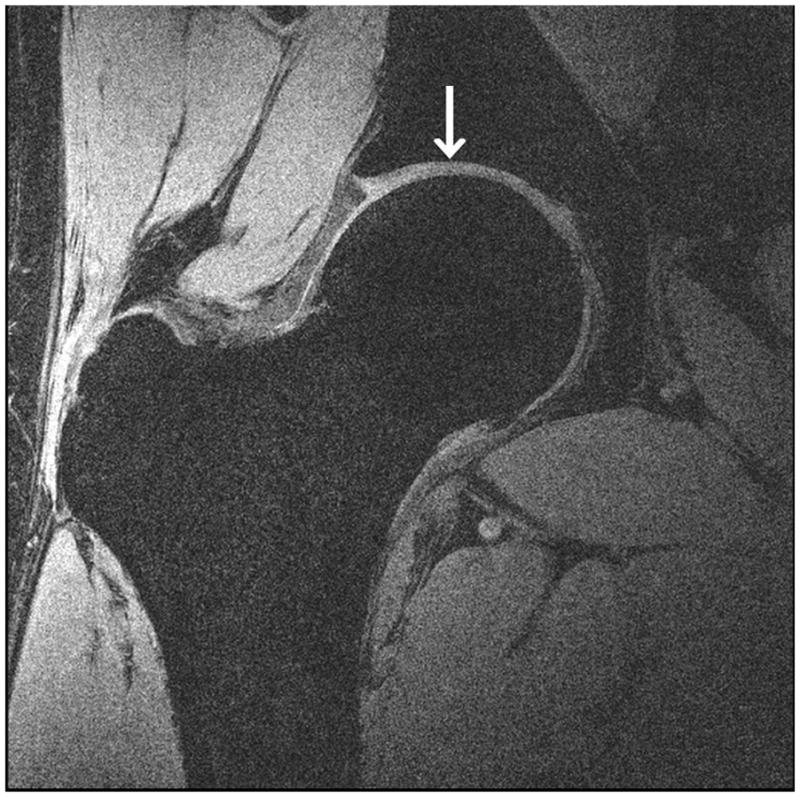
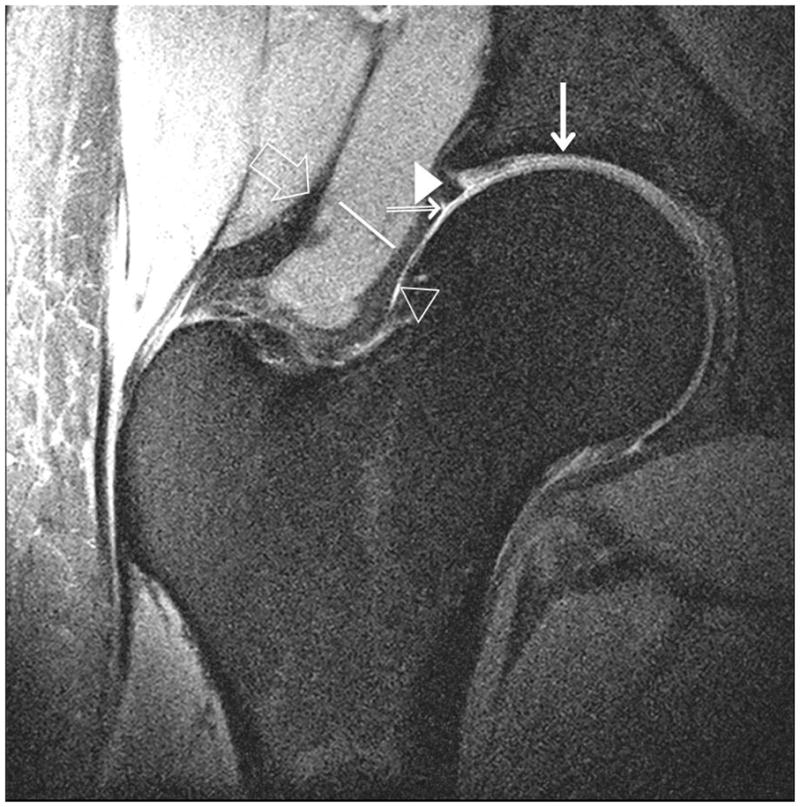
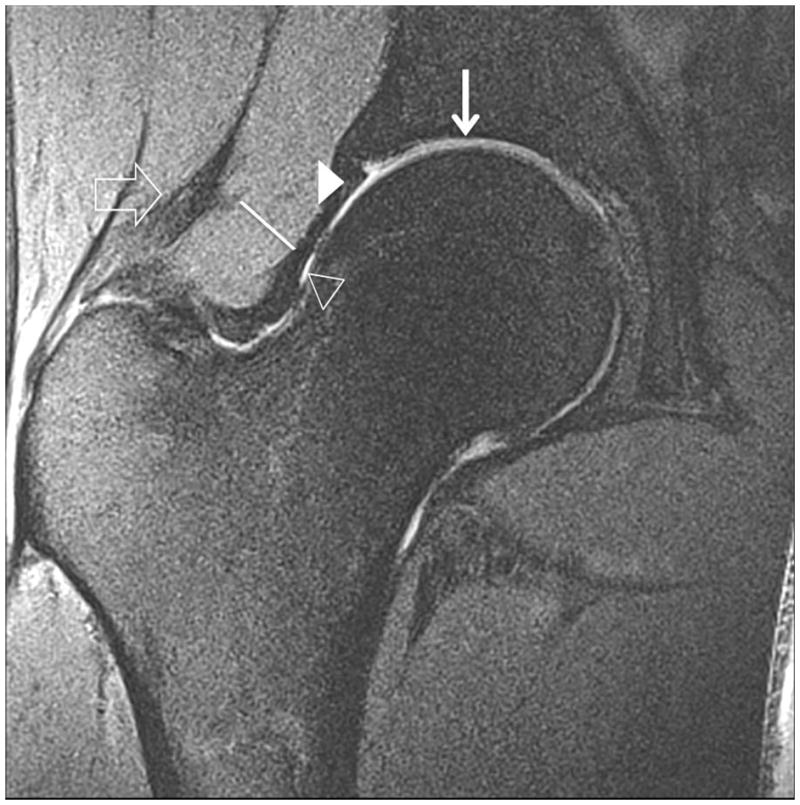
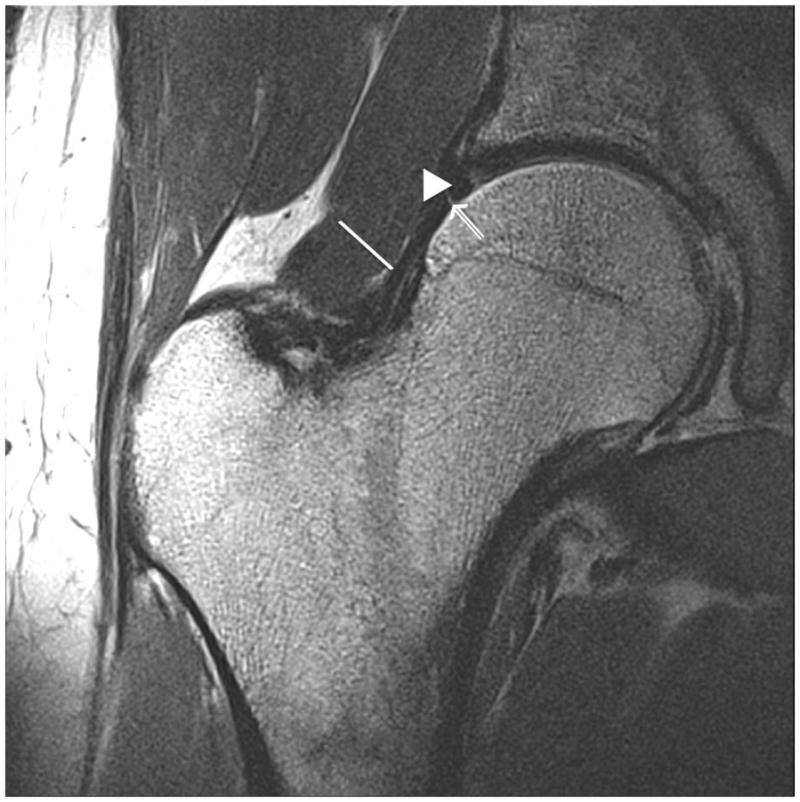
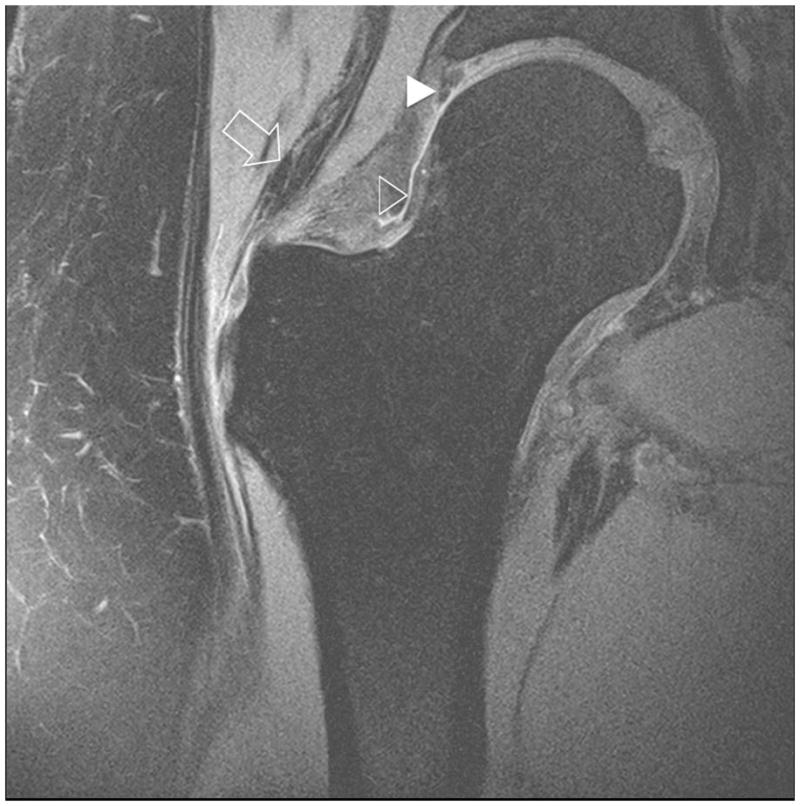
Clinical fast spin-echo imaging of the hip joint at 7 T. Representative coronal images in three subjects were imaged with fat suppression (a, b) and without fat suppression (c). In (a) and (c), the labra (arrowheads) are normal and a tiny perilabral sulcus (double-lined arrow), a normal anatomic variant, is visible. In (b), the labrum is intact, but no perilabral sulcus is present. In the 57 year old female in (d), the labrum is irregular in morphology, and in the 70 year old female in (e), the labrum is hyperintense in signal with ill-defined margins. These findings in (d) and (e) are both consistent with degenerative tearing of the labrum. Additionally, in (e), there is evidence for a delaminating cartilage fissure (vertical arrow) involving acetabular cartilage. The hip joint capsule (diagonal line), normal articular cartilage (vertical arrows in (a) and (b)), trace synovial fluid subjacent to the joint capsule (open arrowhead), and gluteal tendons (open arrow) are also seen on the images.
Figure 5.
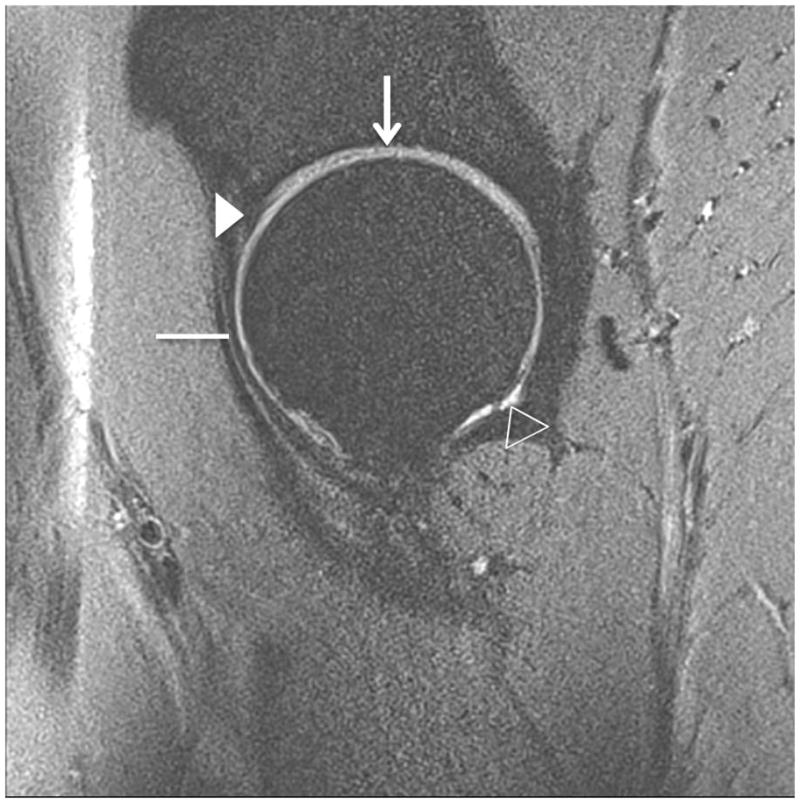
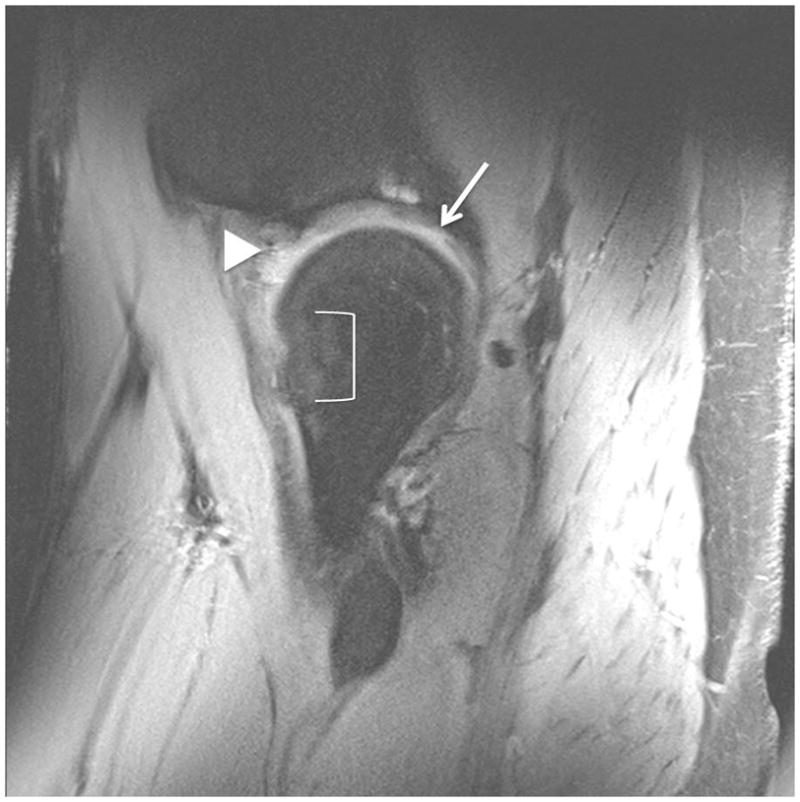
Clinical fast spin-echo imaging of the hip joint at 7 T. Sagittal fat-suppressed image in a healthy subject is shown in (a). Articular cartilage (vertical arrow), the joint capsule (horizontal line), the labrum (arrowhead), and synovial fluid (open arrowhead) are visible. In the 36 year-old male in (b) who was diagnosed with femoroacetabular impingement, there has been debridement of the labrum (arrowhead) and osteochondroplasty (bracket). The patient also had a small cartilage fissure (diagonal arrow).
DISCUSSION
This is the first study to demonstrate the feasibility of performing a complete hip MRI protocol at 7 T in vivo, including bone microarchitecture, high-resolution cartilage, and clinical imaging. With regards to imaging of bone microarchitecture, we demonstrate the feasibility of depicting individual trabeculae within the proximal femur in vivo. With regards to high-resolution cartilage imaging, we were able to obtain whole joint coverage using T1-weighted gradient echo sequences, which are considered the sequences of choice for quantitation of cartilage thickness and volume (26). Finally, we were able to obtain clinical FSE images without and with fat saturation and were able to visualize important anatomic structures, such as the labrum, joint capsule, and tendons.
There is great interest in imaging bone microarchitecture of the proximal femur in vivo because: 1) femoral neck fracture is the most devastating site of osteoporotic fracture, resulting in $12 billion in fracture-related expenses per year (28) and 2) bone microarchitecture provides information about bone strength and fracture risk that cannot be obtained with the current standard-of-care test used for osteoporosis diagnosis, dual-energy x-ray absorptiometry estimation of areal bone mineral density (29, 30). Though bone microarchitecture has been frequently imaged in vivo in the distal extremities (ankle, wrist, knee) (2, 29, 31), the handful of studies examining bone microarchitecture of the proximal femur have been performed in an ex vivo fashion via micro-computed tomography (microCT) scanning of biopsy specimens obtained from cadaveric femurs (32–34).
In vivo studies of proximal femur bone microarchitecture have not been possible because: 1) clinical CT scanners have detector widths of 0.5 mm to 1 mm, and thus cannot resolve trabeculae, which can be less than 0.2 mm in dimension; 2) high-resolution peripheral computed tomography (HRpQCT) scanners have small bores that can only accommodate the wrist or ankle; 3) inherent SNR limitations of clinical MR scanners (≤ 3 T) may require signal averaging and therefore long acquisition times to achieve sufficient SNR to resolve bone microarchitecture, particularly in deeper anatomy such as the femoral neck (6 cm to 10 cm from the skin surface), where SNR is further limited due to increased distance from the radiofrequency coil. In 2005, Krug et al. were the first to describe the potential of 3 T MRI to evaluate proximal femur structure in vivo and were able to obtain 2-D textural parameters that could be correlated to histomorphometric measures (24).
We were able to visualize individual trabeculae at 7 T on all the images, regardless of the protocol we used. In particular, we showed that bone microarchitecture of the entire proximal femur can be imaged at 7 T at a resolution of 0.23 × 0.23 × 1 mm and with a scan time of 7 minutes (either with TR = 7 ms and no parallel imaging, or with TR = 18 ms and parallel imaging acceleration factor = 2). This suggests that the higher SNR of 7 T can be leveraged to obtain an imaging exam with small voxel size and also shorter scan times, which decreases the risk of motion artifact. In the future, it is also likely that the resolution and scan times could be decreased even further. We do note that because of the reduced T2* with higher field strength, the apparent trabecular thickness and bone volume fraction in GRE images can be increased (35). Phan et al. used a GRE sequence to image bone microarchitecture in the calcaneus at 1.5 T and 3 T (35). They showed that trabecular thickness increased 22% and bone volume fraction increased 35% at 3 T compared to 1.5 T; however, they also showed that there were significant correlations (r = 0.57 to r = 0.87), between the both sets of MR measurements and measurements obtained with the gold standard of microcomputed tomography. Trabecular broadening could be alleviated with shorter TE sequences or even potentially ultra-short TE sequences such as that described by Du et al (36). Overall, the ability of 7 T MRI to image individual trabeculae and thus proximal femur microstructure in 3-D in vivo will allow clinical research studies of proximal femur microarchitectural deterioration in patients with osteoporosis.
We have also demonstrated the feasibility of performing high-resolution cartilage MRI at 7 T using T1-weighted gradient-echo sequences (with water excitation, saturation-based fat suppression, or SPAIR fat suppression). Gradient echo sequences have been well-established as the sequences of choice for semi-quantitative or quantitative assessment of cartilage morphology in osteoarthritis studies (25, 26, 37). We implemented: 1) a 3-D FLASH sequence, which is perhaps the most well-established and widely used gradient-echo sequence for cartilage imaging, and 2) a 3-D VIBE sequence, which was recently suggested by Zheng et al. in 2010 as an alternative to 3-D FLASH(27). For these gradient-echo images, we achieved a resolution of 0.23 mm × 0.23 mm × 1.5 mm, which is a smaller voxel size than previously described cartilage imaging studies performed at 1.5 T and 3 T (26). In addition, because we applied parallel imaging with an acceleration factor of 2, we were able to obtain images of the entire hip joint cartilage in less than 7 minutes. Finally, we note that the 3-D FLASH and 3-D VIBE images were similar in image quality and appearance and were both free of respiratory or motion artifacts, owing to the stationary nature of the lower extremities. While the VIBE sequence is primarily utilized to reduce motion artifacts in susceptible organs such as the liver, its primary advantage in our application was its short RF pulse and consequentially reduced TE and acquisition time, which can be expected to increase signal intensity in short T2 structures and diminish the likelihood of bulk patient motion compared to the FLASH sequence. Fat suppression can be challenging at 7 T due to B1+ and B0 inhomogeneity. We found that water excitation using a binomial pulse afforded power-efficient and B1+ insensitive fat suppression, and represented an attractive alternative to conventional saturation-based fat suppression, which can be SAR-intensive and perform poorly in regions with low B1+. Whereas the long duration required for fat/water phase cycling at clinical field strengths (≤ 3 T) make binomial pulses impractically long, the method can be readily applied at 7 T due to the corresponding reduction in cycling time. One disadvantage of the water excitation technique utilized in this study was its non-selective nature, requiring a larger imaging volume than may be desired. However, this requirement was partially mitigated by the limited FOV of the local 7 T transmit-receive coil. SPAIR also provided excellent fat suppression and high cartilage/bone contrast. As with the water excitation technique, the main advantage of SPAIR is insensitivity to B1+ inhomogeneity due to its adiabatic pulse. Although adiabatic pulses are inherently power-intense, SAR can be reduced by applying the pulse less regularly. In the current application, we found a satisfactory compromise between SAR and fat suppression efficacy by applying 1 adiabatic pulse per 100 lines of acquired k-space (whereas the default value is 1 pulse per 40 lines). A final consideration is the prolonged scan time associated with the inversion-recovery period of the SPAIR technique, which we have found to be tolerable, given its excellent efficacy.
For the clinical imaging, we implemented an intermediate-weighted fast spin-echo sequence, both without and with fat suppression, and we acquired images at a resolution of 0.27 mm × 0.27 mm × 2 mm, which is a smaller voxel size than that obtained with current clinical hip imaging protocols at 1.5 T and 3 T (38). Intermediate-weighted FSE sequences are the cornerstone for clinical musculoskeletal imaging protocols at 1.5 T and 3 T. Besides being useful for depiction of cartilage (in addition to T1-weighted gradient echo sequences) due to high contrast with adjacent subchondral bone and synovial fluid (26), FSE images allow visualization of other anatomic structures in the hip joint. We were able to visualize the cartilage (including small cartilage fissures), the labrum, (including degenerative tearing and post-surgical changes of the labrum), ligaments, tendons, and synovial fluid.
Despite potential issues in B1+ field inhomogeneity at 7 T, we were able to obtain adequate signal uniformity and consistent fat suppression in the hip. The advantage of performing patient specific RF shimming in parallel transmit mode is that it can: 1) improve transmit efficiency by steering the B1+ field to the desired location and 2) compensate for anatomic differences such as body size and tissue composition, which cause different baseline radiofrequency excitation patterns. These benefits for parallel transmit MRI of the hip at 7 T were described in two studies published in 2012. Deniz et al. used a novel method to maximize transmit efficiency via multiple (eight) channel excitation and radiofrequency shimming; this method allowed reduced power deposition while maintaining an increased average flip angle across a desired region of interest in the hip joint (7). Ellerman et al. performed bilateral hip imaging at 7 T using a 16 channel radiofrequency transmitter coupled to a 16 channel transmit-receive array (39). They showed that a fast B1+ calibration procedure could correct for B1 defects on hip images and thus allow visualization of hip joint anatomy.
Finally, we believe that is important to discuss the potential clinical benefits stemming from the performance of hip MRI at 7 T. First, as discussed above, the higher SNR available at 7 T facilitates hip imaging, which at baseline is SNR-challenged because the hip joint is distant from the radiofrequency coil overlying the patient. Second, because SNR is directly proportional to voxel size, the higher SNR available at 7 T facilitates imaging with higher spatial resolution (smaller voxel size). This is beneficial for hip MRI because many anatomic structures in the hip joint are only a few millimeters in dimension (the labrum, articular cartilage), and detection of pathology in the hip depends heavily on the ability to image with high-resolution and depict subtle alterations in the morphology of these small structures. For example, when we applied the high-resolution bone microarchitecture imaging sequence at 3 T in an osteoporotic subject (Figure 2g), the trabeculae were difficult to visualize. Third, the higher SNR available at 7 T could be converted into faster scanning, either through parallel imaging or pulse sequence optimization. The ability to image faster at 7 T would decrease the risk of patient discomfort or motion artifact during high-resolution imaging. It would also permit time for the application of advanced imaging techniques, such as biochemical MRI techniques, within a clinical time slot. Though we have not addressed biochemical MRI techniques in this study, the higher SNR available at 7 T facilitates the imaging of low gamma-nuclei (e.g., sodium MRI, which is used to evaluate cartilage proteoglycan content), and the greater chemical shift dispersion at 7 T facilitates the performance of magnetic resonance spectroscopy. In sum, MRI at 7 T offers the possibility of performing a comprehensive assessment of the musculoskeletal system, which would include a high-resolution morphologic exam and a physiologic/biochemical exam, all within clinical time slot.
This study has limitations. First, we scanned a relatively small number of subjects (n=15). However, we felt that this sample size was sufficient to accomplish the goal of this study, which was to demonstrate the feasibility of performing a comprehensive hip MRI protocol at 7 T. Second, although GRE sequences deployed in this work were not limited by SAR restrictions, more work is required to alleviate SAR limits to allow a greater number of slices in FSE acquisitions (limited to 9 in this study). In the future, a combination of FSE pulse sequence modifications to reduce SAR (e.g., increased refocusing pulse duration or implementation of hyperecho techniques (40)), a better understanding of electrical fields generated by the transmit coils (e.g. through coil simulations), efficient radiofrequency shimming(7), and parallel imaging may permit full coverage of the hip joint within SAR limits while maintaining reasonable scan times. Third, we acknowledge that 7 T MRI scanners are not widely available, let alone the hardware and the onsite scientific/engineering expertise to perform parallel transmit MRI at 7 T. Nevertheless, over the last decade, there has been a rapid proliferation in 7 T MRI scanners at academic medical centers worldwide (41). As the benefit of 7 T MRI and parallel transmit techniques become more recognized, we believe that more research groups and medical centers will establish the expertise and capability of performing these techniques.
In conclusion, we have demonstrated the feasibility of performing a comprehensive protocol for MRI of the hip at 7 T, including bone microarchitecture, high-resolution cartilage, and clinical imaging. We have shown that with 7 T MRI it is possible to: 1) depict individual trabeculae within the proximal femur in vivo; 2) perform high-resolution cartilage MRI of the hip joint with T1-weighted 3-D gradient echo sequences, which are preferred for quantitation of cartilage thickness and volume; 3) perform fast spin-echo imaging both without and with fat suppression, which are standard sequences for clinical hip MRI; and 4) acquire the above images both without and with the use of a parallel transmit setup. Altogether, the demonstration of the feasibility of 7 T hip MRI should pave the way for future studies investigating the role of abnormalities in bone microarchitecture and cartilage in the pathogenesis of osteoporosis and osteoarthritis at the hip. In the future, a combination of high-resolution morphologic proton imaging methods and physiologic imaging methods at 7 T (e.g., sodium imaging) may allow unique insight into the pathogenesis of different hip disorders or the ability to detect disease changes in the hip joint in its earliest stages.
Acknowledgments
Grant Support: NIAMS/NIH K23-AR059748 (PI Chang), NIBIB/NIH R01-EB011551 (PI Zhu), NIBIB/NIH RO1-EB002568 (PI Sodickson)
The authors would like to thank Pippa Storey, Ph.D., for help with pulse sequence optimization.
References
- 1.Regatte RR, Schweitzer ME. Ultra-high-field MRI of the musculoskeletal system at 7.0T. J Magn Reson Imaging. 2007;25(2):262–9. doi: 10.1002/jmri.20814. [DOI] [PubMed] [Google Scholar]
- 2.Krug R, Stehling C, Kelley DA, Majumdar S, Link TM. Imaging of the musculoskeletal system in vivo using ultra-high field magnetic resonance at 7 T. Invest Radiol. 2009;44(9):613–8. doi: 10.1097/RLI.0b013e3181b4c055. [DOI] [PubMed] [Google Scholar]
- 3.Moser E, Stahlberg F, Ladd ME, Trattnig S. 7-T MR--from research to clinical applications? NMR Biomed. 2012;25(5):695–716. doi: 10.1002/nbm.1794. [DOI] [PubMed] [Google Scholar]
- 4.Krug R, Carballido-Gamio J, Banerjee S, et al. In vivo bone and cartilage MRI using fully-balanced steady-state free-precession at 7 tesla. Magn Reson Med. 2007;58(6):1294–8. doi: 10.1002/mrm.21429. [DOI] [PubMed] [Google Scholar]
- 5.Magland JF, Rajapakse CS, Wright AC, Acciavatti R, Wehrli FW. 3D fast spin echo with out-of-slab cancellation: a technique for high-resolution structural imaging of trabecular bone at 7 Tesla. Magn Reson Med. 2010;63(3):719–27. doi: 10.1002/mrm.22213. [DOI] [PMC free article] [PubMed] [Google Scholar]
- 6.Trattnig S, Zbyn S, Schmitt B, et al. Advanced MR methods at ultra-high field (7 Tesla) for clinical musculoskeletal applications. Eur Radiol. 2012;22(11):2338–46. doi: 10.1007/s00330-012-2508-0. [DOI] [PubMed] [Google Scholar]
- 7.Deniz CM, Brown R, Lattanzi R, Alon L, Sodickson DK, Zhu Y. Maximum efficiency radiofrequency shimming: Theory and initial application for hip imaging at 7 tesla. Magn Reson Med. 2012 doi: 10.1002/mrm.24377. [DOI] [PMC free article] [PubMed] [Google Scholar]
- 8.Wang L, Wu Y, Chang G, et al. Rapid isotropic 3D-sodium MRI of the knee joint in vivo at 7T. J Magn Reson Imaging. 2009;30(3):606–14. doi: 10.1002/jmri.21881. [DOI] [PMC free article] [PubMed] [Google Scholar]
- 9.Chang G, Madelin G, Sherman OH, et al. Improved assessment of cartilage repair tissue using fluid-suppressed (2)(3)Na inversion recovery MRI at 7 Tesla: preliminary results. Eur Radiol. 2012;22(6):1341–9. doi: 10.1007/s00330-012-2383-8. [DOI] [PMC free article] [PubMed] [Google Scholar]
- 10.Trattnig S, Welsch GH, Juras V, et al. 23Na MR imaging at 7 T after knee matrix-associated autologous chondrocyte transplantation preliminary results. Radiology. 2010;257(1):175–84. doi: 10.1148/radiol.10100279. [DOI] [PubMed] [Google Scholar]
- 11.Madelin G, Babb JS, Xia D, Chang G, Jerschow A, Regatte RR. Reproducibility and repeatability of quantitative sodium magnetic resonance imaging in vivo in articular cartilage at 3 T and 7 T. Magn Reson Med. 2012;68(3):841–9. doi: 10.1002/mrm.23307. [DOI] [PMC free article] [PubMed] [Google Scholar]
- 12.Wang L, Salibi N, Wu Y, Schweitzer ME, Regatte RR. Relaxation times of skeletal muscle metabolites at 7T. J Magn Reson Imaging. 2009;29(6):1457–64. doi: 10.1002/jmri.21787. [DOI] [PMC free article] [PubMed] [Google Scholar]
- 13.Bogner W, Chmelik M, Andronesi OC, Sorensen AG, Trattnig S, Gruber S. In vivo 31P spectroscopy by fully adiabatic extended image selected in vivo spectroscopy: a comparison between 3 T and 7 T. Magn Reson Med. 2011;66(4):923–30. doi: 10.1002/mrm.22897. [DOI] [PubMed] [Google Scholar]
- 14.Chang G, Pakin SK, Schweitzer ME, Saha PK, Regatte RR. Adaptations in trabecular bone microarchitecture in Olympic athletes determined by 7T MRI. J Magn Reson Imaging. 2008;27(5):1089–95. doi: 10.1002/jmri.21326. [DOI] [PMC free article] [PubMed] [Google Scholar]
- 15.Banerjee S, Krug R, Carballido-Gamio J, et al. Rapid in vivo musculoskeletal MR with parallel imaging at 7T. Magn Reson Med. 2008;59(3):655–60. doi: 10.1002/mrm.21455. [DOI] [PubMed] [Google Scholar]
- 16.Welsch GH, Mamisch TC, Hughes T, et al. In vivo biochemical 7.0 Tesla magnetic resonance: preliminary results of dGEMRIC, zonal T2, and T2* mapping of articular cartilage. Invest Radiol. 2008;43(9):619–26. doi: 10.1097/RLI.0b013e31817e9122. [DOI] [PubMed] [Google Scholar]
- 17.Chang G, Wiggins GC, Xia D, et al. Comparison of a 28-channel receive array coil and quadrature volume coil for morphologic imaging and T2 mapping of knee cartilage at 7T. J Magn Reson Imaging. 2012;35(2):441–8. doi: 10.1002/jmri.23506. [DOI] [PMC free article] [PubMed] [Google Scholar]
- 18.Brown R, Zhang B, Cho GY, et al. Detunable transmit array and flexible receive array for 7T shoulder imaging. Proceedings of the International Society of Magnetic Resonance in Medicine; Melbourne, Australia. 2012; p. 428. [Google Scholar]
- 19.Metzger GJ, Snyder C, Akgun C, Vaughan T, Ugurbil K, Van de Moortele PF. Local B1+ shimming for prostate imaging with transceiver arrays at 7T based on subject-dependent transmit phase measurements. Magn Reson Med. 2008;59(2):396–409. doi: 10.1002/mrm.21476. [DOI] [PMC free article] [PubMed] [Google Scholar]
- 20.Kellman P, McVeigh ER. Image reconstruction in SNR units: a general method for SNR measurement. Magn Reson Med. 2005;54(6):1439–47. doi: 10.1002/mrm.20713. [DOI] [PMC free article] [PubMed] [Google Scholar]
- 21.Roemer PB, Edelstein WA, Hayes CE, Souza SP, Mueller OM. The NMR phased array. Magn Reson Med. 1990;16(2):192–225. doi: 10.1002/mrm.1910160203. [DOI] [PubMed] [Google Scholar]
- 22.Chang G, Rajapakse CS, Diamond M, et al. Micro-finite element analysis applied to high resolution MRI reveals improved bone mechanical competence in the distal femur of femal professional dancers. Osteoporos Int. 2012 doi: 10.1007/s00198-012-2105-8. [DOI] [PMC free article] [PubMed] [Google Scholar]
- 23.Chang G, Wang L, Liang G, Babb JS, Saha PK, Regatte RR. Reproducibility of subregional trabecular bone micro-architectural measures derived from 7-Tesla magnetic resonance images. MAGMA. 2011;24(3):121–5. doi: 10.1007/s10334-010-0243-6. [DOI] [PMC free article] [PubMed] [Google Scholar]
- 24.Krug R, Banerjee S, Han ET, Newitt DC, Link TM, Majumdar S. Feasibility of in vivo structural analysis of high-resolution magnetic resonance images of the proximal femur. Osteoporos Int. 2005;16(11):1307–14. doi: 10.1007/s00198-005-1907-3. [DOI] [PubMed] [Google Scholar]
- 25.Recht MP, Piraino DW, Paletta GA, Schils JP, Belhobek GH. Accuracy of fat-suppressed three-dimensional spoiled gradient-echo FLASH MR imaging in the detection of patellofemoral articular cartilage abnormalities. Radiology. 1996;198(1):209–12. doi: 10.1148/radiology.198.1.8539380. [DOI] [PubMed] [Google Scholar]
- 26.Eckstein F, Burstein D, Link TM. Quantitative MRI of cartilage and bone: degenerative changes in osteoarthritis. NMR Biomed. 2006;19(7):822–54. doi: 10.1002/nbm.1063. [DOI] [PubMed] [Google Scholar]
- 27.Zheng ZZ, Shan H, Li X. Fat-suppressed 3D T1-weighted gradient-echo imaging of the cartilage with a volumetric interpolated breath-hold examination. AJR Am J Roentgenol. 2010;194(5):W414–9. doi: 10.2214/AJR.09.2423. [DOI] [PubMed] [Google Scholar]
- 28.Burge R, Dawson-Hughes B, Solomon DH, Wong JB, King A, Tosteson A. Incidence and economic burden of osteoporosis-related fractures in the United States, 2005–2025. J Bone Miner Res. 2007;22(3):465–75. doi: 10.1359/jbmr.061113. [DOI] [PubMed] [Google Scholar]
- 29.Wehrli FW. Structural and functional assessment of trabecular and cortical bone by micro magnetic resonance imaging. J Magn Reson Imaging. 2007;25(2):390–409. doi: 10.1002/jmri.20807. [DOI] [PubMed] [Google Scholar]
- 30.Link TM. Osteoporosis imaging: state of the art and advanced imaging. Radiology. 2012;263(1):3–17. doi: 10.1148/radiol.12110462. [DOI] [PMC free article] [PubMed] [Google Scholar]
- 31.Majumdar S. Magnetic resonance imaging of trabecular bone structure. Top Magn Reson Imaging. 2002;13(5):323–34. doi: 10.1097/00002142-200210000-00004. [DOI] [PubMed] [Google Scholar]
- 32.Chen H, Zhou X, Shoumura S, Emura S, Bunai Y. Age- and gender-dependent changes in three-dimensional microstructure of cortical and trabecular bone at the human femoral neck. Osteoporos Int. 2010;21(4):627–36. doi: 10.1007/s00198-009-0993-z. [DOI] [PubMed] [Google Scholar]
- 33.Cui WQ, Won YY, Baek MH, et al. Age-and region-dependent changes in three-dimensional microstructural properties of proximal femoral trabeculae. Osteoporos Int. 2008;19(11):1579–87. doi: 10.1007/s00198-008-0601-7. [DOI] [PubMed] [Google Scholar]
- 34.Milovanovic P, Djonic D, Marshall RP, et al. Micro-structural basis for particular vulnerability of the superolateral neck trabecular bone in the postmenopausal women with hip fractures. Bone. 2012;50(1):63–8. doi: 10.1016/j.bone.2011.09.044. [DOI] [PubMed] [Google Scholar]
- 35.Phan CM, Matsuura M, Bauer JS, et al. Trabecular bone structure of the calcaneus: comparison of MR imaging at 3.0 and 1.5 T with micro-CT as the standard of reference. Radiology. 2006;239(2):488–96. doi: 10.1148/radiol.2392050574. [DOI] [PubMed] [Google Scholar]
- 36.Du J, Hermida JC, Diaz E, et al. Assessment of cortical bone with clinical and ultrashort echo time sequences. Magn Reson Med. 2012 doi: 10.1002/mrm.24497. [DOI] [PubMed] [Google Scholar]
- 37.Disler DG, McCauley TR, Wirth CR, Fuchs MD. Detection of knee hyaline cartilage defects using fat-suppressed three-dimensional spoiled gradient-echo MR imaging: comparison with standard MR imaging and correlation with arthroscopy. AJR Am J Roentgenol. 1995;165(2):377–82. doi: 10.2214/ajr.165.2.7618561. [DOI] [PubMed] [Google Scholar]
- 38.Chang CY, Huang AJ. MR Imaging of Normal Hip Anatomy. Magn Reson Imaging Clin N Am. 2013;21(1):1–19. doi: 10.1016/j.mric.2012.08.006. [DOI] [PubMed] [Google Scholar]
- 39.Ellermann J, Goerke U, Morgan P, et al. Simultaneous bilateral hip joint imaging at 7 Tesla using fast transmit B(1) shimming methods and multichannel transmission - a feasibility study. NMR Biomed. 2012;25(10):1202–8. doi: 10.1002/nbm.2779. [DOI] [PMC free article] [PubMed] [Google Scholar]
- 40.Hennig J, Scheffler K. Hyperechoes. Magn Reson Med. 2001;46(1):6–12. doi: 10.1002/mrm.1153. [DOI] [PubMed] [Google Scholar]
- 41.Robitaille P-M, Berliner LJ. Ultra high-field magnetic resonance imaging. New York, NY: Springer; 2006. [Google Scholar]


