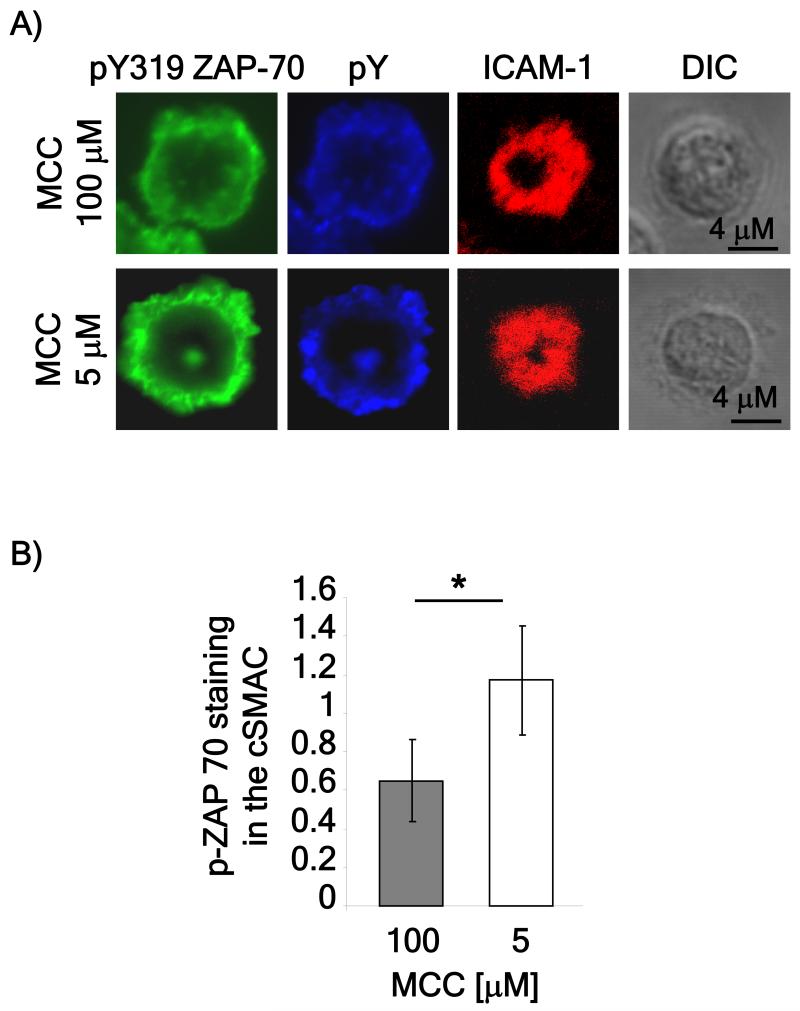
Figure 3. Phosphorylated ZAP70 is detected in the cSMAC.
A) Naïve CD4 T cells were isolated from spleens of AND mice and prepared as described in Figure 2 except that anti-phospho-319 ZAP-70 antibodies were used. The images are representative of over 50 cells obtained in three independent experiments. B) The localization of anti-phospho-319 ZAP-70 staining of the bilayers in A was measured using ImageJ software and represented as the ratio between phospho-319 ZAP-70 staining in the cSMAC compared to the pSMAC. P value (* < 0.01) was obtained using the Student’s t test.

