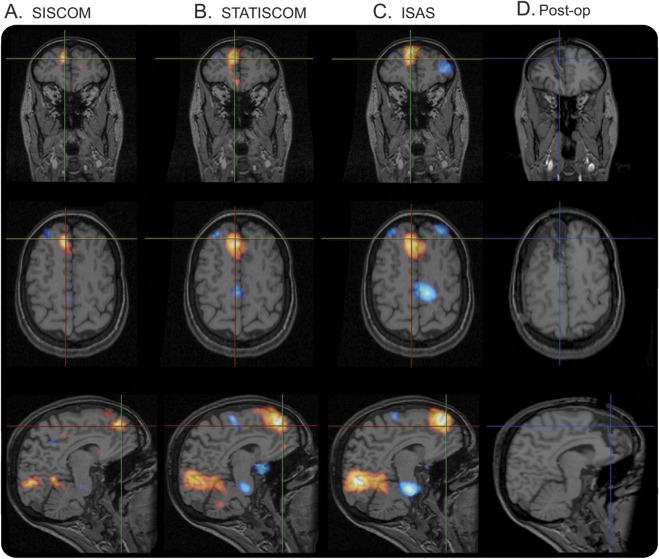
Figure 2. SISCOM, STATISCOM, and ISAS demonstrate areas of hyperperfusion.
The images ([A] subtraction ictal–interictal SPECT coregistered with MRI [SISCOM], [B] statistical ictal SPECT coregistered to MRI analysis [STATISCOM], [C] ictal–interictal SPECT analyzed by statistical parametric mapping [ISAS]) show area of hyperperfusion in right frontal lobe in a patient who was ultimately rendered seizure-free. Postoperative MRI (D) demonstrates good overlap of hyperperfusion (in warm color scale) with the region of focal cortical resection.

