

Abstract
Objective
We investigated if the differences in liver fat content would predict the development of non-fatal and fatal atherosclerotic endpoints (coronary heart disease and stroke).
Design, setting and participants
Our study group is a population-based, randomly recruited cohort (Oulu Project Elucidating Risk of Atherosclerosis, OPERA), initiated in 1991. The cohort consisted of 988 middle-aged Finnish participants.
Intervention
Total mortality and hospital events were followed up to 2009 based on the registry of the National Institute for Health and Welfare and the National death registry.
Main outcome measure
The severity of hepatic steatosis was measured by ultrasound and divided into three groups (0–2). Cox regression analysis was used in the statistical analysis.
Results
In the follow-up of years 1991–2009, 13.5% of the participants with non-fatty liver, 24.2% of participants having moderate liver fat content and 29.2% of the participants having severe fatty liver experienced a cardiovascular event during the follow-up time (p<0.001). Severe liver fat content predicted the risk for future risk of cardiovascular event even when adjusted for age, gender and study group (HR 1.92, CI 1.32 to 2.80, p<0.01). When further adjustments for smoking, alcohol consumption, low-density lipoprotein-cholesterol, body mass index and systolic blood pressure were conducted, the risk still remained statistically significant (HR 1.74, CI 1.16 to 2.63, p<0.01). Statistical significance disappeared with further adjustment for QUICKI.
Conclusions
Liver fat content increases the risk of future cardiovascular disease event in long-term follow-up but it is seems to be dependent on insulin sensitivity.
Strengths and limitations of this study.
This is a follow-up study with a large population-based study group and a very long follow-up time.
Official registers used in event diagnoses—data are accurate and the classification is systematic.
Grade of liver brightness was measured by ultrasound, which has a high specificity but low sensitivity.
Introduction
Non-alcoholic fatty liver disease (NAFLD) refers to liver disorders such as abnormal fat content, which exists in a spectrum ranging from steatosis with no inflammation to non-alcoholic steatohepatitis (NASH), which can ultimately lead to liver cirrhosis.1 The prevalence of NAFLD is estimated to range from 20% to 30% of population in Western countries, being the leading cause of liver disorders.2 3 It is associated with obesity, type 2 diabetes mellitus (T2DM) and hyperlipidaemia.1 NAFLD is commonly regarded as a hepatic manifestation of the metabolic syndrome and both conditions share several risk factors for cardiovascular disease (CVD).3 4
In 2008, the prevalence of CVD in adults (≥20 years) in USA was 36.2%.5 Every year, 4.3 million participants die from CVD in Europe causing nearly half of all the deaths (48%).6 So-called traditional risk factors for CVD are age, gender, smoking, high low-density lipoprotein (LDL) cholesterol concentration, hypertension and diabetes.7 In addition, total body fatness as well as abdominal fat accumulation increase independently the risk of CVD and insulin resistance is regarded to be an important factor linking visceral adiposity to cardiovascular risk.8 Adipose tissue is now recognised as a significant endocrine organ as adipocytes and macrophages infiltrating adipocytes secrete a number of bioactive mediators.7 Adipokines, proinflammatory cytokines and hypofibrinolytic markers may lead to oxidative stress and endothelial dysfunction, finally leading to atherosclerosis.9
Hepatic steatosis has been discussed as a possible mechanism to explain CVD morbidity and mortality.10 Patients with NAFLD have been reported to have higher coronary heart disease (CHD) risk than the general population of the same age and gender.11 According to previous study, liver dysfunction associated with CVD mortality in men12 whereas another large study found no association between NAFLD and CVD in general population.13 In addition, a fatty liver did not predict CVD mortality and morbidity in patients with established coronary artery disease.14
The NAFLD and CVD share several molecular mechanisms.15 16 Fatty liver might play a part in the pathogenesis of CVD through the overexpression and systemic release of several inflammatory, haemostatic17 and oxidative-stress mediators or via contributing to whole-body insulin resistance and atherogenic dyslipidaemia.3 NAFLD has also been reported to be linked with circulatory endothelial dysfunction.4 14 Several investigators have reported that NAFLD is associated with coronary artery disease4 14 and increased carotid intima-media thickness.18 19 Increased γ-glutamyltransferase (GGT), which may be a marker of NAFLD, has been reported to be associated with stroke.20
It is known that participants with fatty liver disease have an increased risk of suffering from CVD,4 but whether NAFLD is an independent indicator of CVD is still far from clear. Long-term follow-up studies are needed to clarify the correlation between fatty liver and CVD. The aim of our study was to investigate if fatty liver could predict independently the risk for total mortality as well as non-fatal and fatal cardiovascular endpoints with a 19-year follow-up after adjusting for all known conventional risk factors.
Materials and methods
Human participants
Oulu Project Elucidating Risk of Atherosclerosis (OPERA) is a population-based, epidemiological prospective cohort study designed to address the risk factors and disease end points of atherosclerotic CVDs. Selection criteria of the study participants have been described earlier.21 In short, a total of 520 men and 525 women participated: 259 control men, 261 hypertensive men, 267 control women and 258 hypertensive women aged 40–59 years. Hypertensive participants were randomly selected from the national register for reimbursement of the costs of antihypertensive medication. For each hypertensive participant, an age-matched and a sex-matched control participant was randomly selected from the same register. Informed consent in writing was obtained from each patient.
Determination of hepatic steatosis
The determination of hepatic steatosis was based on liver-kidney contrast22 measured with ultrasonography23 by one trained radiologist with 10 years’ experience in abdominal ultrasound examinations. Normal liver parenchyma should be slightly more echogenic (brighter) than the kidney parenchyma. In a case of increased liver echogenicity an ultrasound diagnosis of bright liver was settled. The severity of hepatic steatosis was based on the brightness of the liver and it was classified into three groups ranging from 0 to 2 (0=normal bright, indicating a non-fatty liver, 1=medium bright, a moderate lipid content and 2=clearly bright, a severe lipid content and fatty liver).24
Follow-up
Both the hypertensive and the control men were recruited during December 1990–May 1992 and the women approximately 1 year later (n=1045). In total, 1023 participants had a liver ultrasound result available at baseline. Mortality data were obtained from the National Death Registry and the diagnoses of cardiovascular events were based on the registry of the National Institute for Health and Welfare. The follow-up time ended 31 December 2009 or whenever the first event occurred. Cardiovascular events included fatal and non-fatal endpoints. Participants with a previous hospital-diagnosed myocardial infarction or stroke (n=41) at baseline were excluded. In total, 988 participants participated in this part of the study.
CVD included a major CHD event and stroke (excluding subarachnoid haemorrhage, SAH)—whichever of these happened first.25 The evidence of CHD was based on the following diagnosis: I20.0, I21, I22 (ICD-10, International Statistical Classification of Diseases and Related Health Problems)/410, 4110 (ICD-8/9) as the main diagnosis (symptom or cause) and I21, I22 (ICD-10)/410 (ICD-8/9) as a first side diagnosis (symptom or cause) or second side diagnosis (symptom or cause) and third side diagnosis (ICD-8/9 only) or if a participant had undergone coronary artery bypass graft surgery or angioplasty. CHD as a cause of death included I20-I25, I46, R96, R98 (ICD-10)/410–414, 798 (not 7980A) (ICD-8/9) as the underlying cause of death or immediate cause of death and I21 or I22 (ICD-10)/410 (ICD-8/9) as first to third contributing cause of death. Stroke (excluding SAH) included I61, I63 (not I636), I64 (ICD-10)/431, 4330A, 4331A, 4339A, 4340A, 4341A, 4349A, 436 (ICD-9)/431 (except 43101, 43191) 433, 434, 436 (ICD-8) as main diagnosis (symptom or cause) or as a first or second side diagnosis (symptom or cause) or as a third side diagnosis (ICD-8/9 only) or as an underlying cause of death or immediate cause of death or as a first to third contributing cause of death.26
Laboratory analyses
Waist circumference, body mass index (BMI) and blood pressure were measured as described in the previous study.21
All the laboratory test samples were obtained after an overnight fast. Blood insulin and glucose concentrations were analysed at 0, 60 and 120 min after administration of 75 g glucose.24 Insulin sensitivity was assessed using fasting plasma insulin concentrations and a quantitative insulin sensitivity check index (QUICKI) {(QUICKI=1/(log (fasting insulin)+log (fasting glucose)))}.27
Very-low-density lipoprotein, high-density lipoprotein, LDL and high-sensitivity C reactive protein (hs-CRP) concentrations24 as well as alanine aminotransferase (ALT) and GGT levels were measured as described previously.23 Alcohol consumption and smoking history were determined by validated questionnaires.28 Alcohol consumption was divided into three groups: 0 (n=161) mean alcohol consumption less than 1 g/week in men and women, 1 (n=767) mean consumption less than 210 g/week in men and less than 140 g/week in women, 2 (n=76) mean alcohol consumption more than 210 g/week in men and more than 140 g/week in women. Group 2 designates large-scale alcohol consumers according to the guidelines.29
Statistical analysis
Statistical analysis was performed by using IBM SPSS Statistics for Windows, V.20.0 (Armonk, NY: IBM Corp.). Analysis of variance was used to compare the means of the variables measured. Post hoc tests were performed using the Tukey method. Statistical significances between percentages were measured by using χ2 test. Cumulative survival rates were estimated using Kaplan-Meier method. Cox regression analysis was performed to investigate if liver brightness (fat) could predict the future risk for total mortality, cardiovascular death or hospital events. A p value <0.05 was regarded as significant.
Skewed variables (smoking, alcohol consumption, fasting insulin, fasting glucose, triglyceride, ALT, GGT concentration, hs-CRP level) were logarithmically transformed to improve normality before analysis of variance. We used three models with progressive degrees of adjustments. Model 1 included study group (participants with medicine-treated hypertension and their age-matched and sex-matched controls), age and gender. Model 2 included further adjustments for smoking, alcohol consumption, systolic blood pressure, LDL-cholesterol level and BMI. Model 3 included further adjustment for QUICKI. We carried out sensitivity analyses: in the analyses of cardiovascular events, we added all covariates one by one and investigated if the HR changed or remained stable when further adjustment with one covariate was performed. Model 4 included variables which were stable and were statistically significant in intermediate phases. Model 5 included stable and significant covariates without QUICKI (table 1).
Table 1.
Multivariate analysis for cardiovascular events with different degrees of adjustments (Cox regression analysis)
| Model 1 | Model 2 | Model 3 | Model 4 | Model 5 | |
|---|---|---|---|---|---|
| Moderate fat content | 1.51 (0.99 to 2.29) | 1.44 (0.93 to 2.23) | 1.31 (0.84 to 2.05) | 1.30 (0.84 to 2.01) | 1.49 (0.99 to 2.26) |
| Severe fat content | 1.92 (1.32 to 2.80)** | 1.74 (1.16 to 2.63)** | 1.49 (0.97 to 2.30) | 1.43 (0.93 to 2.18) | 1.76 (1.21 to 2.56)** |
| Study group | 1.34 (0.98 to 1.85) | 1.29 (0.92 to 1.80) | 1.28 (0.92 to 1.78) | ||
| Age | 1.06 (1.03 to 1.09)*** | 1.05 (1.02 to 1.08)** | 1.05 (1.02 to 1.08)** | 1.05 (1.02 to 1.07)** | 1.05 (1.02 to 1.08)** |
| Gender | 2.39 (1.71 to 3.34)* | 1.91 (1.34 to 2.71)*** | 1.80 (1.26 to 2.57)** | 1.83 (1.29 to 2.60)** | 1.92 (1.36 to 2.72)*** |
| LDL-cholesterol | 1.17 (0.99 to 1.39) | 1.15 (0.97 to 1.37) | |||
| Smoking (pack-years) | 1.02 (1.01 to 1.03)*** | 1.02 (1.01 to 1.03)*** | 1.02 (1.01 to 1.03)*** | 1.02 (1.01 to 1.03)*** | |
| Alcohol consumption (group 1) | 0.93 (0.59 to 1.45) | 0.92 (0.59 to 1.44) | |||
| Alcohol consumption (group 2) | 0.84 (0.44 to 1.60) | 0.81 (0.42 to 1.54) | |||
| Systolic blood pressure | 1.01 (1.00 to 1.02)** | 1.01 (1.00 to 1.02)* | 1.01 (1.00 to 1.02)** | 1.01 (1.00 to 1.02)** | |
| Body mass index | 0.99 (0.96 to 1.03) | 0.97 (0.93 to 1.01) | |||
| QUICKI | 0.12 (0.02 to 0.90)* | 0.16 (0.03 to 0.99)* |
CVD event occurred in 13.5% of the participants with no fat in the liver (97/720), 24.2% (30/124) of participants having moderate liver fat content and 29.2% (42/144) of the participants having severe fatty liver. HRs with 95% CI with different degrees of adjustments are presented. Alcohol consumption was divided into groups (reference group: less than 1 g/week in men and women, group 1: less than 210 g/week in men and less than 140 g/week in women, group 2: more than 210 g/week in men and more than 140 g/week in women). Model 1: adjustment for study group, age and gender. Model 2: further adjustments for LDL-cholesterol, smoking, alcohol consumption, systolic blood pressure and body mass index. Model 3: further adjustment for QUICKI. Model 4: adjustments with statistically significant covariates. Model 5: adjustments with statistically significant covariates without QUICKI. *p<0.05,**p<0.01,***p<0.001.
CVD, cardiovascular disease; LDL, low-density lipoprotein; QUICKI, quantitative insulin sensitivity check index.
C-index was calculated for the models 1, 3, 4 and 5 to assess the discrimination of the risk markers. The analyses were performed in 250 bootstrap resamplings to obtain 95% CI for c-index of each model.
Results
The main baseline characteristics of the study group are shown in table 2.
Table 2.
Baseline characteristics of the study group as means (SDs) or percentages
| Grade of liver brightness | 0 (n=720) | 1 (n=124) | 2 (n=144) | p | p (0–1) | p (1–2) | p (0–2) |
|---|---|---|---|---|---|---|---|
| Age (years) | 50.9 (6.0) | 51.9 (6.1) | 51.5 (5.5) | NS | NS | NS | NS |
| Males | 44.3% (n=319) | 65.3% (n=81) | 59.9% (n=82) | <0.001 | – | – | – |
| Hypertensives | 41.4% (n=298) | 66.1% (n=82) | 71.5% (n=103) | <0.001 | – | – | – |
| BMI (kg/m²) | 26.4 (3.9) | 29.8 (5.0) | 31.9 (4.9) | <0.001 | <0.001 | <0.001 | <0.001 |
| Waist circumference (cm) | 86.8 (11.9) | 97.7 (12.0) | 102.3 (11.8) | <0.001 | <0.001 | <0.01 | <0.001 |
| Smoking (pack-years) | 10.6 (13.3) | 14.3 (14.9) | 14.0 (14.6) | <0.05 | NS | NS | NS |
| Alcohol consumption (g/week) | 51.1 (83.0) | 95.1 (117.0) | 82.6 (105.1) | <0.01 | <0.05 | NS | NS |
| Total serum cholesterol (mmol/L) | 5.6 (1.0) | 5.8 (1.1) | 5.8 (1.1) | NS | NS | NS | NS |
| LDL (mmol/L) | 3.5 (0.9) | 3.7 (1.1) | 3.5 (0.9) | NS | NS | NS | NS |
| Triglycerides (mmol/L) | 1.4 (0.8) | 1.9 (0.8) | 2.2 (1.4) | <0.001 | <0.001 | <0.05 | <0.001 |
| Systolic blood pressure (mmHg) | 145.2 (21.5) | 152.7 (20.3) | 157.1 (22.2) | <0.001 | <0.01 | NS | <0.001 |
| Fasting insulin (mmol/L) | 10.8 (7.7) | 18.2 (10.3) | 23.8 (17.6) | <0.001 | <0.001 | <0.001 | <0.001 |
| Fasting glucose (mmol/L) | 4.4 (0.7) | 5.0 (1.4) | 6.1 (2.8) | <0.001 | <0.001 | <0.001 | <0.001 |
| QUICKI | 0.6 (0.1) | 0.6 (0.1) | 0.5 (0.1) | <0.001 | <0.001 | <0.001 | <0.001 |
| hs-CRP (ng/mL) | 3039.4 (6758.3) | 3981.4 (6068.2) | 6122.0 (6630.8) | <0.001 | <0.001 | <0.01 | <0.001 |
| ALT U/L | 26.2 (15.5) | 37.8 (17.1) | 55.4 (37.7) | <0.001 | <0.001 | <0.001 | <0.001 |
| GGT U/L | 35.1 (33.5) | 69.7 (116.3) | 76.8 (92.4) | <0.001 | <0.001 | <0.01 | <0.001 |
| Antihypertensive treatment | 43.6% (n=314) | 66.9% (n=83) | 72.9% (n=105) | <0.001 | – | – | – |
| Lipid-lowering treatment | 2.2% (n=16) | 1.6% (n=2) | 6.2% (n=9) | <0.05 | – | – | – |
| Hypoglycaemic drug | 1.1% (n=8) | 1.6% (n=2) | 10.4% (n=15) | <0.001 | – | – | – |
| Type 2 diabetes | 2.4% (n=17) | 12.1% (n=15) | 36.8% (n=53) | <0.001 | – | – | – |
ALT, alanine aminotransferase; BMI, body mass index; GGT, γ-glutamyltransferase; hs-CRP, high-sensitivity C reactive protein; LDL, low-density lipoprotein; N, number of participants; NS, not significant; QUICKI, quantitative insulin sensitivity check index.
Incidence of CVD
The median follow-up time was 212 (maximum 228) months. During the follow-up time, 13.5% of the participants with no fat in the liver (97/720), 24.2% (30/124) of participants having moderate liver fat content and 29.2% (42/144) of the participants having severe fatty liver experienced a CVD event (p<0.001). CVD was the cause of death in 3.6% of the participants with non-fatty liver (26/720) and 8.1% of the participants with moderate liver fat content (10/124), while 12.5% (18/144) of the participants with severe fatty liver (p<0.001; table 3).
Table 3.
CVD, CHD and stroke follow-up data of the study group as percentages (number of events)
| Grade of liver brightness | Total | 0 (n=720) | 1 (n=124) | 2 (n=144) | p Value |
|---|---|---|---|---|---|
| Non-fatal events | |||||
| CVD | 11.6% (115) | 9.9% (71) | 16.1% (20) | 16.7% (24) | <0.05 |
| CHD | 7.8% (77) | 6.5% (47) | 11.3% (14) | 11.1% (16) | NS |
| Stroke | 5.0% (49) | 4.2% (30) | 8.1% (10) | 6.2% (9) | NS |
| Fatal events | |||||
| CVD | 5.5% (54) | 3.6% (26) | 8.1% (10) | 12.5% (18) | <0.001 |
| CHD | 4.8% (47) | 3.2% (23) | 7.3% (9) | 10.4% (15) | <0.01 |
| Stroke | 0.8% (8) | 0.6% (4) | 0.8% (1) | 2.1% (3) | NS |
Statistical significances between percentages were measured by using χ2 test. CVD included a major CHD event and stroke (excluding subarachnoid haemorrhage)—whichever of these happened first.
CHD, coronary heart disease; CVD, cardiovascular disease; N, number of participants.
Severe liver fat content predicted the risk for future risk of cardiovascular event when adjusted for age, gender and study group (model 1: HR 1.92, CI 1.32 to 2.80, p<0.01; table 1). When further adjustments were made for smoking, alcohol consumption, LDL-cholesterol, BMI and systolic blood pressure (model 2: HR 1.74, CI 1.16 to 2.63), the risk still remained statistically significant (p<0.01). Statistical significance disappeared when further adjustment for QUICKI was performed (model 3: HR 1.49, CI 0.97 to 2.30, p=0.071). In the CVD event sensitivity analyses, all covariates were added one by one and it was examined whether the HRs would change or remain stable. After adjusting for the statistically significant variables (including quick index) in the sensitivity analyses, the association between severe fatty liver was no longer significant (model 4: HR 1.43, CI 0.93 to 2.18, p=0.10). When QUICKI was not added into model 5, severe fatty liver did predict the risk for future risk for CVD event (HR 1.76, CI 1.21 to 2.56, p<0.001; table 1). The c-index decreased when the risk factors were removed from the model (table 4).
Table 4.
Multivariate analysis for cardiovascular events (logistic regression analysis)
| Final model | Cardiovascular event c-index (95% CI) | Binary R2 |
|---|---|---|
| Model 3 | 0.729 (0.706 to 0.776) | 0.153 |
| Model 4 | 0.720 (0.689 to 0.763) | 0.144 |
| Model 5 | 0.717 (0.686 to 0.758) | 0.138 |
| Model 1 | 0.698 (0.656 to 0.742) | 0.133 |
Cardiovascular disease risk factors have been removed from the models step by step.
Model 3 included liver brightness, study group, age, gender, smoking, alcohol consumption, systolic blood pressure, LDL-cholesterol level, body mass index and QUICKI. Model 4 included liver brightness, age, gender, smoking, blood pressure and QUICKI. Model 5 included liver brightness, age, gender, smoking and blood pressure. Model 1 included liver brightness, study group, age and gender. C-index with CIs obtained from 250 bootstrap resamplings and binary R2 was used.
LDL, low-density lipoprotein; QUICKI, quantitative insulin sensitivity check index.
The future risk of death from CVD in participants with severe fat content was significant when age, gender and study group were added as covariates (model 1: HR 2.95, CI 1.58 to 5.51, p<0.01). Even after further adjustments with other conventional risk factors (model 2: HR 2.04, CI 1.03 to 4.05), statistical significance remained (p<0.05). When QUICKI was added as the covariate, then significance disappeared (model 3: HR 1.64, CI 0.79 to 3.43, NS; figure 1).
Figure 1.
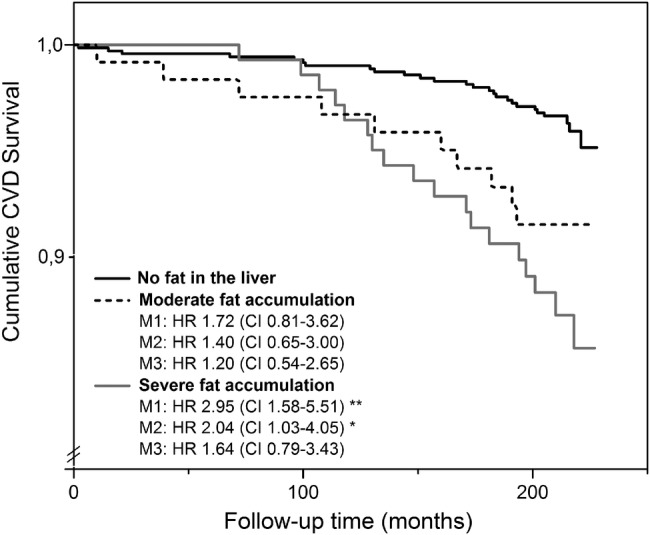
Kaplan-Meier cumulative survival rates censored for cardiovascular death in participants with no fat in the liver, moderate fat content and severe fat content. CVD was the cause of death in 3.6% of the participants (26/720) with non-fatty liver and 8.1% of the participants (10/124) with moderate liver fat content, while 12.5% of the participants with severe fatty liver (18/144). Cox regression analysis is used for adjustments. M1 (model 1): adjusted for study group, age and gender. M2 (model 2): further adjustments for smoking, alcohol consumption, systolic blood pressure, LDL-cholesterol level and body mass index. M3 (model 3): further adjustment for QUICKI. CVD, cardiovascular disease; QUICKI, quantitative insulin sensitivity check index. **p<0.01, *p<0.05.
Fatty liver and total mortality
In total, 11.9% of the participants not having fatty liver, 18.5% of the participants having moderate fatty liver and 22.2% of the participants with severe fatty liver died from all causes (p<0.01). According to model 1, severe fat content predicted the risk for mortality from all causes when age, gender and study group were added as covariates (HR 1.60, CI 1.05 to 2.43, p<0.05). The significance disappeared when BMI was added as a covariate (data not shown).
We performed all Cox regression analyses after excluding the men consuming more than 210 g alcohol and the women drinking more than 140 g alcohol per week. This exclusion did not have any effect on the results (data not shown).
We performed all Cox regression analyses after excluding patients with insulin-treated diabetes mellitus (n=9), cortisone treatment at baseline (n=41) and previous diagnosis for liver disease (n=15; eg, virus, medications). This exclusion did not have any effect on the results (data not shown).
Discussion
The incidences of NAFLD and CVD are continuously increasing in the Western world. The question if NAFLD is only a marker or also an early mediator of CVD is still largely unanswered. According to the results of the present study, which had an approximately 19-year follow-up fatty liver does predict the future risk for death from all causes, death from CVD and risk of cardiovascular events. Insulin sensitivity seems to play a more dominant role in the development of cardiovascular events.
Only a few studies have investigated the risk for future cardiovascular risk among participants with ultrasound-diagnosed fatty liver30 31 and larger studies with longer follow-up times are needed. An association between NAFLD and CVD has been reported3 30–32 although contrary results also exist.13 33 A previous large population-based prospective cohort study found no association between NAFLD and CVD, however they categorised the degree of steatosis as a two level variable: none to mild and moderate to severe.13 An association between ultrasound-diagnosed fatty liver and CVD has been reported in general population30 and in participants with T2DM.32 Furthermore, liver dysfunction has been reported to be associated with CVD mortality34 35 and CHD risk11 in follow-up studies and especially survival of participants with NASH is reported to be reduced.33 36 37 In the present study, severe fatty liver disease did predict the risk for cardiovascular death but the association seemed to be dependent on insulin sensitivity.
Several earlier studies have used self-reported CVD history which may not be totally reliable. Although earlier studies on the risk for future cardiovascular risk among participants with fatty liver have performed some adjustments, the full range of well-known CVD risk factors have been rarely considered.33 We have performed adjustments with all so-called traditional risk factors for CVD (ie, age, gender, smoking, LDL concentration, hypertension, insulin resistance). Previous studies have used biochemical, radiological and histological methodology for NAFLD diagnosis and staging, which leads to a challenging interpretation of the results.35 38
This study had an approximately 19-year follow-up time, which is longer than in previous studies.11–14 When compared to earlier studies33 38 this study seems to be the first follow-up study with a large population-based randomly selected study group and a very long follow-up time and ultrasound-diagnosed fatty liver. The diagnosis of cardiovascular events was based on the registry of the National Institute for Health and Welfare and mortality data were obtained from the National Death Registry. The earlier verified FINRISK classification26 was used to classify the events. Therefore, the reliability of event diagnosis data is accurate and the classification is systematic. All participants who had myocardial infarction or stroke before baseline were excluded because a history of myocardial infarction is known to increase the risk for recurrent myocardial infarction or cardiovascular death39 and medication as well as lifestyle secondary prevention strategies are intensive.40
There are a few follow-up-studies examining whether the fatty liver increases the risk for total mortality.13 41 In the present study, severe fatty liver predicted the risk for overall mortality of any causes when age, gender and study group were added covariates, a result in line with an earlier report.42 In the published literature, NASH rather than simple steatosis has been stated to be linked with decreased overall survival36 although one study with a large cohort found no association between NAFLD and overall mortality.13 In our study, the association between severe fatty liver and total mortality disappeared after further adjustment for BMI which means that severe fatty liver is not a strong predictor for overall mortality.
The molecular mechanisms linking fatty liver with CVD have been investigated.10 16 Enlarged visceral adipose tissue may explain why NAFLD associates with CVD.16 In individuals with visceral obesity, insulin resistance may contribute to impaired non-esterified fatty acid (NEFA) metabolism8 and the increasing NEFA flux to the liver may impair liver metabolism leading to increased glucose metabolism and liver dysfunction.7 The liver is one of the targets of the resulting systemic abnormalities and the source of several proatherogenic factors,3 such as CRP, fibrinogen, plasminogen activator inhibitor 1 and other inflammatory cytokines.16 Furthermore, visceral adipose tissue and ectopic fat overexpress factors involved in atherogenesis16 such as NEFAs and proinflammatory cytokines, for instance interleukin 6 and tumour necrosis factor α8 leading to chronic systemic inflammation. In addition, hepatic steatosis leads to overproduction of cholesterol-rich remnant particles.4
One limitation in this study is that the grade of liver brightness was measured by ultrasound. The invasive diagnostic technique of liver biopsy is regarded as the ‘golden standard’, especially for the diagnosis of NASH.43 Real-time ultrasound using a combination of sonographic findings does have a high specificity but it underestimates the prevalence of hepatic steatosis when there is less than 20% fat.44 Today, MR spectroscopy is regarded as the best method for the quantification of liver fat, but this method is limited due to its availability.45 Unfortunately quantitative measurement of liver fat by ultrasound is subject to several limitations compared to more validated and standardised methods for diagnosing NAFLD and the analysis of intraobserver reproducibility could have been more accurate in the present study. Nonetheless, the non-invasive ultrasound method was chosen because taking liver biopsies from large groups of symptomless participants would have been ethically unjustifiable and MR spectroscopy was not available at the baseline.
The OPERA study group consists of participants with drug-treated hypertension and randomly selected sex-matched and age-matched controls. Study group was added as a covariate to minimise any selection bias.
Conclusions
Severe liver fat content increased the risk of a future cardiovascular event and mortality to CVD over the long-term follow-up but it seemed to be dependent on insulin sensitivity. Fatty liver also predicted the risk for overall mortality. However, conventional CVD risk factors seemed to play a major role in developing death from all causes. It would be beneficial to investigate larger cohorts and follow-up studies in order to validate this result.
Supplementary Material
Acknowledgments
The authors would like to thank Markku Päivänsalo, MD, PhD, for the expert liver ultrasound examinations and Ms Saija Kortetjärvi, Ms Liisa Mannermaa and Ms Leena Ukkola for the excellent technical assistance. Elina Malo, PhD, and Meiju Saukko, PhD, are thanked for the cooperation in organising cardiovascular event and mortality data.
Footnotes
Contributors: PP participated in data acquisition, statistical analysis and data interpretation, manuscript writing, final approval of the version to be published. MS participated in data acquisition, statistical analysis and data interpretation, critical revision of the manuscript, final approval of the version to be published. RB participated in data analysis, data interpretation, critical revision of the manuscript, final approval of the version to be published. OU and YAK participated in study design, data acquisition, data interpretation, critical revision of the manuscript, final approval of the version to be published
Funding: This study was supported by the Finnish Foundation for Cardiovascular Research, dated 16 April 2012.
Competing interests: None.
Ethics approval: The study protocol conformed to the ethical guidelines of the 1975 Declaration of Helsinki and this study was approved by the Ethical Committee of the Faculty of Medicine, University of Oulu.
Provenance and peer review: Not commissioned; externally peer reviewed.
Data sharing statement: No additional data are available.
References
- 1.Angulo P. Nonalcoholic fatty liver disease . N Engl J Med 2002;346:1221–31 [DOI] [PubMed] [Google Scholar]
- 2.Armstrong MJ, Houlihan DD, Bentham L, et al. Presence and severity of non-alcoholic fatty liver disease in a large prospective primary care cohort . J Hepatol 2012;56:234–40 [DOI] [PubMed] [Google Scholar]
- 3.Targher G, Day CP, Bonora E. Risk of cardiovascular disease in patients with nonalcoholic fatty liver disease . N Engl J Med 2010;363:1341–50 [DOI] [PubMed] [Google Scholar]
- 4.Targher G, Arcaro G. Non-alcoholic fatty liver disease and increased risk of cardiovascular disease . Atherosclerosis 2007;191:235–40 [DOI] [PubMed] [Google Scholar]
- 5.Roger VL, Go AS, Lloyd-Jones DM, et al. Heart disease and stroke statistics-2011 update: a report from the American Heart Association . Circulation 2011;123:e18–209 [DOI] [PMC free article] [PubMed] [Google Scholar]
- 6.Allender S, Scarborough P, Peto V, et al. European cardiovascular disease statistics. European Heart Network, 2008 [Google Scholar]
- 7.Despres JP, Lemieux I. Abdominal obesity and metabolic syndrome . Nature 2006;444:881–7 [DOI] [PubMed] [Google Scholar]
- 8.Van Gaal LF, Mertens IL, De Block CE. Mechanisms linking obesity with cardiovascular disease . Nature 2006;444:875–80 [DOI] [PubMed] [Google Scholar]
- 9.Hansson GK. Inflammation, atherosclerosis, and coronary artery disease . N Engl J Med 2005;352:1685–95 [DOI] [PubMed] [Google Scholar]
- 10.Bhatia LS, Curzen NP, Byrne CD. Nonalcoholic fatty liver disease and vascular risk . Curr Opin Cardiol 2012;27:420–8 [DOI] [PubMed] [Google Scholar]
- 11.Treeprasertsuk S, Leverage S, Adams LA, et al. The Framingham risk score and heart disease in nonalcoholic fatty liver disease . Liver Int 2012;32:945–50 [DOI] [PMC free article] [PubMed] [Google Scholar]
- 12.Haring R, Wallaschofski H, Nauck M, et al. Ultrasonographic hepatic steatosis increases prediction of mortality risk from elevated serum gamma-glutamyl transpeptidase levels . Hepatology 2009;50:1403–11 [DOI] [PubMed] [Google Scholar]
- 13.Lazo M, Hernaez R, Bonekamp S, et al. Non-alcoholic fatty liver disease and mortality among US adults: prospective cohort study . BMJ 2011;343:d6891. [DOI] [PMC free article] [PubMed] [Google Scholar]
- 14.Wong VW, Wong GL, Yip GW, et al. Coronary artery disease and cardiovascular outcomes in patients with non-alcoholic fatty liver disease . Gut 2011;60:1721–7 [DOI] [PubMed] [Google Scholar]
- 15.Loria P, Lonardo A, Targher G. Is liver fat detrimental to vessels? Intersections in the pathogenesis of NAFLD and atherosclerosis . Clin Sci (Lond) 2008;115:1–12 [DOI] [PubMed] [Google Scholar]
- 16.Targher G, Marra F, Marchesini G. Increased risk of cardiovascular disease in non-alcoholic fatty liver disease: causal effect or epiphenomenon? . Diabetologia 2008;51:1947–53 [DOI] [PubMed] [Google Scholar]
- 17.Targher G, Bertolini L, Scala L, et al. Non-alcoholic hepatic steatosis and its relation to increased plasma biomarkers of inflammation and endothelial dysfunction in non-diabetic men. Role of visceral adipose tissue. Diabet Med 2005;22:1354–8 [DOI] [PubMed] [Google Scholar]
- 18.Brea A, Mosquera D, Martin E, et al. Nonalcoholic fatty liver disease is associated with carotid atherosclerosis: a case-control study . Arterioscler Thromb Vasc Biol 2005;25:1045–50 [DOI] [PubMed] [Google Scholar]
- 19.Sookoian S, Pirola CJ. Non-alcoholic fatty liver disease is strongly associated with carotid atherosclerosis: a systematic review . J Hepatol 2008;49:600–7 [DOI] [PubMed] [Google Scholar]
- 20.Fraser A, Harris R, Sattar N, et al. Gamma-glutamyltransferase is associated with incident vascular events independently of alcohol intake: analysis of the British Women's Heart and Health Study and Meta-Analysis . Arterioscler Thromb Vasc Biol 2007;27:2729–35 [DOI] [PubMed] [Google Scholar]
- 21.Rantala AO, Kauma H, Lilja M, et al. Prevalence of the metabolic syndrome in drug-treated hypertensive patients and control subjects. J Intern Med 1999;245:163–74 [DOI] [PubMed] [Google Scholar]
- 22.Yajima Y, Ohta K, Narui T, et al. Ultrasonographical diagnosis of fatty liver: significance of the liver-kidney contrast. Tohoku J Exp Med 1983;139:43–50 [DOI] [PubMed] [Google Scholar]
- 23.Sampi M, Veneskoski M, Ukkola O, et al. High plasma immunoglobulin (Ig) A and low IgG antibody titers to oxidized low-density lipoprotein are associated with markers of glucose metabolism . J Clin Endocrinol Metab 2010;95:2467–75 [DOI] [PubMed] [Google Scholar]
- 24.Pisto P, Ukkola O, Santaniemi M, et al. Plasma adiponectin—an independent indicator of liver fat accumulation . Metabolism 2011;60:1515–20 [DOI] [PubMed] [Google Scholar]
- 25.Santaniemi M, Ukkola O, Malo E, et al. Metabolic syndrome in the prediction of cardiovascular events: the potential additive role of hsCRP and adiponectin. Eur J Prev Cardiol 2013 [epub ahead of print 20 Jun 2013]. doi: 10.1177/2047487313494028 [DOI] [PubMed] [Google Scholar]
- 26.Pajunen P, Jousilahti P, Borodulin K, et al. Body fat measured by a near-infrared interactance device as a predictor of cardiovascular events: the FINRISK'92 cohort . Obesity (Silver Spring) 2011;19:848–52 [DOI] [PubMed] [Google Scholar]
- 27.Katz A, Nambi SS, Mather K, et al. Quantitative insulin sensitivity check index: a simple, accurate method for assessing insulin sensitivity in humans . J Clin Endocrinol Metab 2000;85:2402–10 [DOI] [PubMed] [Google Scholar]
- 28.Kauma H, Savolainen MJ, Rantala AO, et al. Apolipoprotein E phenotype determines the effect of alcohol on blood pressure in middle-aged men . Am J Hypertens 1998;11:1334–43 [DOI] [PubMed] [Google Scholar]
- 29.Bessembinders K, Wielders J, van de Wiel A. Severe hypertriglyceridemia influenced by alcohol (SHIBA) . Alcohol Alcohol 2011;46:113–16 [DOI] [PubMed] [Google Scholar]
- 30.Hamaguchi M, Kojima T, Takeda N, et al. Nonalcoholic fatty liver disease is a novel predictor of cardiovascular disease . World J Gastroenterol 2007;13:1579–84 [DOI] [PMC free article] [PubMed] [Google Scholar]
- 31.Stepanova M, Younossi ZM. Independent association between nonalcoholic fatty liver disease and cardiovascular disease in the US population . Clin Gastroenterol Hepatol 2012;10:646–50 [DOI] [PubMed] [Google Scholar]
- 32.Targher G, Bertolini L, Poli F, et al. Nonalcoholic fatty liver disease and risk of future cardiovascular events among type 2 diabetic patients . Diabetes 2005;54:3541–6 [DOI] [PubMed] [Google Scholar]
- 33.Ghouri N, Preiss D, Sattar N. Liver enzymes, nonalcoholic fatty liver disease, and incident cardiovascular disease: a narrative review and clinical perspective of prospective data . Hepatology 2010;52:1156–61 [DOI] [PubMed] [Google Scholar]
- 34.Dunn W, Xu R, Wingard DL, et al. Suspected nonalcoholic fatty liver disease and mortality risk in a population-based cohort study . Am J Gastroenterol 2008;103:2263–71 [DOI] [PMC free article] [PubMed] [Google Scholar]
- 35.Ruttmann E, Brant LJ, Concin H, et al. Gamma-glutamyltransferase as a risk factor for cardiovascular disease mortality: an epidemiological investigation in a cohort of 163,944 Austrian adults . Circulation 2005;112:2130–7 [DOI] [PubMed] [Google Scholar]
- 36.Soderberg C, Stal P, Askling J, et al. Decreased survival of subjects with elevated liver function tests during a 28-year follow-up . Hepatology 2010;51:595–602 [DOI] [PubMed] [Google Scholar]
- 37.Ekstedt M, Franzen LE, Mathiesen UL, et al. Long-term follow-up of patients with NAFLD and elevated liver enzymes . Hepatology 2006;44:865–73 [DOI] [PubMed] [Google Scholar]
- 38.Bhatia LS, Curzen NP, Calder PC, et al. Non-alcoholic fatty liver disease: a new and important cardiovascular risk factor? Eur Heart J 2012;33:1190–200 [DOI] [PubMed] [Google Scholar]
- 39.Beckman JA, Creager MA, Libby P. Diabetes and atherosclerosis: epidemiology, pathophysiology, and management . JAMA 2002;287:2570–81 [DOI] [PubMed] [Google Scholar]
- 40.Joseph P, Teo K. Optimal medical therapy, lifestyle intervention, and secondary prevention strategies for cardiovascular event reduction in ischemic heart disease . Curr Cardiol Rep 2011;13:287–95 [DOI] [PubMed] [Google Scholar]
- 41.Dam-Larsen S, Franzmann M, Andersen IB, et al. Long term prognosis of fatty liver: risk of chronic liver disease and death . Gut 2004;53:750–5 [DOI] [PMC free article] [PubMed] [Google Scholar]
- 42.Calori G, Lattuada G, Ragogna F, et al. Fatty liver index and mortality: the Cremona study in the 15th year of follow-up . Hepatology 2011;54:145–52 [DOI] [PubMed] [Google Scholar]
- 43.Joy D, Thava VR, Scott BB. Diagnosis of fatty liver disease: is biopsy necessary? Eur J Gastroenterol Hepatol 2003;15:539–43 [DOI] [PubMed] [Google Scholar]
- 44.Dasarathy S, Dasarathy J, Khiyami A, et al. Validity of real time ultrasound in the diagnosis of hepatic steatosis: a prospective study . J Hepatol 2009;51:1061–7 [DOI] [PMC free article] [PubMed] [Google Scholar]
- 45.Szczepaniak LS, Nurenberg P, Leonard D, et al. Magnetic resonance spectroscopy to measure hepatic triglyceride content: prevalence of hepatic steatosis in the general population . Am J Physiol Endocrinol Metab 2005;288:E462–8 [DOI] [PubMed] [Google Scholar]
Associated Data
This section collects any data citations, data availability statements, or supplementary materials included in this article.