

Abstract
Purpose
The dichotomous effect of thiamine supplementation on cancer cell growth is characterized by growth stimulation at low doses and growth suppression at high doses. Unfortunately, how thiamine reduces cancer cell proliferation is currently unknown. Recent focuses on metabolic targets for cancer therapy have exploited the altered regulation of the thiamine-dependent enzyme pyruvate dehydrogenase (PDH). Cancer cells inactivate PDH through phosphorylation by overexpression of pyruvate dehydrogenase kinases (PDKs). Inhibition of PDKs by dichloracetate (DCA) exhibits a growth suppressive effect in many cancers. Recently it has been shown that the thiamine co-enzyme, thiamine pyrophosphate reduces PDK mediated phosphorylation of PDH. Therefore, the objective of this study was to determine if high dose thiamine supplementation reduces cell proliferation through a DCA like mechanism.
Methods
Cytotoxicity of thiamine and DCA were assessed in SK-N-BE and Panc-1 cancer cell lines. Comparative effects of high dose thiamine and DCA on PDH phosphorylation were measured by Western blot. The metabolic impact of PDH reactivation was determined by glucose and lactate assays. Changes in the mitochondrial membrane potential, ROS production, and caspase-3 activation were assessed to characterize the mechanism of action.
Results
Thiamine exhibited a lower IC50 value in both cell lines compared to DCA. Both thiamine and DCA reduced the extent of PDH phosphorylation, reduced glucose consumption, lactate production, and mitochondrial membrane potential. High dose thiamine and DCA did not increase ROS but increased caspase-3 activity.
Conclusion
Our findings suggest that high dose thiamine reduces cancer cell proliferation by a mechanism similar to that described for dichloroacetate.
Keywords: Metabolism, Vitamin, Thiamine, Pyruvate Dehydrogenase, Dichloroacetate
Introduction
A high rate of glycolysis and an increase in lactate production have long been considered hallmarks of cancer. This oncogenically driven change in cellular metabolism supports an increase in biomass and ATP generation that is necessary to sustain rapid proliferation. A critical regulatory step supporting the enhanced glycolytic activity in cancer cells is the reduced activity of the vitamin B1 (thiamine) dependent enzyme pyruvate dehydrogenase (PDH), which limits the conversion of pyruvate to acetyl-CoA. The decrease in PDH activity reduces glucose carbon flux into the tricarboxylic acid (TCA) cycle and consequently excess glucose carbons are converted to lactate in order to regenerate NAD+ for continued ATP production. This truncation in glucose metabolism also facilitates the shunting of phospho-metabolites into additional metabolic pathways for biosynthetic reactions [1,2]
The activity of PDH is regulated through reversible phosphorylation reactions controlled by pyruvate dehydrogenase kinase (PDK) and pyruvate dehydrogenase phosphatase. PDK is a family of four isoenzymes (PDK1-4) that inactivate PDH through phosphorylation on three serine residues (Ser-293, Ser-300, and Ser-232) [3]. PDK1 is the only isoform that has been shown to phosphorylate all three sites on PDH, while PDK2/3/4 primarily phosphorylate Ser-293 and Ser-300 [4]. Although phosphorylation at any of the three sites leads to inactivation, Ser-293 is the predominant phosphorylation site [5,6]. Overexpression of PDK1 has been found in cancers such as breast, head and neck, and lung cancers [7,8]. When PDK1 is knocked down, PDH activity and glucose oxidation are restored resulting in reduced lactate production and suppression of tumor growth [9]. PDK isoforms have also been characterized as direct transcriptional targets for hypoxia inducible factor 1-α [10,11]. Up-regulation of PDKs in hypoxic tumor microenvironments directly supports the increase in anaerobic glycolytic activity observed in hypoxic cancer cells [12]. Overexpression of PDKs is also associated with chemoresistance. Knockdown of PDK1 and PDK3 increased cytotoxicity of the anticancer drugs paclitaxel and cisplatin [10]. Thus, inactivation of PDH activity in cancer cells through overexpression of PDKs is an important pro-survival pathway exploited by cancer cells.
The inhibition of PDK mediated phosphorylation of PDH has shown considerable promise as a targeted strategy to reduce cancer cell proliferation [13]. One such compound, dichloroacetate (DCA) is effective at reducing cell growth in a number of malignancies including breast, endometrial, lung, and colorectal [13-15]. Re-establishment of PDH function normalizes glycolytic activity in cancer cells, directing glucose carbons through mitochondrial oxidative phosphorylation pathways. Cancer cells with defective mitochondrial electron transport chain are unable to cope and as a result increase reactive oxygen species (ROS) generation, cytochrome C release, and ultimately apoptosis [16,17]. An advantage to targeting PDK activity is that overexpression of PDKs and extensive phosphorylation of PDH is found in cancer cells and not in normal tissue [14]. This may provide for selective targeting towards malignant tissue and avoiding unwanted off target toxicity commonly observed with conventional chemotherapy.
PDH activity is also regulated by substrate and end product feedback. The products of the PDH reaction (NADH and acetyl-CoA) stimulate phosphorylation by PDKs, while an excess of substrates (pyruvate and ADP) or cofactor (thiamine pyrophosphate; TPP) inhibits phosphorylation [18]. Kolobova et al. found that TPP decreased both the rate and extent of PDH phosphorylation by PDK isoforms [4]. Thus increasing concentrations of TPP through thiamine supplementation may be pro-apoptotic through restoration of PDH activity in cancer cells similar to the mechanism observed with DCA. This may provide a mechanistic understanding as to why thiamine suppressed tumor growth at doses greater than 75 times the recommended daily intake [19]. Therefore, the objective of this study was to determine if high dose thiamine supplementation reduces cellular proliferation of cancer cells through a mechanism involving a reduction in PDH phosphorylation.
Materials and Methods
Materials
All cell culture reagents including gentamicin and trypsin/EDTA were obtained from Mediatech (Manassas, VA). Custom formulated thiamine-deficient RPMI 1640 was also prepared by Mediatech to allow for the controlled addition of thiamine. Cell culture treated flasks, plates, and dishes were obtained from Greiner Bio-one (Monroe, NC). Fetal bovine serum (FBS), crystal violet, thiamine hydrochloride, and sodium dichloroacetate (DCA) were purchased from Sigma Aldrich (St. Louis, MO).
Cell Culture
The cancer cell lines Panc-1 (pancreatic) and SK-N-BE (neuroblastoma) were obtained from ATCC (Manassas, VA). All cell lines were maintained in thiamine-deficient RPMI 1640 supplemented with 30 nM thiamine, 10% FBS, and 0.2% gentamicin (referred to as T30 media). All cells were cultured at 37°C in a humidified atmosphere of 5% CO2.
Cell Proliferation Assays
The effects of thiamine and DCA on cell proliferation were determined using the crystal violet assay as described previously [20]. Briefly, cells were seeded into 96 well plates at a density of 3,000 (Panc-1) or 9,000 (SK-N-BE) cells/cm2 and allowed to attach overnight. Media was than replaced with increasing concentrations of either thiamine or DCA and cells allowed to grow for 5 days at 37°C. After which the media was aspirated and cells washed with phosphate buffered saline (PBS) than fixed with 10% neutral buffered formalin (EMD Millipore, Darmstadt, Germany) for 1 h at 4°C. The fixed cells were gently washed under running distilled water and stained with 0.1% crystal violet for 30 min, than washed again with distilled water and allowed to dry overnight. To quantify the extent of crystal violet staining, cells were de-stained with 200 μL of 1% Triton X-100 and the absorbance measured at 550 nm using a Spectra Max M2e (Molecular Devices, Sunnyvale, CA) microplate reader. The proliferation was calculated as the percent viability comparing treated cells to control cells cultured in T30 media only. The IC50 values were determined using non-linear regression using GraphPad Prism 6 software.
Western Blotting
The effects of thiamine and DCA on the extent of PDH phosphorylation was assessed by Western blot. Cells were seeded into 60 mm cell culture dishes and upon reaching ~75% confluency were treated with either T30 media, T30 media + 25 mM thiamine, or T30 media + 25 mM DCA for 24 and 48 h at 37°C. Following treatment, cells were washed with ice cold PBS and lysed using 50 mM Tris, 250 mM NaCl, 1 mM EDTA, 1% NP-40, 0.5% sodium deoxycholate, 0.1% SDS supplemented with protease inhibitor and phosphatase inhibitor cocktail (EMD Biosciences, La Jolla, CA). Lysates were then centrifuged at 14,000xg and 4°C for 20 min with the supernatant collected. Protein concentration was determined using the Pierce BCA Protein Assay Kit (Thermo Scientific, Rockford, IL).
Whole cell lysates (50 μg) were electrophoresed on a 10% SDS-PAGE gel than transferred to a polyvinylidene difluoride membrane (Hybond-P, GE Healthcare, Piscataway, NJ). The membrane was blocked with 3% bovine serum albumin (KSE Scientific, Durham, NC) in Tris-buffered saline tween 20 (TBS-T) for 1 h. The membrane was blotted for either total PDH-E1α (Genetex, Irvine, CA), PDH pSer-293, PDH pSer-300, PDH pSer232 (Calbiochem, La Jolla, CA), or β-Actin (Sigma Aldrich, St. Louis, MO) overnight at concentrations of 1:1000, 1:500 (for all PDH phosphorylation antibodies), and 1:1000, respectively in TBS-T. Blots were washed in TBS-T three times for 10 min each and blotted with either goat anti-mouse horseradish peroxidase (HRP) secondary antibody (Millipore, Billerica, MA) for β-Actin at 1:20,000 or donkey anti-rabbit HRP (Bethyl, Montgomery, TX) for PDH-E1α and PDH pSer-293 at 1:15,000 in TBS-T for 1 h. Blots were again washed 3 times for 10 min with TBS-T, visualized using Supersignal West Pico (Thermo Scientific, Rockford, IL), and imaged using a Fluorchem SP digital imager (Alpha Innotech, San Leandro, CA). Densitometry was performed using Fluorchem SP software. The change in PDH phosphorylation is expressed as a ratio of control (Ser-293/PDHE1α) to treated (Ser-293/PDHE1α) cells.
Glucose and Lactate Assay
The effects of thiamine and DCA on glucose consumption and lactate production were assessed using commercially available glucose (Sigma Aldrich, St. Louis, MO) and L-Lactate assay (Eton Biosciences, San Diego, CA) kits. Cells seeded into 60 mm cell culture dishes were allowed to reach ~75% confluency than treated with either T30 media, T30 media + 25 mM thiamine, or T30 media + 25 mM DCA for 24 and 48 h at 37°C. Following treatment, media samples were collected and centrifuged at 14,000xg and 4°C for 5 min to pellet any cell debris. For the quantitation of glucose remaining in the media, 10 μL of media sample or standard was added to a 96-well plate followed by addition of the supplied assay reagent (90 μL). The reaction was allowed to proceed for 15 min at room temperature and the absorbance measured at 340 nm. For lactate, 50 μL of media sample or standard was placed into a 96-well plate followed by addition of 50 μL of the supplied assay reagent. The plate was set at 37°C for 30 min, after which the reaction was stopped by the addition of 50 μL of 0.5 M acetic acid (EMD Millipore, Darmstadt, Germany) and the absorption measured at 490 nm. Results were normalized to total cellular protein using the Pierce BCA Protein Assay Kit (Thermo Scientific, Rockford, IL).
Mitochondrial Membrane Potential
The potentiometric dye tetramethylrhodamine methyl ester (TMRM) (Sigma Aldrich, St. Louis, MO) was used to assess changes in mitochondrial membrane potential (MMP). Cells were seeded into 48 well plates and cultured until ~75% confluency. Cells were treated with either T30 media, T30 media + 25 mM thiamine, or T30 media + 25 mM DCA for 48 h. The protonophore FCCP (Sigma Aldrich, St. Louis, MO) was added 3 h prior to TMRM addition to a group of T30 media control cells (25 μM) as a positive control for changes in membrane polarization. TMRM was than added to each well (25 nM) and cells incubated at 37°C for 30 min. The media was then aspirated and wells washed twice with PBS (37°C) to remove extracellular TMRM. An aliquot of PBS (500 μL) was then placed into each well and the fluorescence was measured at EX=550 nm and EM=575 nm using a Spectra Max M2e microplate reader. Data was normalized to total cellular protein, which was quantified using the Pierce BCA Protein Assay Kit (Thermo Scientific, Rockford, IL).
Hydrogen Peroxide (H2O2)
Production of H2O2 was determined using the commercially available hydrogen peroxide fluorometric detection kit (Enzo Life Sciences, Farmingdale, NY). Cells were treated with the oxidative phosphorylation inhibitor rotenone (5 μM) (Calbiochem, La Jolla, CA), 25 mM thiamine, or 25 mM DCA for 30 min, 1 h, and 2 h prior to assay. After treatment, the media was removed and wells washed twice with PBS (37°C). 200 μL of supplied reaction mixture (Detection Reagent, Horse Radish Peroxidase, and PBS) was added to each well and the cells were allowed to incubate for 10 min at room temperature. Fluorescence was then measured at EX=550 nm and EM=590 nm. Data was normalized to total cellular protein as determined using the Pierce BCA Protein Assay Kit (Thermo Scientific, Rockford, IL).
Caspase-3
Activation of caspase-3 was measured using the commercially available caspase-3 fluorescence assay kit (Cayman Chemical Company, Ann Arbor, MI). Treatment of cells with thiamine and DCA was performed as described above for the TMRM assay. 24 h prior to caspase-3 assay a set of control cells were treated with the topoisomerase I inhibitor (1 μM) SN-38 (LKT Laboratories, St. Paul, MN) as a positive control for caspase-3 induction. Following 48 h of thiamine and DCA treatment, the cells were washed with supplied caspase-3 assay buffer. 100 μL of supplied lysis buffer was added to each well and incubated for 30 min at room temperature on an orbital plate shaker. Cell lysates were collected and centrifuged for 10 min at 800xg after which 90 μL of supernatant was transferred to a 96-well plate. 100 μL of the supplied caspase-3 substrate solution was then added to each well and the plates were incubated at 37°C for 30 min. The fluorescence was measured at EX=485 nm and EM=535 nm. Data was normalized to total cellular protein as determined using the Bio-Rad Protein Assay Kit (Hercules, CA) and expressed as the relative fluorescence per mg protein.
Statistical Analysis
All experiments were performed with a minimum of three independent experiments unless otherwise noted. Statistical significance was evaluated using unpaired Students t-test with a significance level of p<0.05 using Graph Pad Prism 6.
Results
Thiamine reduces cancer cells proliferation
The crystal violet assay was used to assess the effects of thiamine and DCA on cell proliferation. Figure 1 displays a decrease in cell proliferation for SK-N-BE and Panc-1 cells with increasing concentration of thiamine and DCA following 5 days of treatment. The IC50 values for DCA were 23.8 for SK-N-BE and 10.3 mM Panc-1. Comparatively, the IC50 of thiamine was lower than DCA for both cell lines with values of 4.9 for SK-N-BE and 5.4 mM for Panc-1.
Fig. 1.

Cell proliferation of SK-N-BE and Panc-1 cells. Cells seeded into 96-well plates were treated with increasing concentrations of thiamine (○) or DCA (●) for 5 days. The extent of cell proliferation was measured using crystal violet. Results are presented as the percent proliferation comparing treated cells to untreated cells. Data represents mean ± SD on n=3 independent experiments.
High dose thiamine reduces the extent of PDH phosphorylation
Based on cell proliferation results, a concentration of 25 mM of either thiamine or DCA was chosen for short-term studies as this dose provided the greatest decrease in cell proliferation after 5 days (Fig. 1). In both SKN-BE and Panc-1 cells, DCA decreased the extent of phosphorylated PDH at Ser-293 as early as 24 h of treatment (Fig. 2). The ratio of Ser-293 to total PDHE1α was calculated for each treatment group to assess the reduction of phosphorylation. The fold reduction in PDH phosphorylation for SK-N-BE cells treated with DCA was from 0.21 and 0.09 after 24 and 48h treatment, which was consistent with 0.17 and 0.01 for thiamine after 24 and 48h treatment. A similar fold reduction in PDH phosphorylation was observed for Panc-1 cells treated with DCA and thiamine (Fig. 2). No detectible phosphorylation at Ser-300 or Ser-232 was found in control or in treated cells (data not shown).
Fig. 2.
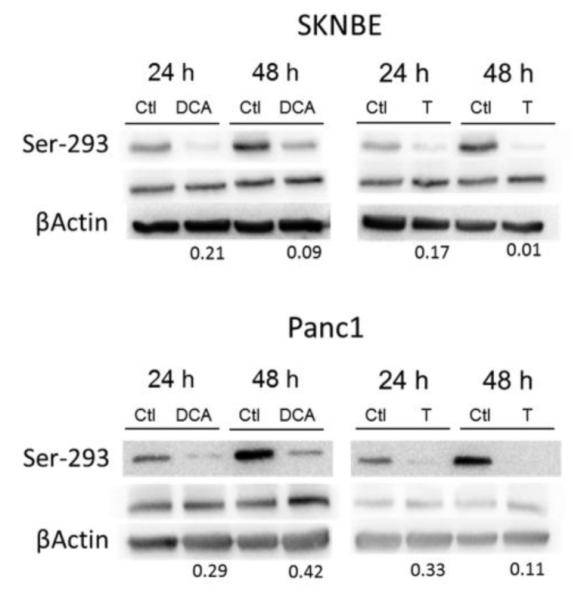
Representative Western blots of PDH phosphorylation at Ser-293. SK-N-BE and Panc-1 cells were treated with 25 mM of either thiamine (T) or DCA for 24 and 48 h. Whole cell lysates were immuno-fractionated on a 10% SDS-PAGE gel and probed for phosphorylation at Ser-293, total PDH (PDH-E1α subunit), and β-Actin as a loading control. Numbers below blots represent the ratio of Ser-293 to PDHE1α in control cells divided by the ratio of Ser-293 to PDHE1α in corresponding thiamine or DCA treated cells to indicate changes in the level of PDH phosphorylation.
High dose thiamine reduces glucose consumption and lactate production
In both cell lines, thiamine and DCA significantly decreased the consumption of glucose after 24 and 48 h treatment (Fig. 3). Both DCA and thiamine significantly reduced the level of extracellular lactate secreted by Panc-1 cells (Fig. 3). However, DCA significantly reduced lactate secretion in SK-NBE cells while thiamine had no effect after 24 and 48 h exposure (Fig. 3).
Fig. 3.

Glucose consumption in (A) SK-N-BE and (B) Panc-1 cells was assayed after 24 (open bars) and 48 h (solid bars) of treatment with either 25 mM thiamine (T), or 25 mM DCA. Lactate production in (C) SK-N-BE and (D) Panc-1 cells was assayed after 24 (open bars) and 48 h (solid bars) of treatment with either 25 mM thiamine (T), or 25 mM DCA. Data represents mean ± SD with n=3 independent experiments. Statistically significant (p<0.05) differences are expressed as comparisons between 24 h ( ) control media (T30) and corresponding thiamine or DCA treated cells. Statistically significant (p<0.05) differences are expressed as comparisons between 48 h (
 ) control media (T30) and corresponding thiamine or DCA treated cells.
Effect of high dose thiamine on mitochondrial polarization
The potentiometric dye TMRM was employed to assess the impact of thiamine and DCA on altering mitochondria polarization. As a positive control, the protonophore FCCP significantly decreased mitochondrial membrane polarization in both cell lines evaluated (Fig. 4). Following 48 h of treatment both thiamine and DCA resulted in a statistically significant decrease in mitochondrial membrane potential. (Fig. 4).
Fig. 4.

Changes in the mitochondrial membrane potential of SK-N-BE and Panc-1 cells after thiamine and DCA treatment. Cells treated with T30 media (CTL), 25 μM FCCP, 25 mM thiamine (T), or 25 mM DCA for 48 h prior to loading (30 min) with 25 nM TMRM and fluorescence measured at EX=540 and EM=575 nm. Data represents mean ± SD on n=3 independent experiments. ( ) Statistically significant (p<0.05) differences between control (T30 media) and treatments.
Effect of high dose thiamine on ROS production
As a measure of intracellular ROS, cells treated with thiamine or DCA were assayed for peroxide following 30 min, 1 h, and 2 h of treatment. No significant change in ROS was observed over all time points with thiamine and DCA as well as with the oxidative phosphorylation inhibitor rotenone (Fig. 5).
Fig. 5.

Production of H2O2 in SK-N-BE and Panc-1 cells. Cells were treated with T30 media (CTL), 25 mM thiamine (T), 25 mM DCA, or 5 μM rotenone for 30 min (open bars), 1 h (solid bars), and 2 h (hash bars). Data represents mean ± SD on n=3 independent experiments. ( ) Statistically significant (p<0.05) differences between control (T30 media) and treatments.
High dose thiamine increases caspase-3 activity
Induction of caspase-3 activity was used to assess apoptosis in SK-N-BE and Panc-1 cells after thiamine and DCA treatment. Both thiamine and DCA significantly increased caspase-3 activity after 48 h of treatment (Fig. 6).
Fig. 6.

Activation of capase-3 in SK-N-BE and Panc-1 cells. Cells were treated with T30 media (CTL), 25 mM thiamine (T), 25 mM DCA, or 10 μM SN-38 for 48 h prior to assaying for caspase-3 activation. Data represents mean ± SD on n=3 independent experiments. ( ) Statistically significant (p<0.05) differences between control (T30 media) and treatments.
Discussion
Vitamin B1 supplementation has a duality of effects on cancer cell survival and proliferation. At low to moderate doses, thiamine has been shown to support cancer cell proliferation. Comín-Anduix et al. found an increase in tumor proliferation at values from 12.5 to 75 times the recommended daily allowance (RDA) in an Ehrlich ascites tumor model [19]. This stimulation of cell proliferation may be supported by alterations in expression and utilization of thiamine-dependent enzymes during malignancy. In particular, the thiamine-dependent enzyme transketolase has been shown to be up-regulated in a variety of cancers including colon, urothelial, breast, ovarian, and gastric and is essential for generation of nucleotide precursors to sustain rapid proliferation [21-24]. However, at high doses (>75 times the RDA) no increase in tumor growth was found compared to control suggesting an anti-proliferative effect in cancer cells [19]. Using a pancreatic and neuroblastoma cell line, thiamine reduced cell proliferation with an IC50 of 4.9 and 5.4 mM, respectively. Although the IC50 with thiamine was lower than DCA, both reduced proliferation of SK-N-BE and Panc-1 cells at similar concentrations previously reported for DCA [25]. These results indicate that thiamine has a similar dose response profile when compared to DCA.
Mechanistically, DCA stimulates PDH activity by acting as a pyruvate mimetic and blocking the action of PDK mediated phosphorylation [26]. The presence of TPP has also been shown to block the phosphorylation of PDH by PDKs [4]. Figure 2 demonstrates that both DCA and thiamine reduced PDH phosphorylation in both SK-N-BE and Panc-1 cells. Increasing PDH activity in cancer cells can lead to a shift in glycolytic metabolism that promotes reduced glycolytic flux and reduced conversion of pyruvate to lactate. DCA treatment reduces glucose consumption and lactate production in tumors as a consequence of increased PDH activity [27,28]. Similar to DCA, high dose thiamine decreased glucose consumption in both cell lines. However, high dose thiamine reduced lactate production only in Panc-1 cells, while DCA reduced lactate levels in both. It is unclear why lactate levels did not change following 48 h of treatment in the neuroblastoma cell line SK-N-BE. In a panel of neuroblastoma cell lines, DCA reduced lactate in some while having no effect on lactate production in others [28]. Additionally, the high dose of thiamine may have impacted the activity of other thiamine-dependent enzymes. The increase in PDH activity by high dose thiamine and subsequent increase in acetyl-CoA production may have increased the flux of glucose carbons through the TCA cycle. The thiamine-dependent enzyme α-ketoglutarate dehydrogenase found within the TCA cycle, converts α-ketoglutarate to succinyl-CoA that continues on to form maleate. The increased TCA flux may facilitate maleate conversion back to pyruvate and subsequently to lactate [29]. High dose thiamine may have promoted increased lactate derived through the TCA cycle that counteracted the activity of PDH on reducing lactate production. Thus, the cellular metabolic phenotype may be an important dictator on the metabolic effects observed with high dose thiamine similar to the variability reported for DCA [17].
DCA mediated apoptosis is considered to be the result of mitochondria-dependent pathways initiated by the loss of MMP and subsequent release of pro-apoptotic factors [30,14]. Both DCA and thiamine significantly reduced the MMP in SK-N-BE and Panc-1 cells. An increase in caspase-3 activation was also found for both DCA and thiamine consistent with an apoptotic mechanism. A consequence of the normalization of glycolysis through PDH activation is an increase in ROS production. DCA mediated ROS generation and reduction of MMP has been shown to induce the Kv1.5 potassium channel expression as a possible contributor for caspase activation [13]. Using peroxide as a measure of ROS, neither DCA, thiamine, nor rotenone induced ROS after 2 h of treatment in SK-N-BE and Panc-1 cells. Although it is unclear why ROS was not increased, a similar lack of significant ROS generation by DCA in A549 cancer cells was associated with JNK1 activation and apoptosis [31]. Conversely, DCA treatment to several cancer cell lines reduced MMP and increased ROS generation with no observable apoptotic response [25]. Interestingly, the same study demonstrated the lack of Kv1.5 induction even though DCA induced ROS generation and caspase activation [25]. Thus the effects of PDH activation by either DCA or thiamine on initiating the mitochondria-mediated apoptotic cascade needs to be further defined and may be highly dependent on cancer cell phenotypes.
A particular advantage of DCA treatment is the targeting of a metabolic phenotype found in cancer cells that is not observed in normal tissue [27]. However, the high dose (mM) of DCA required to reduce cancer proliferation may limit the use in vivo. Doses as high as 25 mg/kg/day (~1.75 g/day for 70 kg patient) of DCA has been found to result in toxic neuropathy in patients with mitochondrial myopathy, encephalopathy, and stroke-like episodes [32]. Thiamine is an essential vitamin required for normal health and an endobiotic that the body has functional mechanisms to regulate homeostasis [33]. Although our findings demonstrate that doses of thiamine (mM) required to reduce cancer cell proliferation are similar to DCA, thiamine has few dose limiting toxicities. Smithline et al. reported no adverse effects in healthy patients who were given 1.5g/day of thiamine [34]. Only minor side effects, such as nausea and indigestion were reported in patients given doses as high as 7.5 g/day [35]. Thus high dose thiamine supplementation may be a safer and more tolerated treatment option.
The impact of thiamine homeostasis on the dose response may be an important component. Intracellular uptake of thiamine is dependent on the activity of the thiamine transporters THTR1 and THTR2 [36]. Once in the cells, thiamine is rapidly converted to the active cofactor TPP by thiamine pyrophosphokinase-1 (TPK-1). Transport of TPP across the mitochondrial membrane for PDH activity is mediated by the thiamine pyrophosphate carrier, which is encoded by the SLC25A19 gene [37]. Since only TPP has been reported to reduce PDH phosphorylation, the intracellular uptake and conversion of thiamine to TPP maybe an important contributor to the dose response. Overexpression of TPK1, SLC19A2, and SLC25A19 in breast cancer tissue samples compared to normal breast tissue was recently described [38]. Thus, the cellular availability of thiamine may be augmented by the increase in thiamine homeostasis genes in cancer cells. Alternatively, a potential non-cofactor role of thiamine may contribute towards reducing cellular proliferation. Free thiamine has direct antioxidant properties as well as being essential for glutathione production [39-41]. Antioxidant treatment of cancer cells has been described to have an anti-proliferative and pro-survival response through either reducing ROS status or protection against ROS stress [42]. Thus, differences in expression of thiamine homeostasis genes and the extent of intracellular thiamine and TPP levels may dictate the dose response and/or mechanism for reduced cell proliferation by high dose thiamine.
In conclusion, we have demonstrated that high dose thiamine decreased proliferation in a mechanism similar to that of DCA in SK-N-BE and Panc-1 cells. Both thiamine and DCA reduced PDH phosphorylation, decreased MMP and induced caspase-3 mediated apoptosis. These findings describe a potential mechanism by which high dose thiamine reduced in vivo tumor growth [19]. Treatment regimens with high dose thiamine may be a safer more tolerated alternative to DCA supplementation. Future work will need to establish the role of thiamine homeostasis in the dose response and if any non-cofactor roles of thiamine may contribute to the mechanism of toxicity.
Acknowledgements
These studies were supported by the Georgia Cancer Coalition through the Distinguished Cancer Scholar program awarded to Jason Zastre. The authors would like to thank Dr. James Franklin for his assistance with mitochondrial membrane potential assays.
References
- 1.Hsu PP, Sabatini DM. Cancer cell metabolism: Warburg and beyond. Cell. 2008;134(5):703–707. doi: 10.1016/j.cell.2008.08.021. doi:10.1016/j.cell.2008.08.021. [DOI] [PubMed] [Google Scholar]
- 2.Gatenby RA, Gillies RJ. Glycolysis in cancer: a potential target for therapy. The international journal of biochemistry & cell biology. 2007;39(7-8):1358–1366. doi: 10.1016/j.biocel.2007.03.021. doi:10.1016/j.biocel.2007.03.021. [DOI] [PubMed] [Google Scholar]
- 3.Korotchkina LG, Patel MS. Probing the mechanism of inactivation of human pyruvate dehydrogenase by phosphorylation of three sites. The Journal of biological chemistry. 2001;276(8):5731–5738. doi: 10.1074/jbc.M007558200. doi:10.1074/jbc.M007558200. [DOI] [PubMed] [Google Scholar]
- 4.Kolobova E, Tuganova A, Boulatnikov I, Popov KM. Regulation of pyruvate dehydrogenase activity through phosphorylation at multiple sites. The Biochemical journal. 2001;358(Pt 1):69–77. doi: 10.1042/0264-6021:3580069. [DOI] [PMC free article] [PubMed] [Google Scholar]
- 5.Sale GJ, Randle PJ. Analysis of site occupancies in [32P]phosphorylated pyruvate dehydrogenase complexes by aspartyl-prolyl cleavage of tryptic phosphopeptides. European journal of biochemistry / FEBS. 1981;120(3):535–540. doi: 10.1111/j.1432-1033.1981.tb05733.x. [DOI] [PubMed] [Google Scholar]
- 6.Yeaman SJ, Hutcheson ET, Roche TE, Pettit FH, Brown JR, Reed LJ, Watson DC, Dixon GH. Sites of phosphorylation on pyruvate dehydrogenase from bovine kidney and heart. Biochemistry. 1978;17(12):2364–2370. doi: 10.1021/bi00605a017. [DOI] [PubMed] [Google Scholar]
- 7.Koukourakis MI, Giatromanolaki A, Sivridis E, Gatter KC, Harris AL. Pyruvate dehydrogenase and pyruvate dehydrogenase kinase expression in non small cell lung cancer and tumor-associated stroma. Neoplasia (New York, NY) 2005;7(1):1. doi: 10.1593/neo.04373. [DOI] [PMC free article] [PubMed] [Google Scholar]
- 8.Lin H, Hsieh F, Song H, Lin J. Elevated phosphorylation and activation of PDK-1/AKT pathway in human breast cancer. British journal of cancer. 2005;93(12):1372–1381. doi: 10.1038/sj.bjc.6602862. [DOI] [PMC free article] [PubMed] [Google Scholar]
- 9.McFate T, Mohyeldin A, Lu H, Thakar J, Henriques J, Halim ND, Wu H, Schell MJ, Tsang TM, Teahan O, Zhou S, Califano JA, Jeoung NH, Harris RA, Verma A. Pyruvate dehydrogenase complex activity controls metabolic and malignant phenotype in cancer cells. The Journal of biological chemistry. 2008;283(33):22700–22708. doi: 10.1074/jbc.M801765200. doi:10.1074/jbc.M801765200. [DOI] [PMC free article] [PubMed] [Google Scholar]
- 10.Lu CW, Lin SC, Chen KF, Lai YY, Tsai SJ. Induction of pyruvate dehydrogenase kinase-3 by hypoxia-inducible factor-1 promotes metabolic switch and drug resistance. The Journal of biological chemistry. 2008;283(42):28106–28114. doi: 10.1074/jbc.M803508200. doi:10.1074/jbc.M803508200. [DOI] [PMC free article] [PubMed] [Google Scholar]
- 11.Wigfield S, Winter S, Giatromanolaki A, Taylor J, Koukourakis M, Harris A. PDK-1 regulates lactate production in hypoxia and is associated with poor prognosis in head and neck squamous cancer. British journal of cancer. 2008;98(12):1975–1984. doi: 10.1038/sj.bjc.6604356. [DOI] [PMC free article] [PubMed] [Google Scholar]
- 12.Kim JW, Dang CV. Cancer’s molecular sweet tooth and the Warburg effect. Cancer Res. 2006;66(18):8927–8930. doi: 10.1158/0008-5472.CAN-06-1501. doi:10.1158/0008-5472.CAN-06-1501. [DOI] [PubMed] [Google Scholar]
- 13.Bonnet S, Archer SL, Allalunis-Turner J, Haromy A, Beaulieu C, Thompson R, Lee CT, Lopaschuk GD, Puttagunta L, Bonnet S, Harry G, Hashimoto K, Porter CJ, Andrade MA, Thebaud B, Michelakis ED. A mitochondria-K+ channel axis is suppressed in cancer and its normalization promotes apoptosis and inhibits cancer growth. Cancer cell. 2007;11(1):37–51. doi: 10.1016/j.ccr.2006.10.020. doi:10.1016/j.ccr.2006.10.020. [DOI] [PubMed] [Google Scholar]
- 14.Madhok BM, Yeluri S, Perry SL, Hughes TA, Jayne DG. Dichloroacetate induces apoptosis and cell-cycle arrest in colorectal cancer cells. Br J Cancer. 2010;102(12):1746–1752. doi: 10.1038/sj.bjc.6605701. doi:10.1038/sj.bjc.6605701. [DOI] [PMC free article] [PubMed] [Google Scholar]
- 15.Sun RC, Fadia M, Dahlstrom JE, Parish CR, Board PG, Blackburn AC. Reversal of the glycolytic phenotype by dichloroacetate inhibits metastatic breast cancer cell growth in vitro and in vivo. Breast Cancer Res Treat. 2010;120(1):253–260. doi: 10.1007/s10549-009-0435-9. doi:10.1007/s10549-009-0435-9. [DOI] [PubMed] [Google Scholar]
- 16.Garber K. Energy deregulation: licensing tumors to grow. Science. 2006;312(5777):1158–1159. doi: 10.1126/science.312.5777.1158. doi:10.1126/science.312.5777.1158. [DOI] [PubMed] [Google Scholar]
- 17.Papandreou I, Goliasova T, Denko NC. Anticancer drugs that target metabolism: Is dichloroacetate the new paradigm? International journal of cancer Journal international du cancer. 2011;128(5):1001–1008. doi: 10.1002/ijc.25728. doi:10.1002/ijc.25728. [DOI] [PubMed] [Google Scholar]
- 18.Roche TE, Hiromasa Y. Pyruvate dehydrogenase kinase regulatory mechanisms and inhibition in treating diabetes, heart ischemia, and cancer. Cellular and molecular life sciences : CMLS. 2007;64(7-8):830–849. doi: 10.1007/s00018-007-6380-z. doi:10.1007/s00018-007-6380-z. [DOI] [PMC free article] [PubMed] [Google Scholar]
- 19.Comín-Anduix B, Boren J, Martinez S, Moro C, Centelles JJ, Trebukhina R, Petushok N, Lee WNP, Boros LG, Cascante M. The effect of thiamine supplementation on tumour proliferation. European Journal of Biochemistry. 2001;268(15):4177–4182. doi: 10.1046/j.1432-1327.2001.02329.x. [DOI] [PubMed] [Google Scholar]
- 20.Journe F, Laurent G, Chaboteaux C, Nonclercq D, Durbecq V, Larsimont D, Body J-J. Farnesol, a mevalonate pathway intermediate, stimulates MCF-7 breast cancer cell growth through farnesoid-X-receptor-mediated estrogen receptor activation. Breast cancer research and treatment. 2008;107(1):49–61. doi: 10.1007/s10549-007-9535-6. [DOI] [PubMed] [Google Scholar]
- 21.Langbein S, Zerilli M, Zur Hausen A, Staiger W, Rensch-Boschert K, Lukan N, Popa J, Ternullo MP, Steidler A, Weiss C, Grobholz R, Willeke F, Alken P, Stassi G, Schubert P, Coy JF. Expression of transketolase TKTL1 predicts colon and urothelial cancer patient survival: Warburg effect reinterpreted. Br J Cancer. 2006;94(4):578–585. doi: 10.1038/sj.bjc.6602962. doi:10.1038/sj.bjc.6602962. [DOI] [PMC free article] [PubMed] [Google Scholar]
- 22.Staiger WI, Coy JF, Grobholz R, Hofheinz RD, Lukan N, Post S, Schwarzbach MH, Willeke F. Expression of the mutated transketolase TKTL1, a molecular marker in gastric cancer. Oncology reports. 2006;16(4):657–661. [PubMed] [Google Scholar]
- 23.Krockenberger M, Honig A, Rieger L, Coy JF, Sutterlin M, Kapp M, Horn E, Dietl J, Kammerer U. Transketolase-like 1 expression correlates with subtypes of ovarian cancer and the presence of distant metastases. International journal of gynecological cancer : official journal of the International Gynecological Cancer Society. 2007;17(1):101–106. doi: 10.1111/j.1525-1438.2007.00799.x. doi:10.1111/j.1525-1438.2007.00799.x. [DOI] [PubMed] [Google Scholar]
- 24.Foldi M, Stickeler E, Bau L, Kretz O, Watermann D, Gitsch G, Kayser G, Zur Hausen A, Coy JF. Transketolase protein TKTL1 overexpression: A potential biomarker and therapeutic target in breast cancer. Oncology reports. 2007;17(4):841–845. [PubMed] [Google Scholar]
- 25.Stockwin LH, Yu SX, Borgel S, Hancock C, Wolfe TL, Phillips LR, Hollingshead MG, Newton DL. Sodium dichloroacetate selectively targets cells with defects in the mitochondrial ETC. International journal of cancer Journal international du cancer. 2010;127(11):2510–2519. doi: 10.1002/ijc.25499. doi:10.1002/ijc.25499. [DOI] [PubMed] [Google Scholar]
- 26.Knoechel TR, Tucker AD, Robinson CM, Phillips C, Taylor W, Bungay PJ, Kasten SA, Roche TE, Brown DG. Regulatory roles of the N-terminal domain based on crystal structures of human pyruvate dehydrogenase kinase 2 containing physiological and synthetic ligands. Biochemistry. 2006;45(2):402–415. doi: 10.1021/bi051402s. doi:10.1021/bi051402s. [DOI] [PubMed] [Google Scholar]
- 27.Michelakis ED, Webster L, Mackey JR. Dichloroacetate (DCA) as a potential metabolic-targeting therapy for cancer. Br J Cancer. 2008;99(7):989–994. doi: 10.1038/sj.bjc.6604554. doi:10.1038/sj.bjc.6604554. [DOI] [PMC free article] [PubMed] [Google Scholar]
- 28.Niewisch MR, Kuci Z, Wolburg H, Sautter M, Krampen L, Deubzer B, Handgretinger R, Bruchelt G. Influence of dichloroacetate (DCA) on lactate production and oxygen consumption in neuroblastoma cells: is DCA a suitable drug for neuroblastoma therapy? Cellular physiology and biochemistry : international journal of experimental cellular physiology, biochemistry, and pharmacology. 2012;29(3-4):373–380. doi: 10.1159/000338492. doi:10.1159/000338492. [DOI] [PubMed] [Google Scholar]
- 29.Owen OE, Kalhan SC, Hanson RW. The key role of anaplerosis and cataplerosis for citric acid cycle function. The Journal of biological chemistry. 2002;277(34):30409–30412. doi: 10.1074/jbc.R200006200. doi:10.1074/jbc.R200006200. [DOI] [PubMed] [Google Scholar]
- 30.Grivicich I, Regner A, da Rocha AB, Grass LB, Alves PA, Kayser GB, Schwartsmann G, Henriques JA. Irinotecan/5-fluorouracil combination induces alterations in mitochondrial membrane potential and caspases on colon cancer cell lines. Oncology research. 2005;15(7-8):385–392. doi: 10.3727/096504005776449680. [DOI] [PubMed] [Google Scholar]
- 31.Ayyanathan K, Kesaraju S, Dawson-Scully K, Weissbach H. Combination of sulindac and dichloroacetate kills cancer cells via oxidative damage. PloS one. 2012;7(7):e39949. doi: 10.1371/journal.pone.0039949. doi:10.1371/journal.pone.0039949. [DOI] [PMC free article] [PubMed] [Google Scholar]
- 32.Kaufmann P, Engelstad K, Wei Y, Jhung S, Sano MC, Shungu DC, Millar WS, Hong X, Gooch CL, Mao X, Pascual JM, Hirano M, Stacpoole PW, DiMauro S, De Vivo DC. Dichloroacetate causes toxic neuropathy in MELAS: a randomized, controlled clinical trial. Neurology. 2006;66(3):324–330. doi: 10.1212/01.wnl.0000196641.05913.27. doi:10.1212/01.wnl.0000196641.05913.27. [DOI] [PubMed] [Google Scholar]
- 33.Singleton CK, Martin PR. Molecular mechanisms of thiamine utilization. Current molecular medicine. 2001;1(2):197–207. doi: 10.2174/1566524013363870. [DOI] [PubMed] [Google Scholar]
- 34.Smithline HA, Donnino M, Greenblatt DJ. Pharmacokinetics of high-dose oral thiamine hydrochloride in healthy subjects. BMC clinical pharmacology. 2012;12:4. doi: 10.1186/1472-6904-12-4. doi:10.1186/1472-6904-12-4. [DOI] [PMC free article] [PubMed] [Google Scholar]
- 35.Meador K, Loring D, Nichols M, Zamrini E, Rivner M, Posas H, Thompson E, Moore E. Preliminary findings of high-dose thiamine in dementia of Alzheimer’s type. Journal of geriatric psychiatry and neurology. 1993;6(4):222–229. doi: 10.1177/089198879300600408. [DOI] [PubMed] [Google Scholar]
- 36.Ganapathy V, Smith SB, Prasad PD. SLC19: the folate/thiamine transporter family. Pflugers Archiv : European journal of physiology. 2004;447(5):641–646. doi: 10.1007/s00424-003-1068-1. doi:10.1007/s00424-003-1068-1. [DOI] [PubMed] [Google Scholar]
- 37.Lindhurst MJ, Fiermonte G, Song S, Struys E, De Leonardis F, Schwartzberg PL, Chen A, Castegna A, Verhoeven N, Mathews CK, Palmieri F, Biesecker LG. Knockout of Slc25a19 causes mitochondrial thiamine pyrophosphate depletion, embryonic lethality, CNS malformations, and anemia. Proceedings of the National Academy of Sciences of the United States of America. 2006;103(43):15927–15932. doi: 10.1073/pnas.0607661103. doi:10.1073/pnas.0607661103. [DOI] [PMC free article] [PubMed] [Google Scholar]
- 38.Zastre JA, Hanberry BS, Sweet RL, McGinnis AC, Venuti KR, Bartlett MG, Govindarajan R. Up-regulation of vitamin B1 homeostasis genes in breast cancer. The Journal of nutritional biochemistry. 2013;24(9):1616–1624. doi: 10.1016/j.jnutbio.2013.02.002. doi:10.1016/j.jnutbio.2013.02.002. [DOI] [PubMed] [Google Scholar]
- 39.Lukienko PI, Mel’nichenko NG, Zverinskii IV, Zabrodskaya SV. Antioxidant properties of thiamine. Bulletin of experimental biology and medicine. 2000;130(9):874–876. [PubMed] [Google Scholar]
- 40.Schmid U, Stopper H, Heidland A, Schupp N. Benfotiamine exhibits direct antioxidative capacity and prevents induction of DNA damage in vitro. Diabetes/metabolism research and reviews. 2008;24(5):371–377. doi: 10.1002/dmrr.860. doi:10.1002/dmrr.860. [DOI] [PubMed] [Google Scholar]
- 41.Martin PR, Singleton CK, Hiller-Sturmhofel S. The role of thiamine deficiency in alcoholic brain disease. Alcohol research & health : the journal of the National Institute on Alcohol Abuse and Alcoholism. 2003;27(2):134–142. [PMC free article] [PubMed] [Google Scholar]
- 42.Trachootham D, Alexandre J, Huang P. Targeting cancer cells by ROS-mediated mechanisms: a radical therapeutic approach? Nature reviews Drug discovery. 2009;8(7):579–591. doi: 10.1038/nrd2803. doi:10.1038/nrd2803. [DOI] [PubMed] [Google Scholar]