Abstract
C29-peridinin is a synthetic analogue of the important, naturally-occurring carotenoid, peridinin, found in several marine algal species. C29-peridinin has five conjugated carbon-carbon double bonds compared to eight possessed by peridinin and also lacks the methyl group functionalities typically present along the polyene chain of carotenoids. These structural modifications lead to unique excited state properties and important insights regarding the factors controlling the photophysics of peridinin and other carbonyl-containing carotenoids, which are critical components of the light-harvesting systems of many photosynthetic organisms.
Introduction
Ocean-dwelling algal organisms are well-known for the proliferation of carbonyl-containing carotenoids in light-harvesting pigment-protein complexes that facilitate capturing sunlight for photosynthetic growth [1–3]. These functionally derivatized keto-carotenoids exhibit spectroscopic and kinetic behavior that can be strikingly different from carotenoids that lack a carbonyl group in conjugation with the π-electron system of conjugated carbon-carbon double bonds. One of the characteristic differences is that the lifetime of the lowest-lying excited state, S1, of carotenoids possessing a carbonyl group in conjugation with the polyene backbone is strongly dependent on the polarity of the solvent [4–8]. This is unusual because the S1 state of carotenoids is a state into which absorption from the ground state, S0, is quantum mechanically forbidden, and therefore the spectra and dynamics associated with S1 are typically not affected by the solvent environment [9–13]. The forbiddeness of the S0 → S1 transition is due to the fact that both S0 and S1 have Ag− symmetry in the idealized C2h point group. According to the selection rules for one-photon optical transitions, a change in symmetry and pseudoparity is required for the transition to be allowed. The strongly allowed transition that gives carotenoids their vibrant visible coloration occurs between the S0 (11Ag −) and S2 (11Bu +) states, which differ in both symmetry and pseudoparity [14].
The dependence of the S1 lifetime of carbonyl-containing carotenoids has been explained by the formation of an intramolecular charge transfer (ICT) state whose energy and electronic coupling is modulated by the solvent polarity [5]. Recent ultrafast time-resolved spectroscopic and computational investigations of the carbonyl-containing carotenoid, peridinin, have suggested that after photoexcitation into the S2 (11Bu +) state, a shift of electron density from the allenic side of peridinin toward the lactone ring occurs resulting in a bond-order reversal along the polyene chain [15]. These effects are accompanied by solvent reorganization, which together generate the ICT state through quantum mechanical mixing of the S2 (11Bu +) ionic state with the lowest-lying S1 (21Ag −) covalent state. The charge transfer character evolves in less than 100 fs and results in a very large (~35 D) dipole moment.
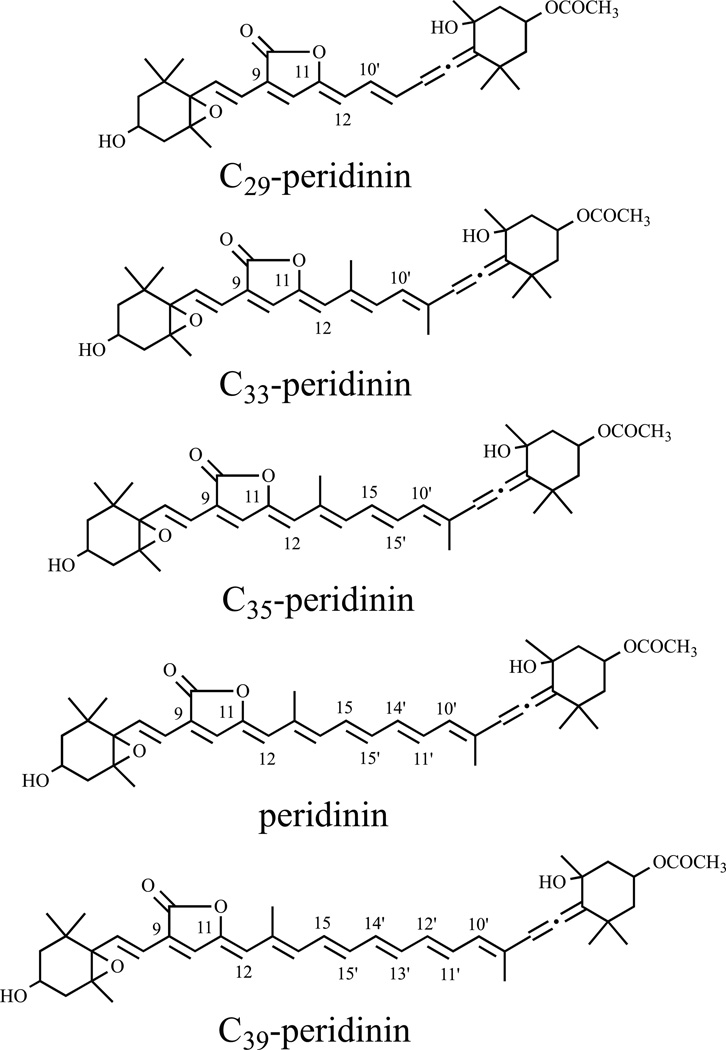
In order to explore the nature of the ICT state, several analogues of peridinin having various extents of π-electron conjugation (Figure 1) have been synthesized and characterized spectroscopically and computationally [16–20]. Naturally-occurring peridinin has a C37 carbon skeleton rather than the typical C40 system present in most carotenoids [21]. In this paper new results are presented on the shortest member of this series of synthetic peridinins, an analogue that has a C29 carbon skeleton, hereafter denoted C29-peridinin. This molecule is not only a shortened version of peridinin: C29-peridinin has five conjugated carbon-carbon double bonds compared to eight possessed by peridinin (Figure 1), but it also lacks the methyl functionalities typically present along the polyene chain of carotenoids. These structural modifications lead to unique excited state spectral and kinetic properties and provide important insights regarding the factors that control the photophysics of peridinin and other carbonyl-containing carotenoids that are critical components in the light-harvesting systems of an abundance of photosynthetic organisms.
Figure 1.
Structure of C29-peridinin and other peridinins.
Materials and Methods
Sample preparation
The details of the synthesis of C29-peridinin will be reported elsewhere. Prior to the optical experiments, the molecule was dissolved in acetonitrile and injected into a Millipore Waters 600E high-performance liquid chromatograph (HPLC) employing a C30 YMC column and an isocratic mobile phase protocol consisting of 87:10:3, acetonitrile:methanol:water (v/v/v) at a flow rate of either 0.8 or 1 mL/min. The sample volume was 200 µL for each injection. Pure C29-peridinin eluting from the column was identified using a Waters 996 single diode-array detector, collected, dried using a gentle stream of gaseous nitrogen, and stored at −80°C until ready for use.
Spectroscopic Methods
Steady state absorption and fluorescence: All of the spectroscopic experiments were carried out at room temperature. C29-peridinin was dissolved in spectroscopic grade n-hexane (Sigma Aldrich), tetrahydrofuran (Alfa Aesar), acetonitrile (Sigma Aldrich), and methanol (Sigma Aldrich). Absorption spectra were recorded using a Cary 50 UV-visible spectrometer. Fluorescence spectroscopy was carried out using a Jobin-Yvon Horiba Fluorolog-3 model FL3-22 equipped with double monochromators having 1200 grooves/mm gratings, a Hamamatsu R928P photomultiplier tube detector, and a 450 W ozone-free Osram XBO xenon arc lamp. The emission spectra were collected using 376 nm (n-hexane) and 400 nm (tetrahydrofuran, methanol, acetonitrile) excitation at a right angle relative to the emission beam and corrected using a file generated using a 200 W quartz tungsten-halogen filament lamp. Both the emission and excitation slit widths were set to a bandpass value of 3 nm (n-hexane, tetrahyrofuran, methanol) or 5 nm (acetonitrile).
Time-resolved fluorescence: Time-resolved fluorescence data were obtained at room temperature using the setup previously described [20]. The samples had an OD of ~0.3 at the maximum in their absorption recorded in a 1 cm cuvette. Depending on the solvent, the excitation beam had a wavelength between 380 and 430 nm and was positioned at a right angle relative to the detector. The beam power was 40–130 mW (at 80 MHz frequency) which corresponds to 0.5–1.5 nJ of energy and, with a spot size ~0.5 mm in diameter, yielded a photon intensity of 5–10×1011 photons/cm2.
Transient absorption spectroscopy: Time-resolved pump-probe absorption experiments were performed at room temperature using Helios, a femtosecond transient absorption spectrometer (Ultrafast Systems LLC, Sarasota, FL, USA) coupled to a femtosecond laser system described previously [22]. The samples were excited with pump beam energy of 500 nJ in a spot size of 1 mm diameter corresponding to an intensity of ~2×10¹⁴ photons/cm2. The pump wavelength was 400 nm. Steady-state absorption spectra were recorded before and after all transient experiments to confirm the stability of the C29-peridinin sample during laser excitation.
Computational methods
The theoretical methods used in the present study are identical to those used previously by Wagner et al. [15] to investigate the excited state properties of peridinin. The interested reader is directed to that work for a discussion of the methods, procedures, and rationale.
Results and Discussion
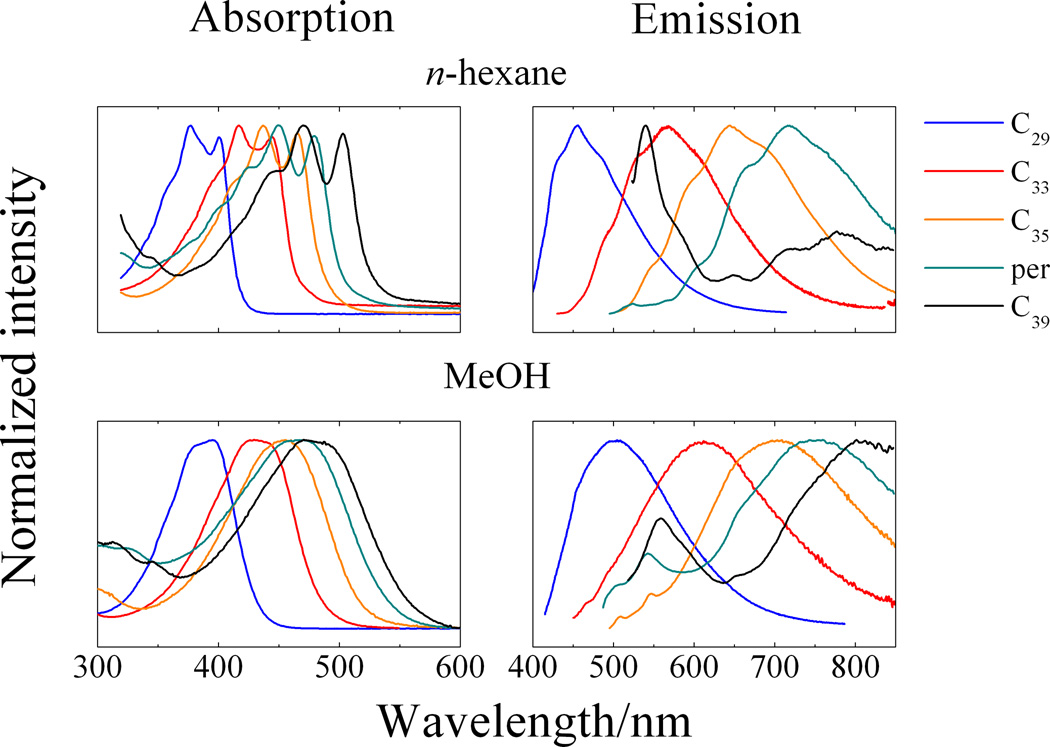
To better understand the nature of the steady-state absorption and fluorescence spectral features of C29-peridinin, it is useful to view them in the same context as the spectra recorded from peridinin and the C33-, C35- and C39-peridinin analogues in the same solvents. The steady-state absorption and fluorescence spectra recorded at room temperature in n-hexane and methanol from all of these molecules are shown in Figure 2.
Figure 2.
Steady-state absorption and emission spectra. Data for peridinin, C33-, C35-, and C39-peridinin in n-hexane and methanol were taken from reference [17].
The absorption spectrum of C29-peridinin, which corresponds to an S0 → S2 transition, is significantly blue-shifted relative to the spectra from the other molecules. In n-hexane, the spectral origin (0–0) vibronic band of C29-peridinin is sufficiently resolved that it can be located at ~400 nm; i.e., the S0 → S2 transition corresponds to an energy of ~25,000 cm−1. As the solvent polarity increases, the absorption band broadens substantially, but retains a small amount of vibronic structure compared to the other peridinins, as can be seen in the absorption spectrum of C29-peridinin in methanol (bottom left panel of Figure 2).
Room temperature fluorescence spectra of C29-peridinin in n-hexane and methanol are also shown in Figure 2 along with the spectra from peridinin and the other peridinin analogues. The spectra are broad and red-shifted compared to their respective absorption spectra in both solvents, but clearly resemble fluorescence emission lineshapes associated with the S1 → S0 transition. An exception is C39-peridinin, which displays emission from both the S1 state, whose (0–0) band is at ~650 nm, and the S2 state, which is characterized by an emission band at ~540 nm in both solvents.
As the π-electron conjugated chain length decreases, the energy difference between the S2 and S1 states also decreases. For the longest molecule in the series, C39-peridinin, the energy difference between the S2 and S1 states is ~3100 cm−1 based on the position of their (0–0) absorption and fluorescence bands. For C29-peridinin, the (0–0) band of the S1 fluorescence occurs at ~410 nm which is very close to the (0–0) band of the absorption spectrum at ~400 nm, resulting in a substantially smaller S2 - S1 energy difference of ~600 cm−1. Also, the intensity of emission decreases substantially as the solvent polarity increases. The relative fluorescence quantum yield of C29-peridinin is smaller by approximately an order of magnitude in methanol compared to in the nonpolar solvent, n-hexane.
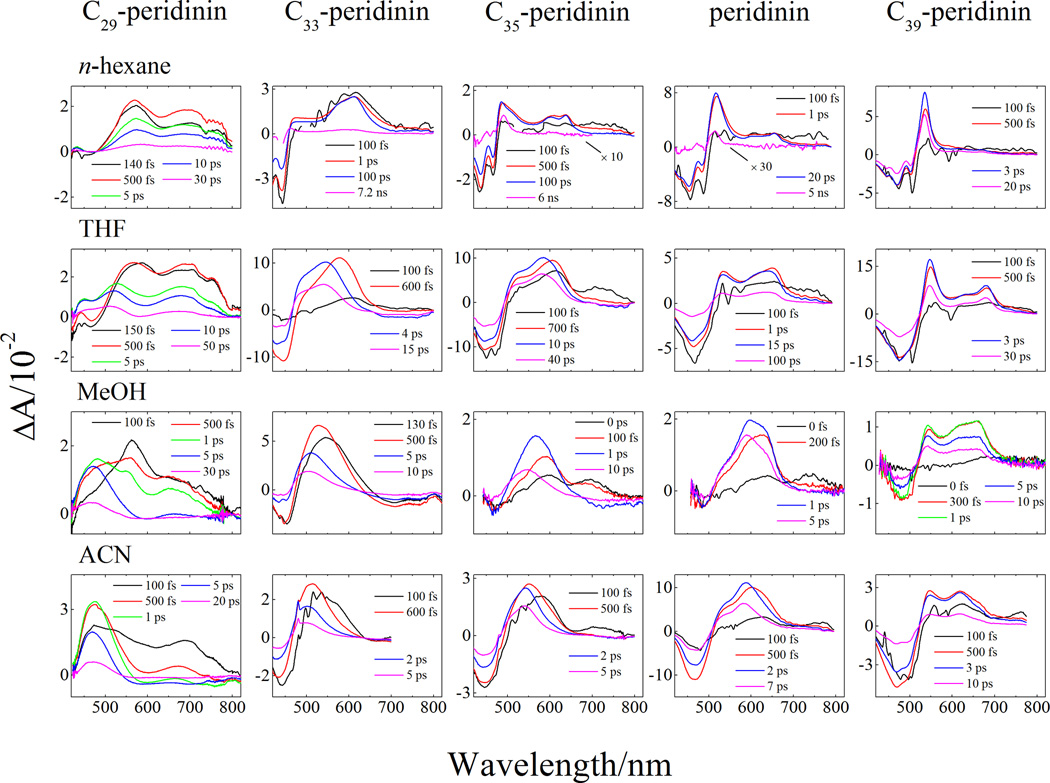
The transient absorption spectra of C29-peridinin recorded in n-hexane, tetrahydrofuran, methanol, and acetonitrile in the visible spectral region at various delay times after excitation into the S2 state are shown in the first column of Figure 3A. As indicated above for the steady-state spectra, in order to understand the nature of the transient absorption spectral bands, it is useful to view them in context with the transient absorption spectra from peridinin and the other peridinin analogues recorded in the same solvents. These spectra are shown in Figure 3A. Note that excitation of the longest molecule in the series, C39-peridinin dissolved in the non-polar solvent, n-hexane (top panel in the last column of Figure 3A), results in a rapid bleaching of the S0 → S2 absorption bands followed in a few hundred femtoseconds by the build-up of a narrow excited state absorption (ESA) band at ~540 nm. As the polarity of the solvent is increased, an additional broader ESA band appears between 550 and 700 nm concomitant with the narrow band. However, unlike the narrow ESA band whose position remains relatively unaffected by solvent polarity, the broader feature in the spectra from C39-peridinin increases in intensity and shifts from longer to shorter wavelength with increasing solvent polarity. This suggests that the narrow and broad bands belong to two different electronic transitions.
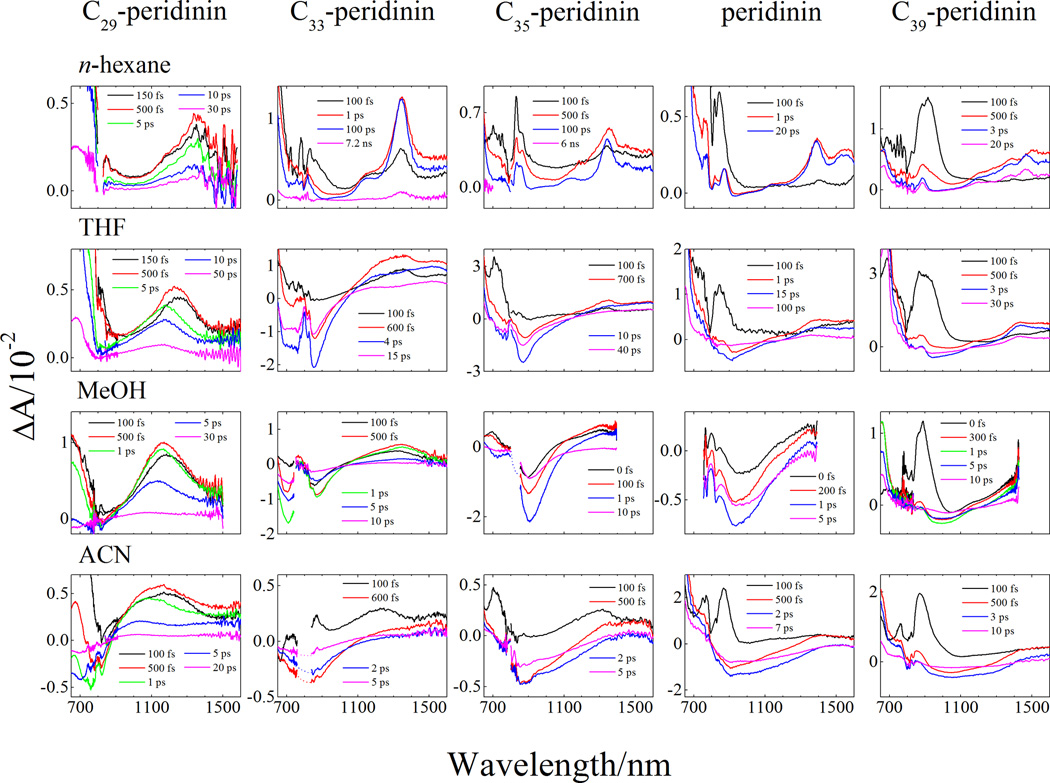
Figure 3.
Transient absorption spectra recorded in the (A) visible and (B) NIR spectral regions. Data for peridinin, C33-, C35-, and C39- peridinin in n-hexane, tetrahydrofuran (THF), and acetonitrile (ACN) were taken from reference [20], while data for C35-, peridinin and C39-peridinin in methanol were taken from reference [17].
As the π-electron conjugation is shortened by going down the series from C39-peridinin to peridinin, C35-peridinin, C33-peridinin and C29-peridinin, both the broad and narrow ESA spectral bands shift to shorter wavelength owing to a decrease in the extent of π-electron conjugation (top row of spectra in Figure 3A). In n-hexane, the narrow ESA band shifts ~40 nm to the blue for each one fewer double bond. Also, in this solvent, as the π-electron conjugation length of the molecule is decreased, the intensity of the narrow ESA band becomes less pronounced relative to that of the broad band, which for C29-peridinin in n-hexane, appears at ~560 nm (top left hand traces in Figure 3A). The narrow ESA band in the transient absorption spectra of C29-peridinin recorded in n-hexane has shifted to such a short wavelength (<440 nm) that it is out of the spectral response window of the spectrometer. Also for C29-peridinin, another broad band not observed in the transient absorption spectra of any of the other peridinins appears at ~700 nm, and its wavelength remains relatively invariant to solvent polarity as seen in the ESA spectra shown in the first column of Figure 3A. Like the broad band at ~560 nm, this additional band is prominently observed in the ESA traces taken at the shortest (<150 fs) delay times. This indicates that the state from which these two broad ESA transitions originate is populated from the S2 state. At subsequent times, both broad bands (the one at ~560 nm in n-hexane that is shifted to the blue with solvent polarity and the one at ~700 nm that does not shift) decay at the same rate. This suggests that the states from which these two spectral features originate are in fast dynamic equilibrium.
The transient absorption spectra of the peridinins in the different solvents recorded in the near infrared (NIR) spectral region at various delay times after excitation into its S2 state are shown in Figure 3B. Focusing initially on C39-peridinin (last column in Figure 3B), there is a strong band at ~900 nm that rises and decays within the time course of the laser excitation pulse indicating it is an ESA transition originating from the S2 state. This band is not affected by solvent polarity, but shifts to shorter wavelength upon decreasing the π-electron conjugation length of the molecule. This is seen most clearly in the ESA spectra for the series of peridinins recorded in n-hexane (top row of spectra in Figure 3B). As the fast feature decays, a lower-energy band appears at ~1450 nm for C39-peridinin in n-hexane, which suggests that it is directly populated from the S2 state subsequent to photoexcitation. This band decays in several picoseconds depending on the solvent, and shifts slightly to shorter wavelength and becomes stronger as the π-electron conjugation of the molecule is decreased; e.g., see top row of spectra in Figure 3B. The band appears at ~1350 nm for C29-peridinin. This longer-lived band also becomes broader and shifts to the blue with increasing solvent polarity; e.g., see the first column of spectra in Figure 3B. The fact that this band is long-lived suggests that it originates from the lowest excited state of the molecules. For peridinin and C39-peridinin, this band is very likely a higher vibronic feature associated with the S1 → S2 transition as suggested by Zigmantas, et al. [7]. However, this feature cannot be an S1 → S2 transition for the shortest in the series, C29-peridinin, because the (0–0) vibronic bands of the S0 → S2 absorption and S2 → S0 fluorescence spectra differ by only ~10 nm. This indicates an energy separation between the S1 and S2 states of only ~600 cm−1 (see above), which would put the S1 → S2 transition at a very long wavelength. Therefore, the band must be associated with a transition to a higher-lying state than S2.
In addition to the ESA features in the transient spectra, stimulated emission is evident as broad negative amplitude, particularly in the spectra of the molecules dissolved in polar solvents (see for example the transient NIR spectra from C35-peridinin in tetrahydrofuran, methanol, and acetonitrile, center column in Figure 3B). This emission has been assigned as originating from the ICT state [6, 7, 20, 23–25].
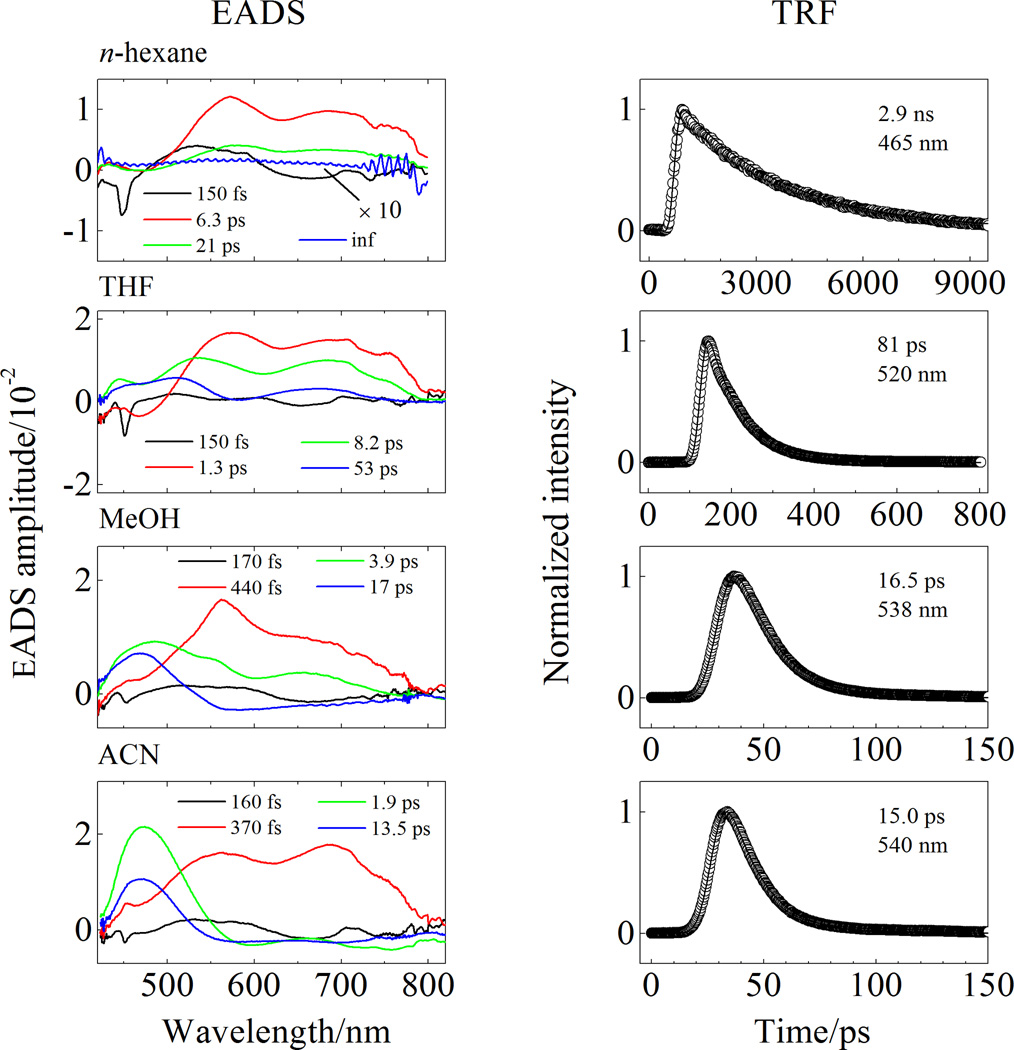
In order to probe more deeply into the origin and dynamics of the electronic states giving rise to the transient spectra, global fitting according to a sequential decay model was done on the spectral and temporal datasets from C29-peridinin. The resulting amplitude traces are termed evolution associated decay spectra (EADS) [26] and are shown in Figure 4 for the datasets taken in the visible region. In all solvents, four kinetic components were required to achieve a satisfactory fit based on a chi square (χ2) test and minimization of the residuals [26, 27].
Figure 4.
Evolution associated difference spectra (EADS, left column) obtained from the global fitting of the transient absorption in the visible region and time-resolved fluorescence kinetic profiles (TRF, right column) of C29-peridinin in different solvents.
The EADS traces for C29-peridinin in all of the solvents in the visible region (Figure 4) show a very fast 150–170 fs decay component that is very likely associated with the lifetime of the photoexcited S2 state. The bleaching of the S0 → S2 absorption profile is not evident because that band occurs below 425 nm which is outside the spectral response window of the spectrometer. The initial fast component decays into a second EADS component that has the two broad bands at ~560 nm and ~700 nm described above. This EADS component has a lifetime of 6.3 ps in n-hexane, 1.3 ps in tetrahydrofuran, 440 fs in methanol and 370 fs in acetonitrile. Except for the molecule dissolved in n-hexane, and consistent with previous analyses of the other peridinin analogues [20], this decay component is associated with a vibronically hot S1 state. This is evidenced by the fact that, for the molecule in the polar solvents, the spectral lineshape narrows and shifts to shorter wavelength as it decays into a third EADS component [27, 28]. In n-hexane there are no spectral features that can be attributed to vibrational relaxation which suggests that in this solvent, the process is complete prior to deactivation from the S2 state. The lifetime of the third EADS component decreases with increasing solvent polarity (Table 1) suggestive of different amounts of ICT character in the excited state associated with this component [20]. However, a fourth EADS component is also needed to fit the data which is not the case for any of the longer peridinin analogues [17]. The lifetime of this fourth component also decreases with solvent polarity (Table 1) and is similarly suggestive of different amounts of ICT character in the state. For C29-peridinin in n-hexane the fourth EADS component appears very small because the S1 → SN transition is out of the spectral window of the spectrometer. Because of its small amplitude and apparently lengthy lifetime, the global fitting assigns this component as infinitely long. In actuality, the lifetime of the S1 state of C29-peridinin in n-hexane is 2.9 ns as measured more precisely using time-resolved fluorescence (right hand column in Figure 4). As the solvent polarity is increased, some EADS amplitude can be observed at very short wavelengths, and the lifetime of this fourth EADS becomes shorter at 53 ps in tetrahyrofuran, 17 ps in methanol, and 13.5 ps in acetonitrile. These values are wholly consistent with those measured by time-resolved fluorescence which reveal 81 ps in tetrahydrofuran, 16.5 ps in methanol, and 15 ps in acetonitrile (Figure 4). The fact that a fourth EADS component is necessary at all is highly suggestive that the third and fourth components are associated with different conformations of the molecule having different excited state decay times. This interpretation is consistent with the quantum computational results described below. Table 1 summarizes the kinetics data from the transient absorption and time-resolved fluorescence experiments.
Table 1.
Dynamics of the excited states of C29-peridinin obtained in various solvents using transient absorption (TA) and time-resolved fluorescence (TRF) spectroscopy.a
| solvent | Probe region |
TA | TRF | ||||
|---|---|---|---|---|---|---|---|
| τ1 | τ2 | τ3 | τ4 | τF1 | τF2 | ||
| n-hexane | Vis | 0.15 ± 0.01 | 6.3 ± 0.2 | 21 ± 1 | inf | < FWHM (300) | 2900 ± 100 |
| NIR | 0.24 ± 0.01 | 6.3 ± 0.1 | 25 ± 2 | inf | |||
| THF | Vis | 0.15 ± 0.01 | 1.3 ± 0.1 | 8.2 ± 0.2 | 53 ± 3 | n.e. (28) | 81 ± 2 |
| NIR | 0.28 ± 0.2 | 5.6 ± 0.5 | 58 ± 3 | ||||
| MeOH | Vis | 0.17 ± 0.01 | 0.44 ± 0.02 | 3.9 ± 0.2 | 17 ± 1 | < FWHM (12) | 16.5 ± 0.5 |
| NIR | 0.17 ± 0.01 | 2.9 ± 0.3 | 16 ± 1 | ||||
| ACN | Vis | 0.16 ± 0.01 | 0.37 ± 0.01 | 1.9 ± 0.1 | 13.5 ± 0.4 | < FWHM (12) | 15.0 ± 0.5 |
| NIR | 0.18 ± 0.01 | 1.3 ± 0.1 | 13.6 ± 0.6 | ||||
The lifetimes are all given in picosecond units and were obtained from the global fitting of the transient absorption (TA) and time-resolved fluorescence (TRF) datasets. The uncertainties were determined by exploring the region of solution for each fitted parameter based on the goodness of fit and values of the residuals. FWHM – full width at half maximum of the instrument response function (in parenthesis in picoseconds); n.e., not evident, THF, tetrahydrofuran; MeOH, methanol; ACN, acetonitrile.
The global fits to the datasets taken in the NIR region are given in the supplemental information (Figure S1) and depending on the solvent, required three or four components for a good fit. The kinetic parameters derived from both the visible and NIR datasets are summarized in Table 1 and show good agreement among the values. However, for the experiments in the more polar solvents, the component assigned to the vibronically hot state from the EADS analysis of the visible datasets is not resolved, presumably because of low amplitude of this component in the NIR spectral region.
From the trends in the positions and amplitudes of the transient spectral features seen for the entire series of peridinins shown in Figures 3A and 3B, it is clear there are four different spectral bands of C29-peridinin that need explanation: Two of these bands, one in the NIR and one in the visible region, broaden and shift to higher energy with increasing solvent polarity, and two of the bands (at ~700 nm and < 440 nm) remain relatively unaffected by changing the solvent. These observations suggest that the bands that are affected by the solvent originate from the ICT state, which has significant Bu + character [15, 17, 20, 28]. Because this state has a large dipole moment, it is expected to decrease in energy with increasing solvent polarity, thereby leading to a shift to higher energy of the transitions originating from it. The bands that are unaffected by the solvent most likely originate from the S1 state, which has a significant Ag − symmetry known to be less prone to changing its position upon alteration of the solvent polarity.
As the above discussion suggests, C29-peridinin is somewhat of an outlier in terms of its spectroscopic and photophysical properties compared to the other peridinin derivatives. The two lowest excited states of C29-peridinin are observed to be much closer in energy than for the other peridinins, and the transient absorption spectra provide evidence for new transitions that were not observed in the longer chain molecules. Molecular orbital calculations were carried out to explore these issues in more detail.
As was done in a previous study of peridinin [15], calculations were performed using a truncated chromophore, as shown in Figure 5. This molecule has Cs symmetry, and the higher symmetry and smaller size combine to make equation-of-motion coupled-cluster with singles and doubles (EOM-CCSD) calculations with polarizable continuum model (PCM) solvent effect theory tractable without changing any key properties of the π-system responsible for the spectroscopic properties [15]. The EOM-CCSD calculations presented in Figure 5 predict that the two lowest excited singlet states of C29-peridinin are not only closer in energy than for peridinin, but strongly mixed, particularly in solvents with high refractive indices (see results for C29-peridinin in tetrahydrofuran in Figure 5). The lowest two states in C29-peridinin are more similar to the level ordering found in the protonated Schiff base retinal polyenes [29–32]. This prediction is in good agreement with the spectroscopic results.
Figure 5.
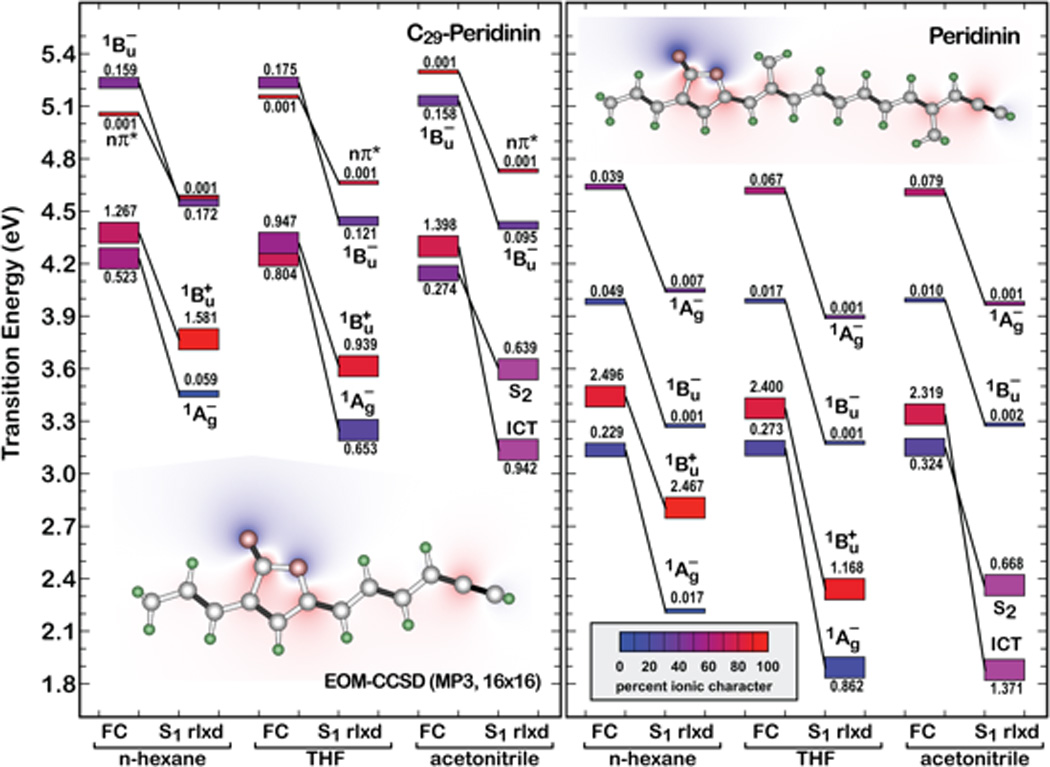
Effect of solvent environment on the low-lying Franck-Condon (FC) and relaxed (S1 rlxd) excited singlet states of C29-peridinin and peridinin based on EOM-CCSD and SCRF(PCM) procedures. Transition energies are relative to the MP3 ground state. Each excited state is represented by a rectangle, the height of which is proportional to the oscillator strength (marked above or below the rectangle) and the ionic versus covalent character is indicated by color (see insert). All symmetry assignments are approximate based on the symmetry labels of parent linear polyenes.
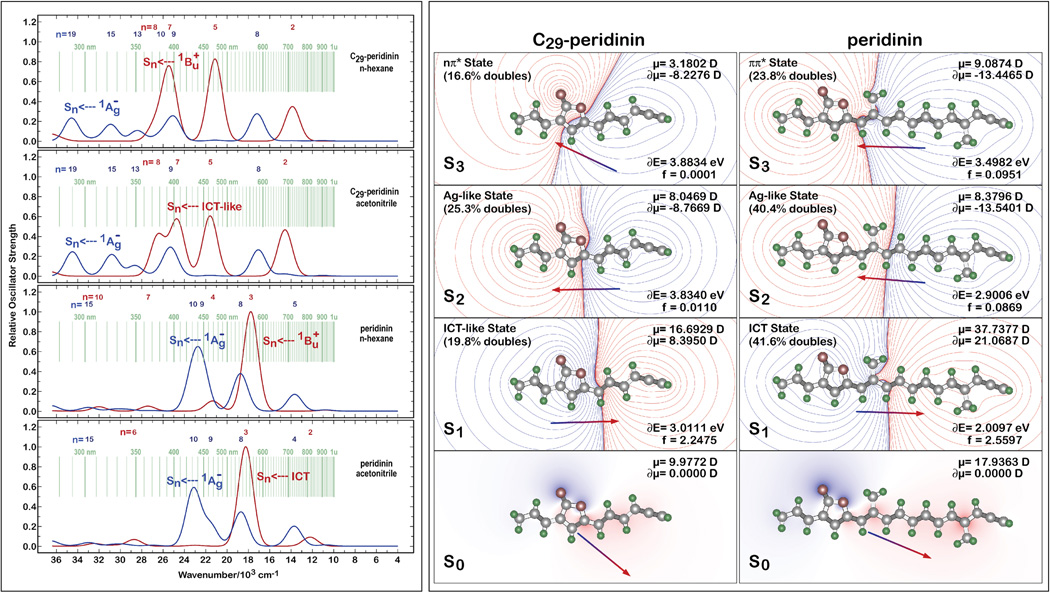
A simulation of the transient absorption spectra of C29-peridinin and peridinin in n-hexane and acetonitrile based on full single configuration interaction (CIS) methods and PCM solvent effect theory is presented in the left panel of Figure 6. The blue spectra were generated assuming the ground state geometry and that the lowest excited singlet state is the 21Ag − state. The red spectra were generated based on the relaxed ICT (or 1Bu + in n-hexane) geometry with all transitions occurring from that state. For spectral features involving C29-peridinin, the lowest-lying relaxed singlet state in polar solvent is referred to as an ICT-like state, which should be taken to mean a weaker formation of the ICT state relative to that of peridinin (see below). Appropriately narrow bandwidths were used for the simulations so that the individual spectral features could be better discerned visually. The numbers at the top of each spectrum in Figure 6 indicate the index of the final singlet state. A comparison of the simulation (Figure 6) with the experimental results (Figure 3) provides a useful perspective on the significant differences between C29-peridinin and peridinin. While recognizing that a full CIS calculation will not be able to properly simulate the position or properties of the 21Ag − state, the simulation does provide insights into the multiple bands that are present in the transient absorption spectra of C29-peridinin.
Figure 6.
Simulation of the transient absorption spectra (left panel) and comparison of the electrostatic properties (right panel) of C29-peridinin and peridinin in various solvents. The results shown in the left panel were generated using full CIS methods to calculate the transition lengths, but with CIS(D) energy corrections for the origin states. The results shown in the right panel were generated using SAC-CI methods with level three selection of the doubly excited states.
The simulations of the transient absorption spectra shown in Figure 6 indicate that those of C29-peridinin are quite different from those of peridinin. First, the intensities of the bands are less for all transitions in C29-peridinin compared to analogous bands in peridinin. Second, there is one additional band predicted for both the set originating from the 11Ag − state (blue spectra in Figure 6) and the relaxed 1Bu+/ICT-like state (red spectra in Figure 6), which is consistent with the experimental observation of a long-lived band at 700 nm whose position does not depend on the solvent. The computations show that this additional band corresponds to the transition, S1 (relaxed) → S8, and that it is more apparent in polar solvent due to separation from nearby bands that partially mask it. Moreover, the wavelength of the band is predicted to be insensitive to the solvent environment. Thus, the calculations are in good agreement with the general features of the observed spectra (Figure 3) and provide an explanation for the appearance of an additional band at 700 nm for C29-peridinin. This band is also predicted to be present in peridinin in polar solvent (Figure 6), but it is significantly weaker and therefore not observed experimentally.
In view of these findings, it is important to reflect on the nature of the ICT state in C29-peridinin and address the question of whether this molecule actually generates an ICT state or simply possesses a lowest-lying relaxed 1Bu + state having the properties of an ICT state. The best perspective on this question is provided by the symmetry-adapted-cluster configuration-interaction (SAC-CI) calculations presented in the right panel of Figure 6 where the electrostatic properties of C29-peridinin and peridinin in methanol are shown for the relaxed excited singlet state. Examining the relaxed excited singlet state is critical to an analysis of the ICT state because both experiment and theory provide strong evidence that the ICT state is an evolved state that is created through relaxation in the singlet manifold [15]. In comparing the properties of the lowest-lying relaxed excited singlet state of C29-peridinin with those of peridinin, significant differences observed when the molecules are dissolved in methanol (Figure 6) suggest that C29-peridinin has an ICT-like state rather than a full ICT state for the following reasons: First, the dipole moment change for C29-peridinin upon excitation into this state is significant (δµ = 8.4 D), but it is a fraction of that calculated for peridinin (δµ = 21 D). This value is considerable, but it is more similar to the 1Bu + states of polar retinyl polyenes and carotenoids than to the ICT state of peridinin [15, 28–34]. Nevertheless, the dipole moment direction and charge shift contours shown in Figure 6 are indicative of a charge transfer from the allenic region into the lactone region; i.e. ICT-like behavior. Furthermore, one of the unique characteristics of the ICT state in peridinin is its significant doubly excited character (41.6%) [15], which is considerably larger than predicted for C29-peridinin (19.8%). The smaller dipole moment and doubly excited character of the C29-peridinin S1 state is not due to a fundamental difference in the charge transfer process, rather it occurs as a consequence of the length of the polyene. A shorter polyene system cannot support as large a charge transfer configuration. Hence, it can be concluded that C29-peridinin does indeed have an ICT state, but that this state is better viewed as an ICT-like or partial ICT state rather than a full ICT state as was found in the parent molecule, peridinin.
These findings reveal an apparent contradiction between the computations which indicate that C29-peridinin does not support the formation of a full ICT state in polar solvents, and the experimental observations which reveal a large effect of solvent polarity on the lifetime of the lowest excited singlet state. The present investigation shows that it is an over-simplification to assume that the extent of ICT character is the sole factor controlling the dynamics of the lowest excited state of C29-peridinin, peridinin, and other analogues when they are dissolved in polar solvents. This is because a short lifetime can also be associated with a level ordering reversal of the lowest 21Ag − and 11Bu + states in polar solvents as is clearly the case for C29-peridinin and peridinin in acetonitrile (Figure 5). Moreover, the excited state lifetimes of these molecules will scale inversely with the oscillator strengths of their relaxed singlet states [35]. Therefore, the impact of the ICT state on the lifetime of the lowest excited singlet state of peridinin and analogues is not due solely to its large dipole moment, but also to an increase in the oscillator strength of the ICT transition in polar solvents [15].
Supplementary Material
HIGHLIGHTS.
Spectra of C29-peridinin were compared with a series of peridinin analogues.
Quantum mechanical computational analysis augmented the experiments
An intramolecular charge transfer (ICT) state controls the photophysics
It has a smaller dipole moment and less doubly excited character than peridinin
Acknowledgements
Work in the laboratory of HAF was supported by grants from the National Science Foundation (MCB-1243565) and the University of Connecticut Research Foundation. Work in the laboratory of RRB was supported by grants from the National Science Foundation (EMT-0829916), the National Institutes of Health (GM-34548) and the Harold S. Schwenk Sr. Distinguished Chair in Chemistry. Work in the laboratory of SK was supported by a Grant-in-Aid for Scientific Research on Innovative Areas “Organic Synthesis based on Reaction Integration” and a Grant-in-Aid for Scientific Research (C) 25410183 from the Ministry of Education, Culture, Sports, Science and Technology, Japan. Time-resolved spectroscopy was performed in the Photosynthetic Antenna Research Center (PARC), an Energy Frontier Research Center funded by the U.S. Department of Energy, Office of Science, Office of Basic Energy Sciences under Award Number DE-SC 0001035.
Footnotes
Publisher's Disclaimer: This is a PDF file of an unedited manuscript that has been accepted for publication. As a service to our customers we are providing this early version of the manuscript. The manuscript will undergo copyediting, typesetting, and review of the resulting proof before it is published in its final citable form. Please note that during the production process errors may be discovered which could affect the content, and all legal disclaimers that apply to the journal pertain.
References
- 1.Hiller RG. In: The Photochemistry of Carotenoids. Frank HA, Young AJ, Britton G, Cogdell RJ, editors. Dordrecht: Kluwer Academic; 1999. p. 81. [Google Scholar]
- 2.Macpherson AN, Hiller RG. In: Light-harvesting antennas in photosynthesis. Green BR, Parson WW, editors. Kluwer Academic Publishers; 2002. p. 323. [Google Scholar]
- 3.Mimuro M, Akimoto S. In: Photosynthesis in algae. Larkum A, Douglas S, Raven J, editors. Kluwer Academic Publishers; 2003. p. 335. [Google Scholar]
- 4.Bautista JA, et al. J. Phys. Chem. B. 1999;103:8751. [Google Scholar]
- 5.Frank HA, et al. J. Phys. Chem. B. 2000;104:4569. [Google Scholar]
- 6.Zigmantas D, Hiller RG, Yartsev A, Sundström V, Polivka T. J. Phys. Chem. B. 2003;107:5339. [Google Scholar]
- 7.Zigmantas D, Hiller RG, Sharples FP, Frank HA, Sundström V, Polivka T. Phys. Chem. Chem. Phys. 2004;6:3009. [Google Scholar]
- 8.Chábera P, Fuciman M, Hříbek P, Polívka T. Phys. Chem. Chem. Phys. 2009;11:8795. doi: 10.1039/b909924g. [DOI] [PubMed] [Google Scholar]
- 9.Pariser R. J. Chem. Phys. 1955;24:250. [Google Scholar]
- 10.Hudson B, Kohler B. Ann. Rev. Phys. Chem. 1974;25:437. [Google Scholar]
- 11.Callis PR, Scott TW, Albrecht AC. J. Chem. Phys. 1983;78:16. [Google Scholar]
- 12.Birge RR. Accts. Chem. Res. 1986;19:138. [Google Scholar]
- 13.Christensen RL, Barney EA, Broene RD, Galinato MGI, Frank HA. Arch. Biochem. Biophys. 2004;430:30. doi: 10.1016/j.abb.2004.02.026. [DOI] [PubMed] [Google Scholar]
- 14.Christensen RL. In: The Photochemistry of Carotenoids. Frank HA, Young AJ, Britton G, Cogdell RJ, editors. Dordrecht: Kluwer Academic Publishers; 1999. p. 137. [Google Scholar]
- 15.Wagner NL, Greco JA, Enriquez MM, Frank HA, Birge RR. Biophys. J. 2013;104:1314. doi: 10.1016/j.bpj.2013.01.045. [DOI] [PMC free article] [PubMed] [Google Scholar]
- 16.Kajikawa T, et al. Org. Lett. 2009;11:5006. doi: 10.1021/ol901940g. [DOI] [PMC free article] [PubMed] [Google Scholar]
- 17.Niedzwiedzki DM, et al. J. Phys. Chem. B. 2009;113:13604. doi: 10.1021/jp903923r. [DOI] [PMC free article] [PubMed] [Google Scholar]
- 18.Chatterjee N, et al. Arch. Biochem. Biophys. 2009;483:146. doi: 10.1016/j.abb.2008.10.035. [DOI] [PMC free article] [PubMed] [Google Scholar]
- 19.Kaligotla S, et al. Photosynth. Res. 2010;103:167. doi: 10.1007/s11120-010-9535-y. [DOI] [PubMed] [Google Scholar]
- 20.Niedzwiedzki DM, Kajikawa T, Aoki K, Katsumura S, Frank HA. J. Phys. Chem. B. 2013;117:6874. doi: 10.1021/jp400038k. [DOI] [PubMed] [Google Scholar]
- 21.Britton G, Liaaen-Jensen S. H. Pfander: Carotenoids Handbook. Basel-Boston-Berlin: Birkhäuser Verlag; 2004. [Google Scholar]
- 22.Niedzwiedzki DM, Fuciman M, Frank HA, Blankenship RE. Biochim. Biophys. Acta-Bioenerg. 2011;1807:518. doi: 10.1016/j.bbabio.2011.03.004. [DOI] [PubMed] [Google Scholar]
- 23.Zigmantas D, Polivka T, Hiller RG, Yartsev A, Sundström V. J. Phys. Chem. A. 2001;105:10296. [Google Scholar]
- 24.Ehlers F, Wild DA, Lenzer T, Oum K. J. Phys. Chem. A. 2007;111:2257. doi: 10.1021/jp0676888. [DOI] [PubMed] [Google Scholar]
- 25.Kopczynski M, Ehlers F, Lenzer T, Oum K. J. Phys. Chem. A. 2007;111:5370. doi: 10.1021/jp0672252. [DOI] [PubMed] [Google Scholar]
- 26.van Stokkum IHM, Larsen DS, van Grondelle R. Biochim. Biophys. Acta. 2004;1657:82. doi: 10.1016/j.bbabio.2004.04.011. [DOI] [PubMed] [Google Scholar]
- 27.Niedzwiedzki D, et al. J. Phys. Chem. B. 2007;111:5984. doi: 10.1021/jp070500f. [DOI] [PubMed] [Google Scholar]
- 28.Enriquez MM, Fuciman M, LaFountain AM, Wagner NL, Birge RR, Frank HA. J. Phys. Chem. B. 2010;114:12416. doi: 10.1021/jp106113h. [DOI] [PMC free article] [PubMed] [Google Scholar]
- 29.Mathies R, Stryer L. Proc. Natl. Acad. Sci. USA. 1976;73:2169. doi: 10.1073/pnas.73.7.2169. [DOI] [PMC free article] [PubMed] [Google Scholar]
- 30.Birge RR, Hubbard LM. J. Am. Chem. Soc. 1980;102:2195. [Google Scholar]
- 31.Birge RR, Zhang CF. J. Chem. Phys. 1990;92:7178. [Google Scholar]
- 32.Ponder M, Mathies R. J. Phys. Chem. 1983;87:5090. [Google Scholar]
- 33.Zigmantas D, Hiller RG, Sundström V, Polivka T. Proc. Natl. Acad. Sci. USA. 2002;99:16760. doi: 10.1073/pnas.262537599. [DOI] [PMC free article] [PubMed] [Google Scholar]
- 34.Premvardhan L, Papagiannakis E, Hiller RG, van Grondelle R. J. Phys. Chem. B. 2005;109:15589. doi: 10.1021/jp052027g. [DOI] [PubMed] [Google Scholar]
- 35.Strickler SJ, Berg RA. J. Chem. Phys. 1962;37:814. [Google Scholar]
Associated Data
This section collects any data citations, data availability statements, or supplementary materials included in this article.


