Abstract
We sought to determine if a specific class I and II HDAC inhibitor (ITF2357) was able to decrease disease in lupus-prone NZB/W mice through regulation of T cell profiles. From 22 - 38 weeks-of-age, NZB/W and non-lupus NZW mice were treated with ITF2357 (5 mg/kg or 10 mg/kg), or vehicle control. Body weight and proteinuria were measured every 2 weeks, while sera anti-dsDNA and cytokine levels were measured every 4 weeks. Kidney disease was determined by sera IgG levels, immune complex deposition, and renal pathology. T lymphocyte profiles were assessed using flow cytometric analyses. Our results showed NZB/W mice treated with the high-dose of ITF2357 had decreased renal disease and inflammatory cytokines in the sera. Treatment with ITF2357 decreased the Th17 phenotype while increasing the percentage of Tregs as well as Foxp3 acetylation. These results suggest that specific HDAC inhibition may decrease disease by altering T cell differentiation and acetylation.
Keywords: Systemic Lupus Erythematosus, histone deacetylase, regulatory T cells
1. Introduction
Systemic lupus erythematous (SLE) is an autoimmune disease in which a genetic predisposition coupled with an environmental trigger initiates disease. The major cause of morbidity and mortality is lupus nephritis (LN), which affects over half of all SLE patients [1]. Altered T cell profiles leading to a loss of self-tolerance, an increased immune response, and decreased B cell suppression contribute to glomerular immune complex deposition and kidney dysfunction [2]. Treg cell numbers and function are diminished in patients with SLE [3, 4]. The percentage of Treg cells has been shown to be inversely related to anti-dsDNA serum levels and disease severity in human SLE patients [5].
New Zealand Black/BinJ (NZB) mice spontaneously develop autoimmune abnormalities including hemolytic anemia, increased levels of Ig, glomerulonephritis, and anti-dsDNA antibodies. New Zealand White/LacJ (NZW) mice do not develop severe autoimmune disease and can be used as non-lupus controls [6, 7]. NZW mice have a normal lifespan, but do develop anti-DNA Abs late in life and have been demonstrated to have increased numbers of Treg cells as early as 5-6 week-of-age [8]. The F1 progeny (NZB/W) from the cross between NZB and NZW mice develop lupus-like symptoms including glomerulonephritis, immune complex deposition, activated T and B cells, and autoantibody production to dsDNA [6]. NZB/W mice share many similar symptoms and disease pathologies with human SLE and serve as an acceptable model to study human disease. [9, 10]. NZB/W mice begin to develop disease by 20 weeks-of-age, which progresses to severe renal disease by 36 weeks-of-age [11]. NZB/W mice predominantly overproduce the IgG2a subclass of IgG, which is associated with increased SLE pathogenicity [12].
T cells play a critical role in the adaptive immune response and their dysregulation has been implicated in many autoimmune diseases, including SLE. Cytotoxic T cell (CD8+) activity is known to be reduced in SLE patients, which contributes to increased B cell activity leading to autoantibody production [13, 14]. CD4+ T cells can differentiate into 4 major subsets: Th1, Th2, Th17, and Treg cells [15]. Th2 cells are instrumental to humoral immunity and are responsible for secreting IL-4, IL-5, and IL-10 [16-18]. The balance between Th1 and Th2 subsets is an important regulator of autoimmune disease [19]. Studies of SLE have demonstrated an increase in both Th1 and Th2 cytokines in murine models as well as in humans [19]. Th17 (CD4+ RORγ+IL-17+) cells produce IL-17 and have recently been implicated in multiple autoimmune diseases [20]. SLE patients tend to have increased levels of Th17 cells leading to overproduction of IL-17 and increased activation of inflammatory mediators contributing to tissue damage [14, 19, 21, 22]. Treg cells (CD4+CD25+Foxp3+) function to suppress the proliferation of other immune cell subsets, regulating cytokine production and self-reactive T cells. Differentiation of CD4+ T cells into Treg cells requires the Foxp3 transcription factor. When Foxp3 is mutated in T cells, autoimmune disease can develop due to the immune system's inability to regulate Th1 pro-inflammatory cytokines including IL-2, IFN-γ, and TNF-α, involved with cell-mediated immunity. Studies in healthy mice have shown that depletion of Tregs leads to the development of autoimmune disease in these animals [23-26]. Histone deacetylases (HDACs) are able to influence the Foxp3 gene directly through histone deacetylation as well as indirectly by altering Foxp3 transcription factors [27, 28].
HDACs have been implicated for their role in autoimmune dysregulation. DNA is packaged into approximately 146 bp and structured around a histone core to form a nucleosome [29]. Histone proteins can be modified through the addition of acetyl groups to lysine residues by histone acetyl transferases (HATs), regulating gene expression [30, 31]. Conversely, HDACs remove acetyl groups from the lysine residues, condensing chromatin and preventing gene transcription. HDAC inhibitors prevent the removal of acetyl groups from histone proteins leading to hyperacetylation of histones [28, 32]. HDACs are not only able to epigenetically regulate gene transcription, but more recently have been shown to regulate acetylation of non-histone proteins including transcriptional factors, DNA repair enzymes, and structural proteins. HDACs are thereby able to directly influence protein stability, protein-protein interactions, and protein-DNA interactions through post-translational acetylation [33, 34].
HDACs are grouped into four classes: classes I – IV. Class I HDACs, which includes HDAC 1, 2, 3, 6, and 8, are located solely within the nucleus. Class II HDACs, which includes HDAC 4, 5, 7, and 9) are found in both the nucleus and the cytoplasm [27, 32]. Class III HDACs consist of seven mammalian silent information regulator two proteins (sirtuins or Sirt) [32, 35]. Class IV HDACs solely consist of HDAC 11,which modify DNA expression by changing the core histones [32]. HDACi are able to target specific classes of HDAC proteins eliciting various effects on both histone and non-histone proteins.
The current studies were designed to determine whether a class I and II HDACi would decrease lupus nephritis by epigenetically altering the differentiation of splenic T cells. ITF2357 is a known inhibitor of class I and II HDACS with anti-inflammatory properties [36]. Previous studies have shown that ITF2357, a hydroxamic acid-derived compound, is selective against HDACs 1, 2, 3, 4, 6, and 7 and has demonstrated no specificity for class III or IV HDACs [37, 38]. Current research of ITF2357 has indicated it is able to reduce the production of pro-inflammatory cytokines (IL-1β, TNF-α, IL-6, and IFN-γ) at a low dose (1.0 mg/kg) without adverse cytotoxic effects [39-43]. ITF2357 has been demonstrated to be efficacious in cancer treatment [44] and is in a phase II clinical trial for children with active systemic onset juvenile idiopathic arthritis [45].
2. Materials and Methods
2.1. Mice
Female NZB/W F1 and NZW mice were purchased from Jackson Laboratories (Bar Harbor, ME, USA). All mice were used in accordance with the Institutional Animal Care and Use Committee of Virginia Polytechnic Institute and State University (Virginia Tech) and housed in the animal facility at the Virginia-Maryland Regional College of Veterinary Medicine (VMRCVM, Blacksburg, VA, USA).
2.2. In vivo treatment
Mice were injected intraperitoneally 5 days/week with the vehicle control (DMSO), ITF2357 treatment at 5mg/kg, or ITF2357 treatment at 10mg/kg. The total volume of each injection was 50 μl. Treatment began at 22-weeks-of-age until euthanization during late stage clinical disease at 38 weeks-of-age. ITF2357 was courtesy of a generous donation from Dr. Paolo Mascagni and Italfarmaco for use in all studies. Proteinuria and weight were measured every two weeks and blood was collected once a month for sera analysis. Proteinuria was measured in a blinded manner by a standard semi-quantitative test using Siemens Uristix dipsticks (Siemens Healthcare, Deerfield, IL, USA). Results were quantified according to the manufacturer's instructions and scored as follows: dipstick reading of 0 mg/dL = 0, trace = 1, 30-100 mg/dL = 2, 100-300 mg/dL = 3, 300-2000 mg/dL = 4, and 2000+ mg/dL = 5.
2.3. Measurement of autoantibodies
Sera were collected prior to initiation of treatment at 22 weeks-of-age and every 4 weeks until euthanization. The mice were anesthetized using isoflurane (Piramal Healthcare, Mumbai, Maharashtra, India) and bled from the retro-orbital sinus. Blood was allowed to clot for 2 hours and then centrifuged for 15 min at 10,000 × g. The levels of sera antibodies to dsDNA were measured by ELISA. High-binding plates were coated with 100 μL of 5 μg/mL Calf Thymus DNA (Sigma, St. Louis, MO, USA) in saline-sodium citrate (SSC) buffer and incubated overnight at 37°C. Plates were washed 3 times with 0.05% Tween-20 in 1X PBS (Thermo Scientific, Waltham, MA, USA) and then blocked with 1% BSA for 1 hour (BSA, Sigma, St. Louis, MO). Sera samples were added to the plate at a 1:100 dilution, followed by a two-fold serial dilution. The plates were incubated for 45 minutes at 37°C. The plates were then incubated with an HRP-conjugated goat anti-mouse IgG gamma chain specific Ab (1:4000, Southern Biotech, Birmingham, AL, USA) and washed as described above. TMB substrate (Pierce, ThermoScientific, Rockford, IL, USA) was added to the wells and the plate was read at 380 nm on a Spectramax 340PC microplate spectrophotometer (Molecular Devices, Sunnyvale, CA, USA). A final dilution of 1:1600 was reported.
2.4. Pathology
At the time of euthanization, the kidneys were removed and cut in half. One half of the kidney from each mouse was fixed in formalin, embedded in paraffin, sectioned, and stained with Periodic acid-Schiff (PAS). Kidney sections were scored (0 – 4) for glomerular proliferation, inflammation, crescent formation, necrosis, and fibrosis by a pathologist (David Caudell) in a blinded manner.
2.5. Immunofluorescence staining
One-half of each kidney was placed in OCT media and snap-frozen in a slurry containing dry ice and 2-methylbutane (Fisher Scientific, Hampton, NH, USA). Frozen kidney sections were cut into 3 μM sections and stained with goat anti-mouse IgG conjugated to FITC (Pierce) diluted 1:100 or goat anti-mouse C3-FITC (Pierce) diluted 1:100. Kidney sections were fixed in acetone for 10 minutes and washed 3 times with 1X PBS for 5 minutes each. The sections were then incubated with C3 or IgG antibodies in a humid chamber for 1 hour. Slides were mounted using Vectashield mounting media with DAPI (Vector Labs, Burlingame, CA, USA) and examined by fluorescent microscopy. Sections were scored (0 – 4) for immune complex deposition by a pathologist in a blinded manner.
2.6. Fluorescent histone acetylation
Three μM sections were obtained from kidneys frozen in OCT media. Kidney sections were thawed and fixed in acetone for 10 minutes at room temperature. Slides were rinsed 3 times with 1X PBS for 5 minutes each. Slides were incubated overnight at 4°C with acetyl-Histone H3 (Lys9) (Alexa Fluor 488,) diluted 1:500 in 1X PBS containing 1% BSA and 0.3% Triton X-100. Slides were rinsed with 1X PBS 3 times, mounted using Vectashield mounting medium, and examined for fluorescence.
2.7. Flow cytometric analysis
A single-cell suspension was obtained from the spleens of NZB/W and NZW mice at 38-weeks-of age. Briefly, spleens were dissociated using a wire mesh and the cell suspension was centrifuged for 5 minutes at 300 × g. Cells were treated with RBC lysis buffer for 5 minutes at room temperature to lyse erythrocytes, washed 2 times with 1X PBS and then resuspend in flow cytometry staining buffer. Cells were stained with Allophycocyanin (APC)-conjugated CD3, FITC-conjugated CD4, eFluor450 (eF450)-conjugated CD8a, PerCP-CY5.5-conjugated CD25, and PE-conjugated Foxp3, or Fitc-CD4, APC-ROR-γ, and PE-IL-17, or APC-CD3, Fitc-CD4, and PE-CD8 anti-mouse mAbs (eBioscience, San Diego, CA, USA). Fluorescence was measured using a FACS Aria 1 (BD Biosciences, San Jose, CA) and data was analyzed by FlowJo software (Tree Star, Ashland, OR, USA).
2.8. Glomerular Isolation
The cortical tissue was isolated from one kidney of each mouse and pooled by treatment group. The tissue was minced using a surgical blade and then pressed through grading sieves (180 and 150μM mesh). The cells remaining on the 75μM mesh were collected in 1X PBS, force-pressed through a 21-gauge needle, and centrifuged. The pelleted cells were resuspended in 750 U/mL Worthington type I collagenase solution and gently stirred in a water bath at 37°C for 20 minutes. Glomerular cells were pelleted and then resuspended in RNAlater (QIAGEN, Valencia, CA, USA) and stored at −20°C until RNA isolation.
2.9. Isolation of RNA
RNA was isolated using the mirVana miRNA isolation kit according to the manufacturer's protocol (Applied Biosystems, Carlsbad, CA, USA). Briefly, the cells were lysed and mixed with acid-phenol: chloroform for organic extraction. The lysate was centrifuged to separate the organic phases. The upper aqueous phase was removed and mixed with 100% ethanol which was transferred onto a filter cartridge. RNA was eluted from the filter using 95°C elution solution. The eluates were quantified on a spectrophotometer (Nanodrop, Thermo Scientific, Waltham, MA, USA). An aliquot was taken and diluted to 1 ng/μL for real-time RTPCR. The eluted RNA was stored at −80°C.
2.10. Real-time RT-PCR
IL-10, IL-6 and TGF-β mRNA expression were measured using TaqMan Gene Expression assays (Applied Biosystems, Carlsbad, CA, USA). The RT master mix was mixed with 10 μL of 1ng/μL RNA template. The negative control received 10 μL of nuclease-free water. RT was performed in an iCycler using the following parameter values: 25°C for 10 minutes, 37°C for 120 minutes, 85°C for 5 minutes, and held at 4°C. The RT product was stored at −20°C until PCR was performed as described above. The ΔCT was calculated using the endogenous control GAPDH, and then the ΔΔCT was determined by calculating the fold change in expression between the NZB/W mice and the NZW controls. All samples were run in triplicate.
2.11. ELISA
IL-1β, IL-10, and TGF-β protein levels were measured from the sera by ELISA according to the manufacturer's protocol (eBioscience, San Diego, CA, USA). The plate was read at 450 nm on a microplate spectrophotometer.
2.12. In vitro immunoprecipitation and Western blotting
To determine if ITF2357 alters Foxp3 acetylation in vitro, 22-week-old female NZB/W mice were euthanized and the spleens were made into single-cell suspensions using wire mesh. At the time of euthanization all mice had a proteinuria of 30-100 mg/dL. Naïve CD4+ T cells were isolated using magnetic beads and cultured in RPMI media containing 50 μM 2-ME, 1% streptomycin/penicillin, 2 mM HEPES, and 10% FBS at 37°C in a 5% CO2-humidified incubator. Splenic CD4+ T cells were differentiated into Tregs with anti-CD3 (5μg/ml), anti-CD28 (2μg/ml), recombinant human IL-2 (rhIL-2) (20 U/ml), and TGF-β (2ng/ml). Purified, unstimulated CD4+ T cells were used as a control. Following 72 hours of incubation, Tregs were treated with varying concentrations of ITF2357 for 24 hours and then collected. Foxp3 protein was immunoprecipitated and IgG immunoprecipitation was performed as an isotype control. The Bradford protein assay was used to normalize protein levels. Western blot analysis was performed to determine protein expression of acetylated histones. Briefly, cell lysates were incubated overnight at 4°C with a Foxp3 Ab. A 50% protein G agarose bead slurry was added to the cells and incubated at 4°C for 2 hours. Cells were spun down for 30 seconds at 300 × g and rinsed 5 times with cell lysis buffer. The cell pellet was resuspended 1:1 in cell lysis buffer and Laemmli buffer. The samples were heated to 95°C for 5 minutes and then loaded onto a 15% SDS-PAGE gel. The proteins were transferred to a polyvinylidene difluoride (PVDF) membrane and incubated with antibodies against acetylated histones and β-actin (Cell Signaling, Boston, MA, USA). All experiments were run in triplicate.
2.13. Statistical Analysis
Statistical analysis was performed using Student's unpaired t-test (two-tailed). P values less than 0.05 were considered statistically significant.
3. Results
3.1. HDAC inhibition decreased sera and urinary markers of SLE in NZB/W mice
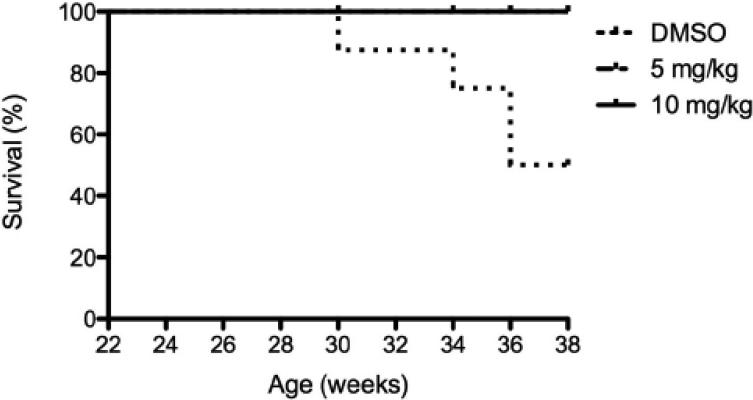
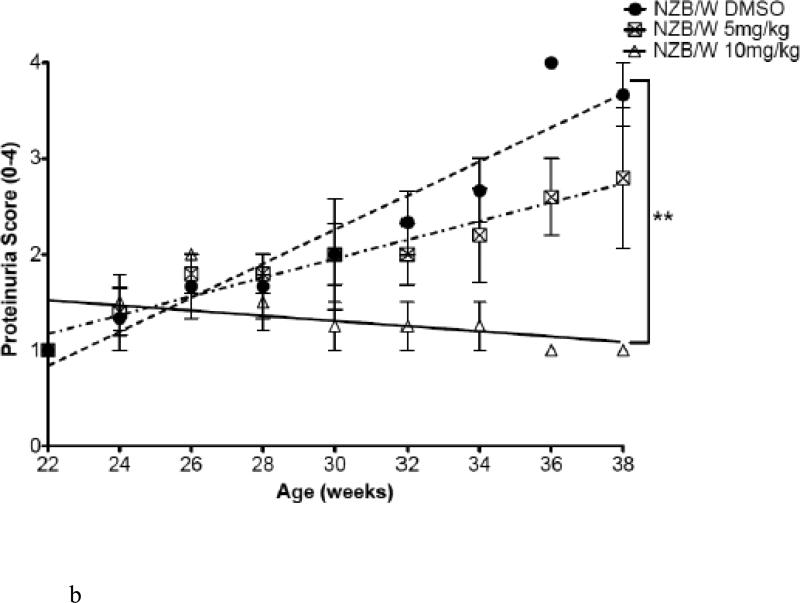
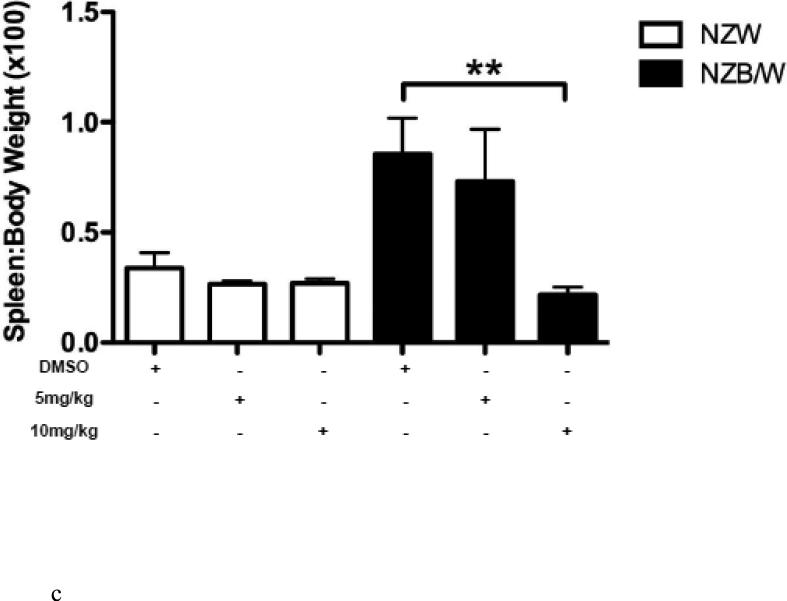
Body weight and proteinuria were monitored in NZW and NZB/W mice as they aged. In NZB/W mice treated with DMSO or 5 mg/kg ITF2357, proteinuria levels increased with age. Treatment with 10 mg/kg ITF2357 significantly decreased proteinuria levels as the mice aged (Figure 1 B). Proteinuria remained low in NZW mice regardless of treatment (data not shown). Following euthanization, body weight and spleen weight were measured and the ratio between spleen and body weight was calculated. The spleen: body weight ratio was significantly decreased in NZB/W mice treated with 10mg/kg ITF2357 compared to DMSO-treated NZB/W mice (Figure 1 C). 50% of the DMSO-treated NZB/W mice died before completion of the study. No mice receiving ITF2357 died during the study (Figure 1 A and Table 1).
Figure 1. Assessment of disease progression in NZB/W female mice.
(A) By 38 weeks-of-age, half of the NZB/W mice receiving the vehicle control alone had died. No NZW (control) mice or mice receiving ITF2357 treatment died before termination of the experiment. (B) Measurement of proteinuria in NZB/W F1 mice receiving intraperitoneal injections of ITF2357 (5 mg/kg in DMSO), (10 mg/kg in DMSO) or vehicle control (DMSO) at 22–38 weeks-of-age. (C) Spleen:body weight ratio was calculated. NZB/W mice treated with ITF2357 (10 mg/kg) had a decreased spleen:body weight ratio at 38 weeks-of-age (n ≥ 5 ; **p < 0.005).
Table 1. Mouse treatment groups and survival.
20 NZB/W and 15 NZW mice were randomly divided into 3 treatment groups prior to the initiation of treatment. During the study, 5 NZB/W mice in the DMSO treatment group died. No other mice died prior to the termination of the study.
| Treatment | Mouse Strain | No. of mice (beginning) | No. of mice (end) |
|---|---|---|---|
| DMSO (control) | NZW | 10 | 5 |
| ITF2357 (5mg/kg) | NZW | 5 | 5 |
| ITF2357 (10mg/kg) | NZW | 5 | 5 |
| DMSO (control) | NZB/W | 5 | 5 |
| ITF2357 (5mg/kg) | NZB/W | 5 | 5 |
| ITF2357 (10mg/kg) | NZB/W | 5 | 5 |
3.2. Treatment with ITF2357 reduced serum anti-double stranded DNA and IgG isotype levels
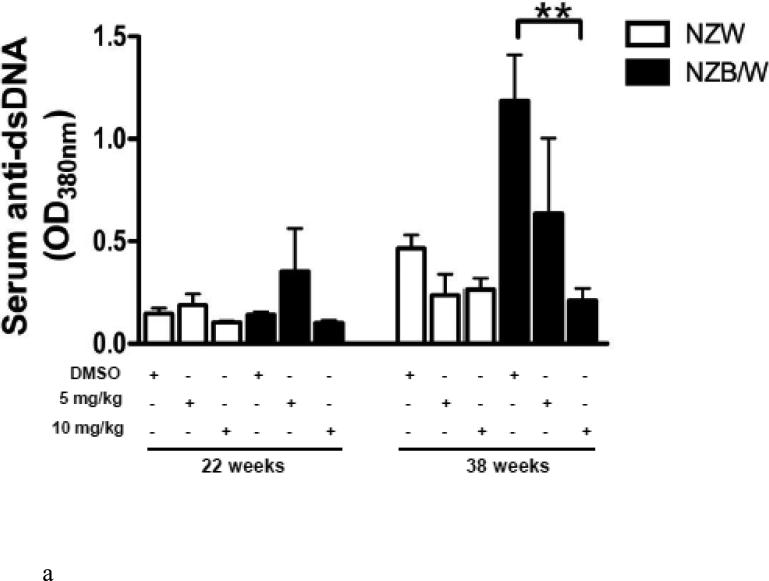
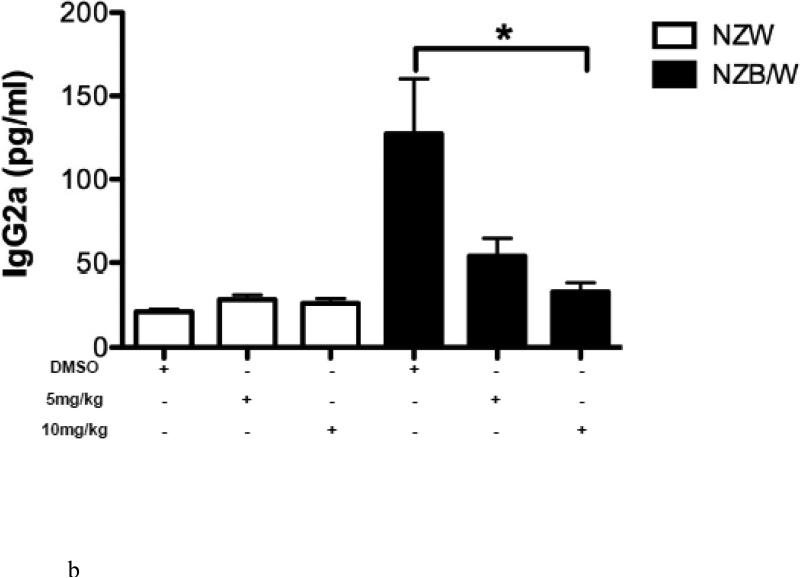
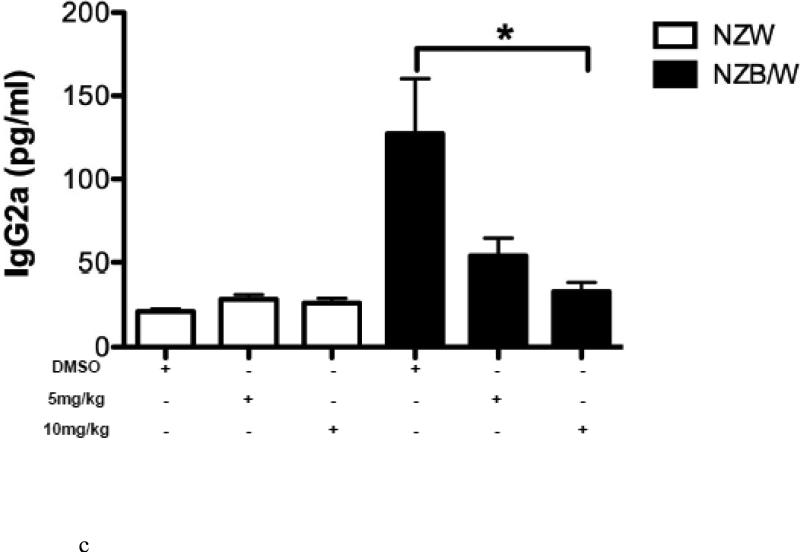
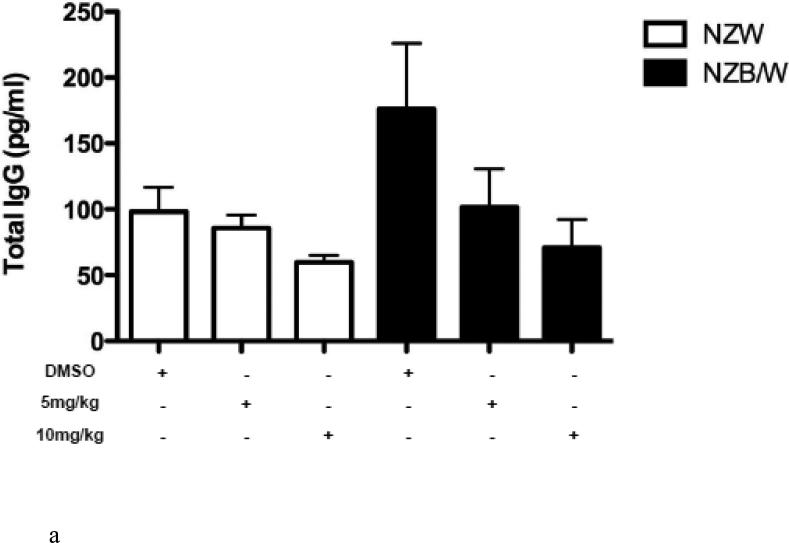
To determine if HDAC inhibition alters autoantibody production, serum anti-dsDNA levels were measured in NZW and NZB/W mice every 4 weeks beginning at 22 weeks-of-age through euthanization at 38 weeks-of-age. As the NZB/W mice aged, serum anti-dsDNA levels increased compared to the NZW controls. At 38 weeks-of-age the 10mg/kg ITF2357-treated NZB/W mice had significantly decreased levels of anti-dsDNA compared to the levels in NZB/W mice treated with the vehicle control alone (Figure 2 A). While there was a decrease in anti-dsDNA levels at 38 weeks-of-age from mice that were treated with 5 mg/kg ITF2357, these results were not statistically significant. There were no significant differences in serum anti-dsDNA levels between the groups at 22 weeks-of-age. SLE patients and lupus-prone mice have elevated levels of IgG isotypes, which contribute to disease by forming immune complexes in the kidneys leading to glomerulonephritis. A correlation between increased levels of IgG2a and glomerulonephritis has been shown by previous research [46]. Our study showed that NZB/W lupus-prone mice have elevated levels of IgG2a and total IgG at 38 weeks-of-age when compared with NZW controls. Treatment with ITF2357 decreased IgG2a and total IgG in a dose-dependent manner. At 10mg/kg, ITF2357 was able to decrease sera levels of IgG2a and total IgG to levels comparable to those in sera from non-diseased NZW mice, however these results were not statistically significant (Figure 2 B-C).
Figure 2. SLE sera biomarkers of disease were decreased in NZB/W mice following HDACi treatment.
(A) Measurement of sera anti-dsDNA in NZW and NZB/W mice at 22 weeks-of-age (prior to treatment) and at 38 weeks-of-age (following 16 weeks of treatment). Treatment with ITF2357 (10 mg/kg) significantly decreased anti-dsDNA production in 38-week-old NZB/W mice. (B-C) Sera IgG2a and total IgG levels were decreased in NZB/W mice treated with the HDACi (n ≥ 5; **p < 0.005).
3.3. Effects of histone deacetylation on cytokine production
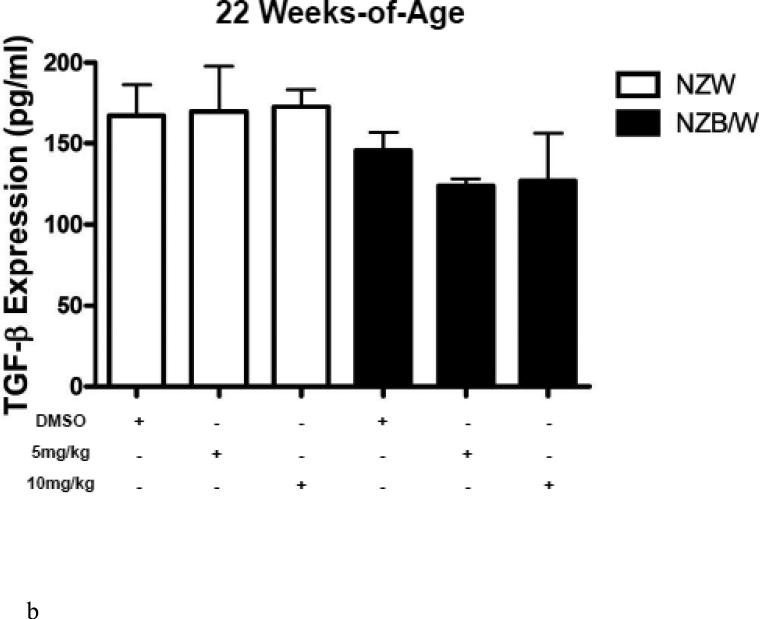
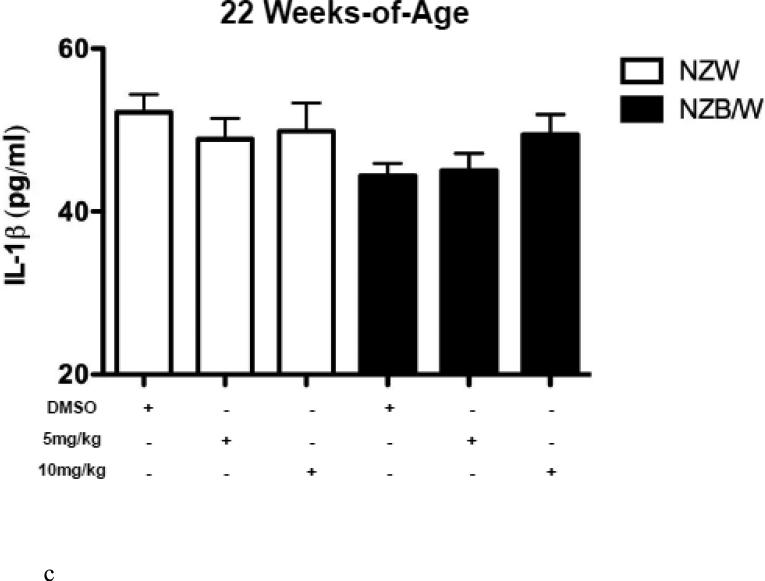
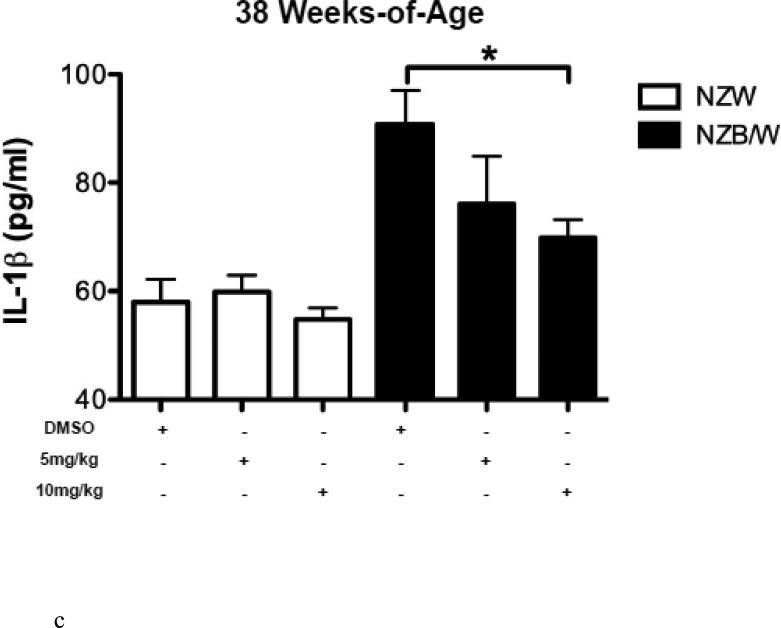
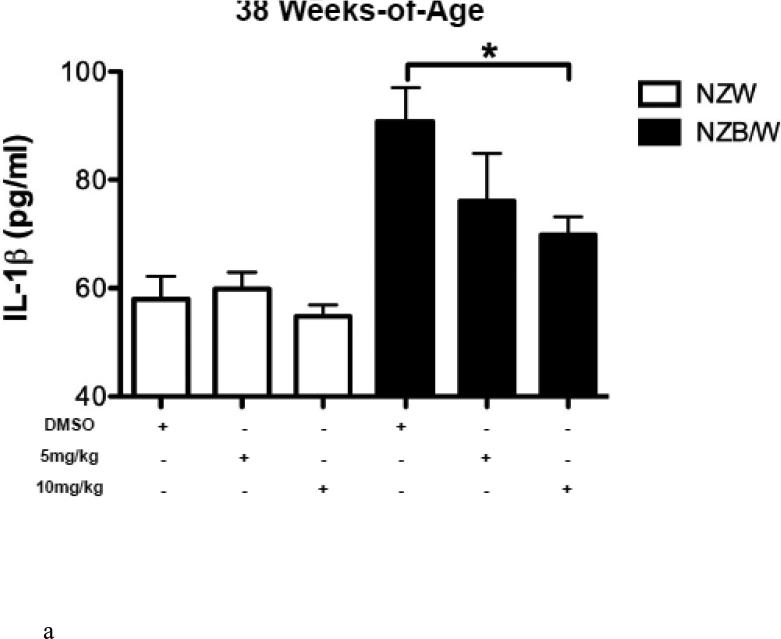
HDAC inhibitors have been shown to decrease levels of pro-inflammatory cytokines. Therefore we sought to examine the expression of SLE-associated inflammatory cytokines. Cytokine levels were measured in the sera of NZW and NZB/W mice beginning at 22 weeks-ofage every 4 weeks until euthanization at 38 weeks-of-age. TGF-β levels were not significantly different between groups of mice at 22 weeks-of-age (Figure 3 A). As the mice aged, TGF-β decreased in both NZW and NZB/W mice; however, the effect was more marked in the NZB/W mice. Treatment with the HDACi at 10 mg/kg increased TGFβ levels comparable to those in age-matched NZW mice (Figure 3 B). IL-1β sera levels were similar in both NZW and NZB/W mice at 22 weeks-of-age (Figure 3 C). As the NZB/W mice aged, IL-1β production increased, however, treatment with ITF2357 was able to reverse this effect (Figure 3 D).
Figure 3. Cytokine production in lupus-prone mice was assessed.
(A-D) TGF-β and IL-1β were measured in sera collected from mice prior to treatment (22 weeks-of-age) and following HDACi treatment every 4 weeks until mice were euthanized (38 weeks-of-age). At 22 weeks-of-age there were no significant differences in sera TGF-β or IL-1β (A,C). NZB/W mice treated with vehicle control had decreased levels of TGF-β compared to the NZW mice. The level of sera TGF-β was significantly increased in NZB/W mice treated with ITF2357 (10mg/kg) to levels comparable with NZW control mice at 38 weeks-of-age (B). There was a dose-dependent decrease in sera IL-1β in 38-week-old NZB/W mice treated with ITF2357 (n ≥ 5; *p < 0.05).
3.4. Glomerular mRNA expression is altered following HDAC inhibition in vivo
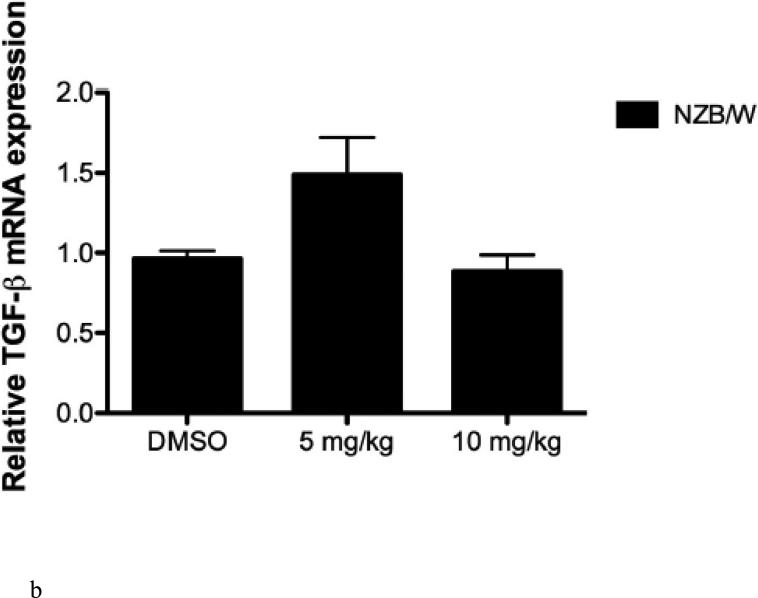
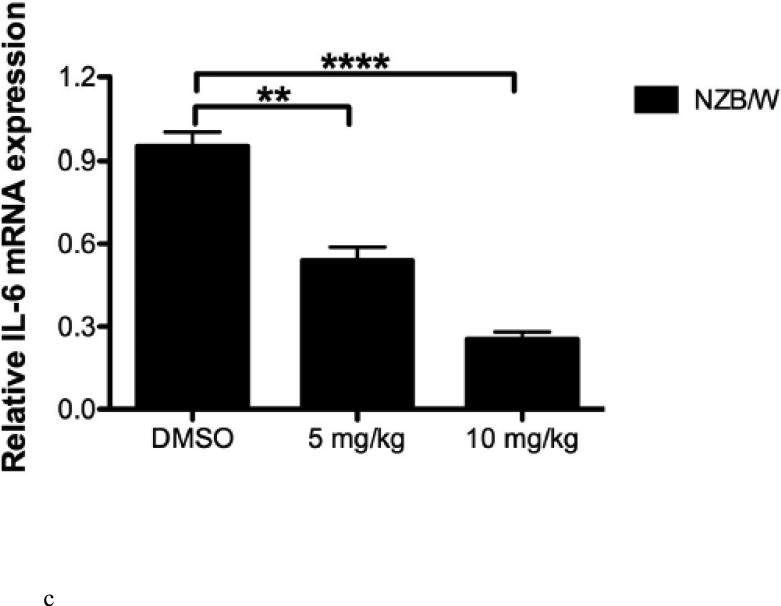
Relative glomerular mRNA expression of IL-10, TGF-β, and IL-6 were determined using RT-PCR. HDACi therapy (10mg/kg) was able to decrease IL-10 expression in the glomeruli; however, treatment with 5 mg/kg had no effect on IL-10 expression (Figure 4 A). Treatment with ITF2357 at 5mg/kg resulted in increased TGF-β expression in the glomeruli, however, at the 10 mg/kg dose there was no significant difference in TGF-β expression in NZB/W mice (Figure 4 B). Glomerular IL-6 mRNA expression was significantly decreased in a dose-dependent manner following treatment with ITF2357 (Figure 4 C).
Figure 4. Glomerular mRNA levels were assessed in NZB/W mice.
(A) One kidney was removed from each NZW and NZB/W mouse and pooled by group. A glomerular isolation was performed and mRNA levels were quantified using RT-PCR. IL-10 was decreased in the glomeruli of NZB/W mice injected with ITF2357 (10 mg/kg) compared to those receiving the vehicle control or ITF2357 (5 mg/kg). (B) mRNA levels of TGF-β were increased in NZB/W mice treated with ITF2357 (5mg/kg), but there was no significant difference in NZB/W mice treated with ITF2357 (10mg/kg) when compared to DMSO treated NZB/W mice. (C) Treatment with ITF2357 significantly decreased glomerular IL-6 in a dose-dependent manner (n ≥ 5; **p < 0.005, ***p < 0.0005, ****p < 0.0005).
3.5. Increased differentiation into cytotoxic T cells following HDACi treatment
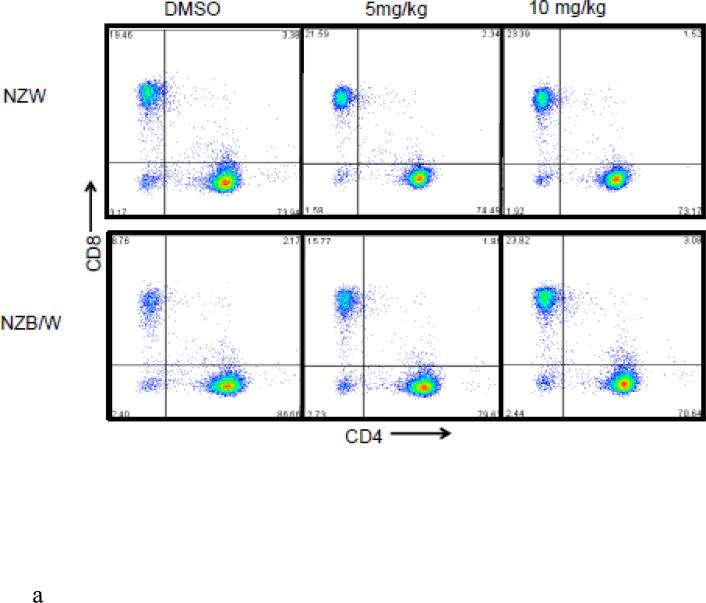
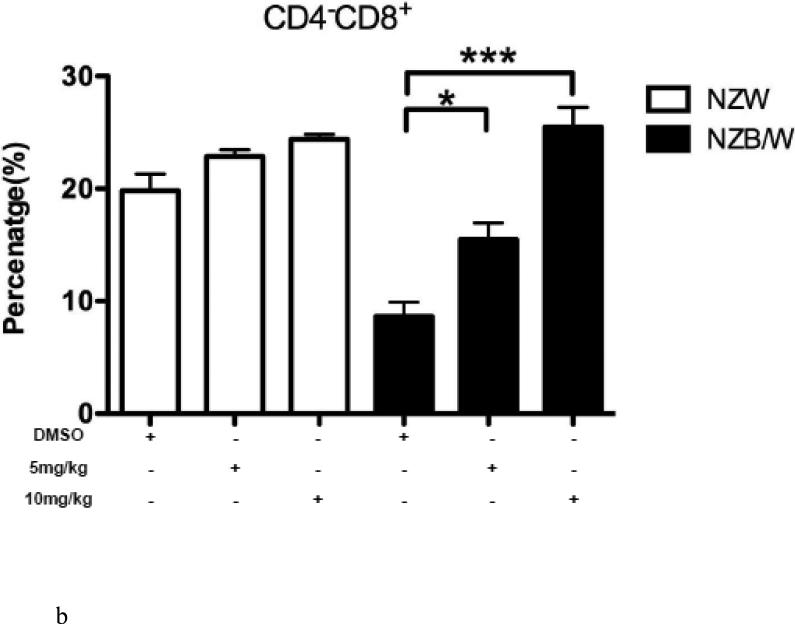
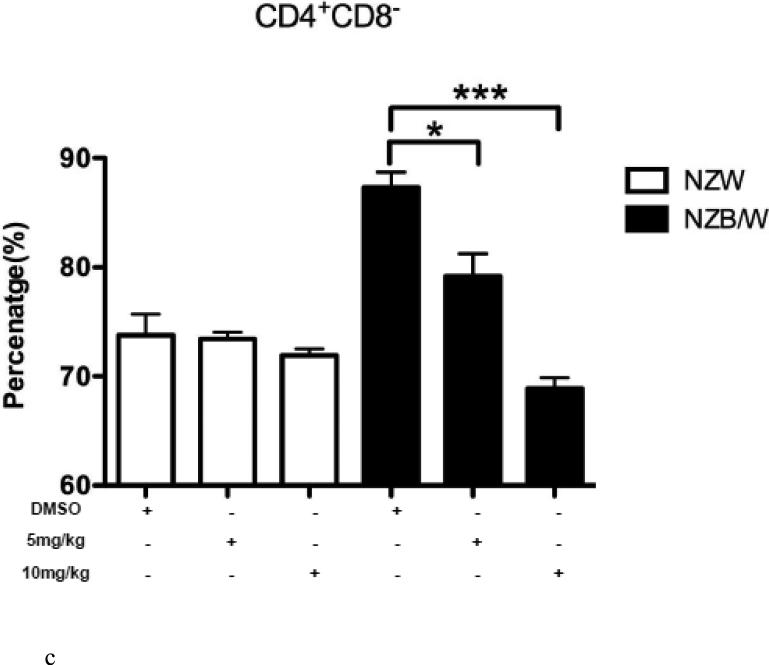
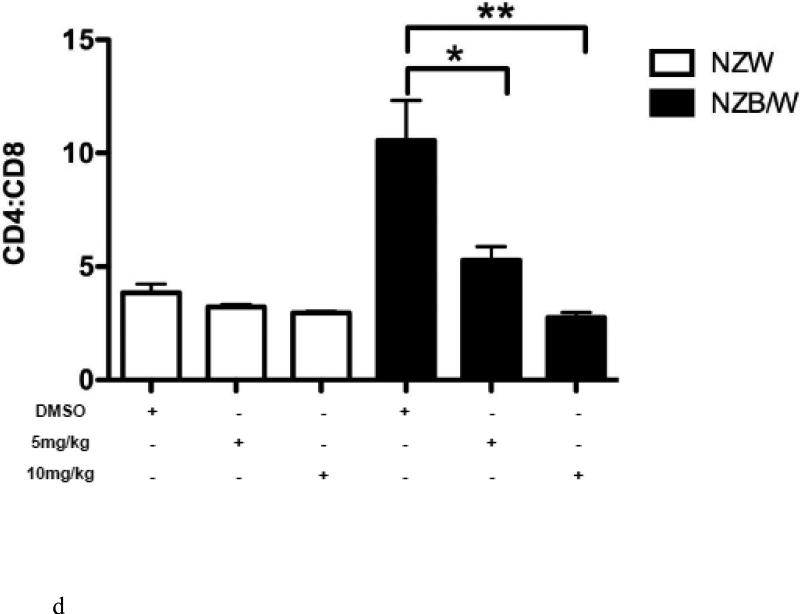
In order to further characterize the T cell splenic phenotype, levels of CD4+ and CD8+ were assessed. HDAC inhibition by ITF2357 significantly decreased the ratio of CD4:CD8 cells in NZB/W mice by increasing the cytotoxic T cell subset while decreasing the number of Th cells (Figure 5 A-D). NZW mice had a higher percentage of CD4−CD8+ T cells compared to NZB/W mice. Treatment with ITF2357 significantly increased the percentage of cytotoxic T cells at both the 5 mg/kg and 10 mg/kg dose (Figure 5 A-B). The percentage of Th cells was higher in NZB/W mice compared to NZW mice. Specific class I and II HDAC inhibition resulted in a dose-dependent decrease in Th cells in NZB/W treated mice (Figure 5 A, C). The treatment had no effect on the T cell profile of NZW mice receiving the same treatment (Figure 5A – D).
Figure 5. ITF2357 altered helper and cytotoxic T cell profiles.
(A) Representative images of flow cytometry T cell profiles. (B) The percentage of cytotoxic (CD4−CD8+) T cells increased with histone acetylation. (C) HDACi treatment decreased the percentage of Th (CD4+CD8−) cells. (D) The ratio of CD4:CD8 T cells decreased significantly in NZB/W mice treated with ITF2357 for 16 weeks (n ≥ 5; *p < 0.05, **p < 0.005 ***p<0.0005).
3.6. Inhibition of HDAC increased the number of regulatory T cells
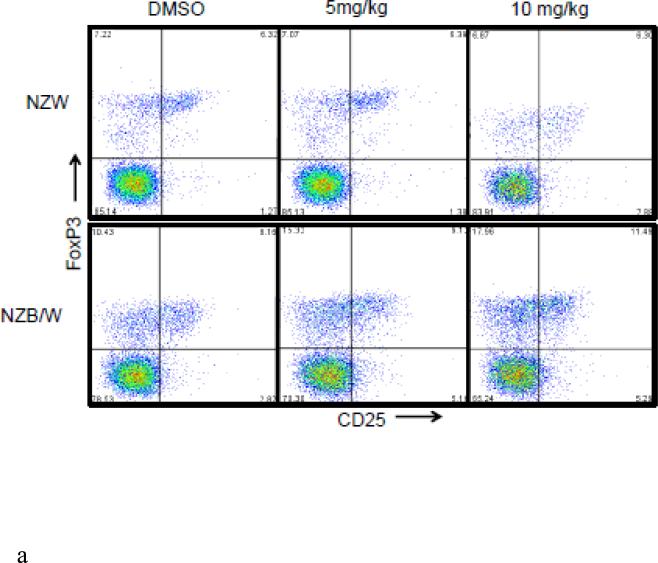
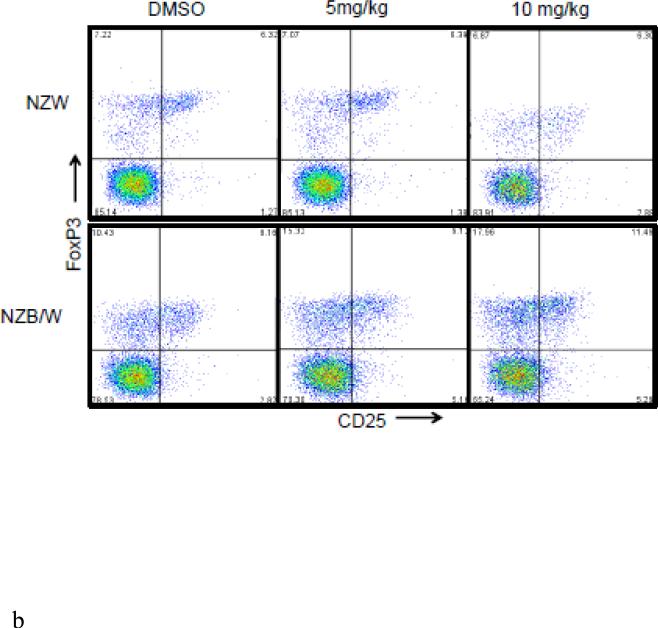
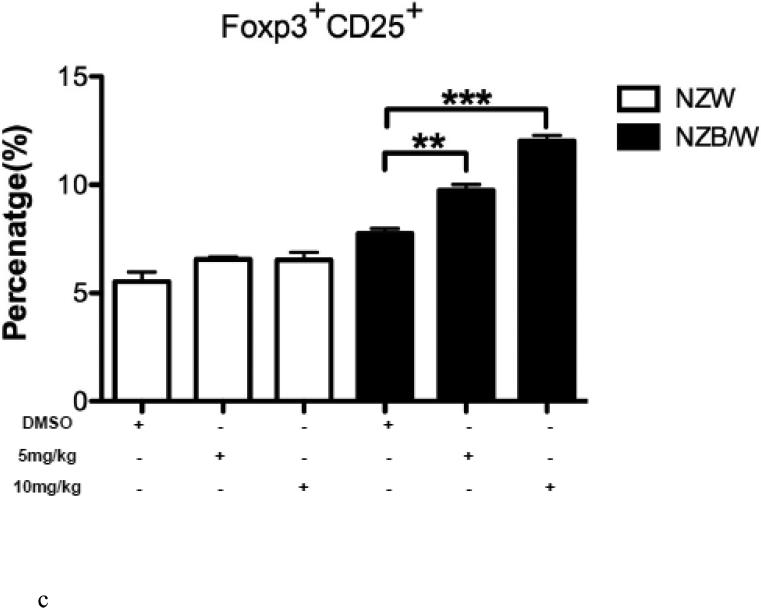
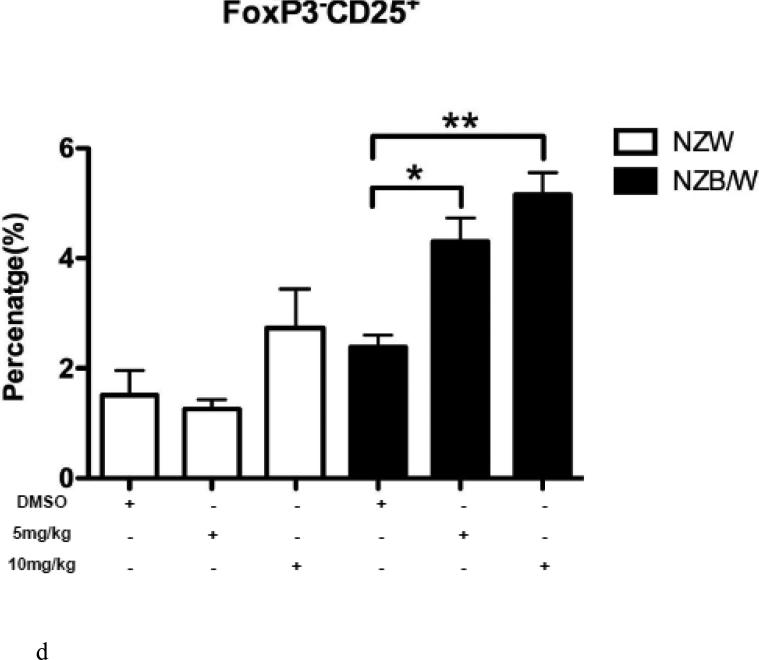
The Treg phenotype was assessed due to its role in the maintenance of self-tolerance and the prevention of autoimmune disease [31]. Following euthanization at 38 weeks-of-age, spleens were removed and single cell suspensions were obtained. Cells were stained for flow cytometric analyses. The percentage of CD4+CD25+Foxp3+ T cells (Tregs) was significantly increased in NZB/W mice that had received 10 mg/kg ITF2357 compared to DMSO-treated controls (Figure 6 A-B). NZW mice had no significant change in Treg profiles regardless of treatment (Figure 6 A-D). Treatment with ITF2357 treatment with both the 5 mg/kg and 10 mg/kg resulted in increased percentages of CD4+CD25+Foxp3− and of CD4+CD25−Foxp3+ T cells compared to mice treated with the vehicle control alone (Figure 6 A, C – D). Furthermore, treatment with the HDACi significantly increased the percentage of Foxp3−CD25+ cells in a dose-dependent manner in NZB/W mice. However, HDAC inhibition had no effect on the percentage of Foxp3−CD25+ T cells in NZW mice.
Figure 6. The Treg cell profile was increased following class I and II HDAC inhibition.
(A) Representative images of flow cytometry Treg profiles. (B) ITF2357 (10 mg/kg) treatment significantly increased the percentage of CD4+CD25+Foxp3+ T cells. (C) Percentage of T cells gated on CD4 that were Foxp3+CD25− in NZW and NZB/W mice treated with ITF2357(5 mg/kg in DMSO), (10 mg/kg in DMSO) or vehicle control (DMSO) for 16 weeks. (D) The percentage of CD25+ T cells is significantly increased following ITF2357 treatment in 38 week old mice (n ≥ 5; *p < 0.05, **p < 0.005).
3.7. Histone acetylation inhibits TH17 differentiation
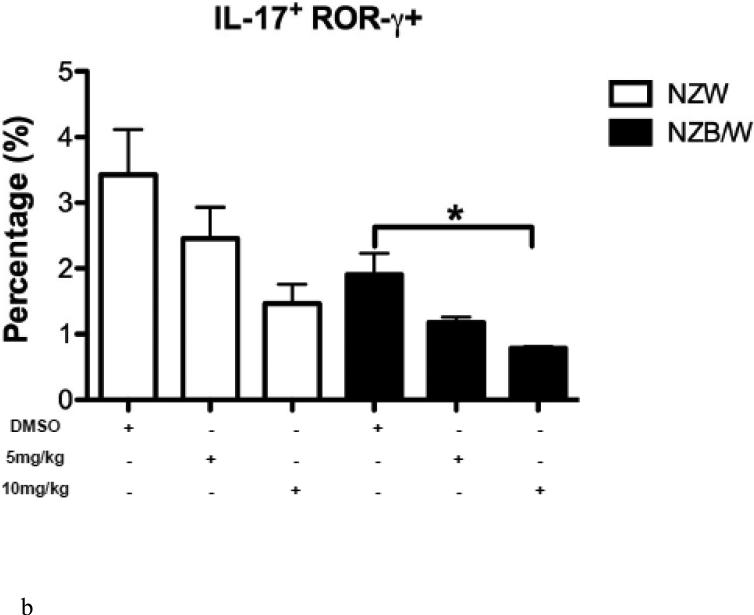
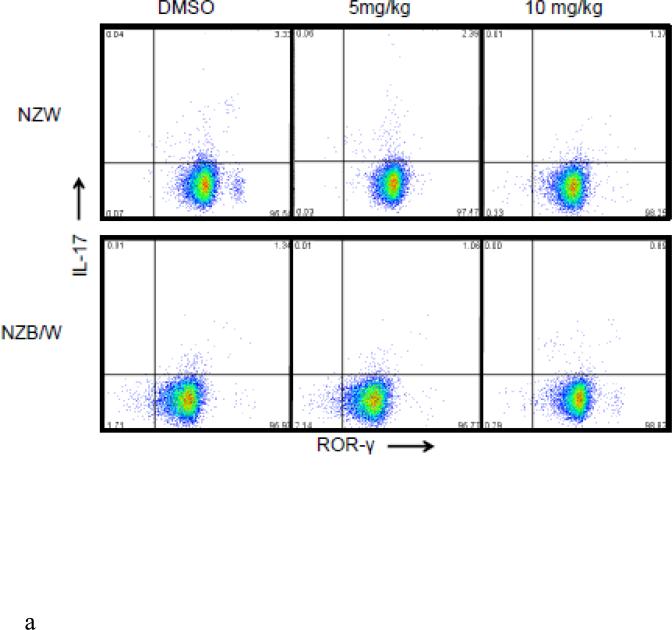
An imbalance between the Treg and Th17 subsets exists throughout the progression of SLE. The Th17 phenotype was assessed in spleens from 38-week-old NZW and NZB/W mice treated with DMSO or 5 mg/kg or 10 mg/kg ITF2357 for 16 weeks. NZB/W mice had decreased levels of CD4+IL-17+ROR-γ+ T cells compared to NZW mice. The percentage of IL-17 producing T cells, measured by flow cytometric analyses, was further reduced in NZB/W mice that were treated with 10mg/kg ITF2357. Treatment with ITF2357 also reduced the percentage of Th17 cell is NZW mice in a dose-dependent manner (Figure 7 A – B).
Figure 7. ITF2357 decreased the percentage of Th17 cells.
(A) Representative images of flow cytometry Th17 profiles. (B) The percentage of IL-17-producing T cells decreased in mice treated with the HDACi (n ≥ 3; *p < 0.05).
3.8. ITF2357 alters renal histopathology and decreases glomerular immune complex deposition
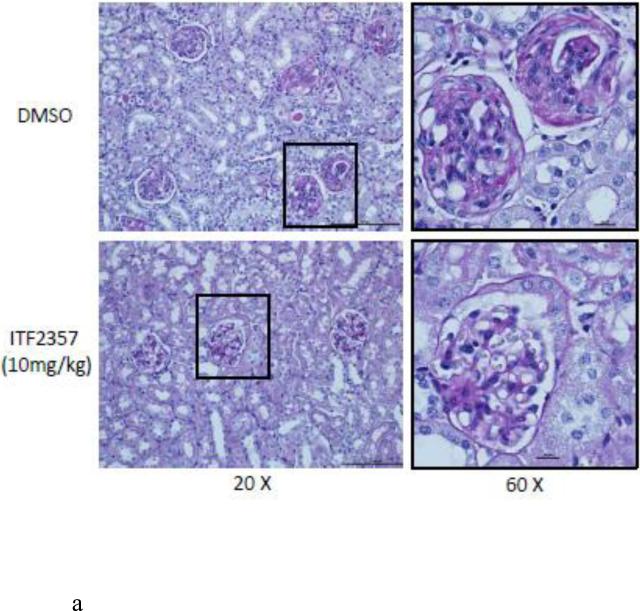
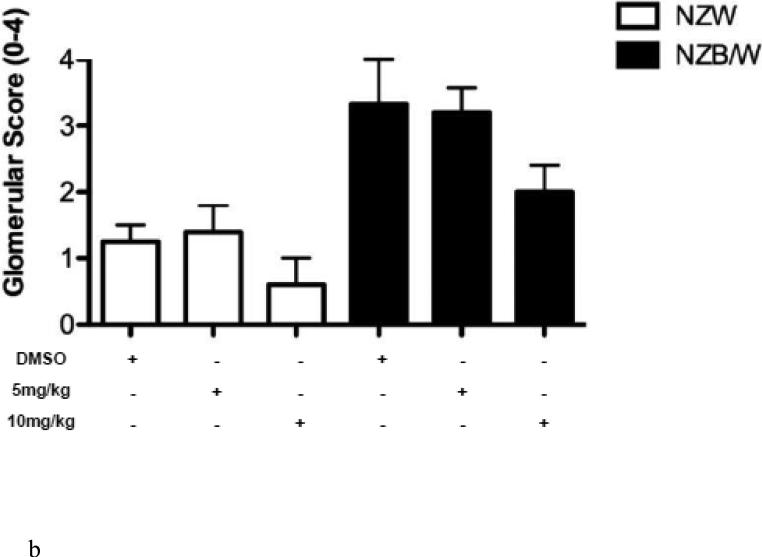
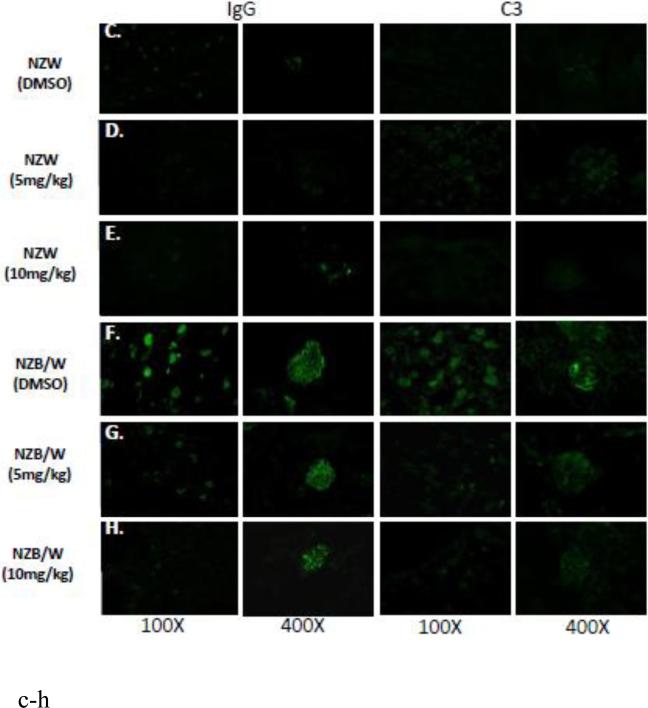
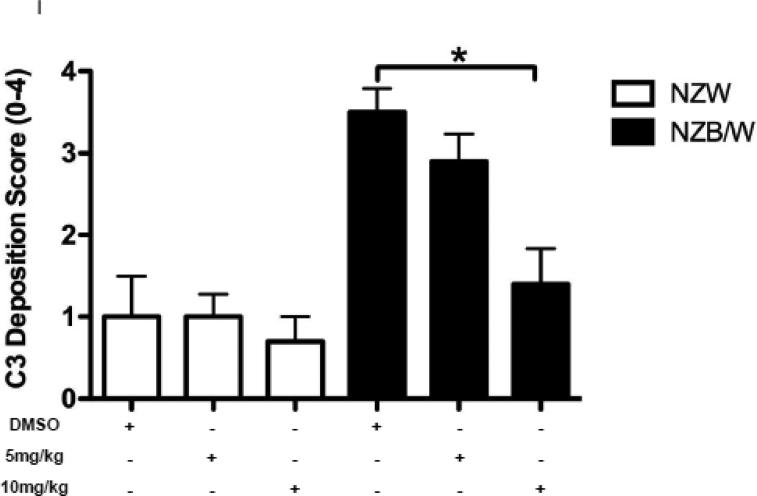
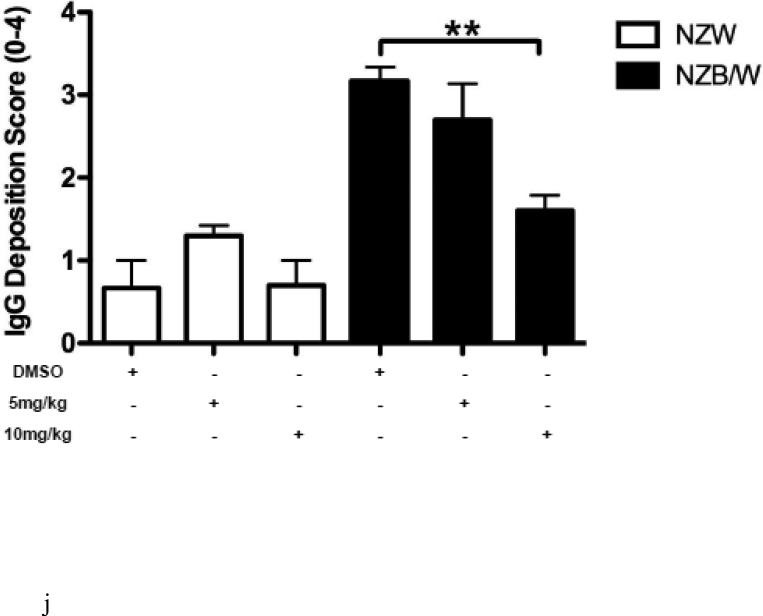
In order to assess renal disease, kidney sections were embedded in paraffin and stained by PAS. Light microscopy analysis of the kidney sections showed an increase in glomerulonephritis development in NZB/W mice compared to non-diseased NZW mice. DMSO-treated NZB/W mice had an average glomerular score of 3+ with severe glomerulonephritis. ITF2357 (10 mg/kg) treatment reduced the overall severity of disease by decreasing hypercellularity, crescent formations, and thickening/irregularity of the glomerular basement membrane (Figure 8 A, B). Immune complex and complement deposition within the glomeruli were assessed by immunofluorescent analysis of kidney sections. NZW mice had minimal immune complex deposition regardless of treatment (Figure 8 C-E). Both the number of glomeruli with C3 and IgG deposition as wells as the overall level of deposition within each glomeruli was increased in the NZB/W DMSO-treated mice when compared to NZW controls (Figure 8 F). Following treatment with the HDACi, NZB/W mice had decreased immune complex and complement deposition in the glomeruli (Figure 8 H-J). Taken together these results show that ITF2357 (10 mg/kg) decrease glomerular immune deposits in NZB/W mice.
Figure 8. Kidney histopathology and immune complex deposition were assessed.
(A,B) Paraffin embedded kidney sections were cut and stained with PAS stain. Sections were assessed for glomerular proliferation, inflammation, number of nuclei per glomerulus, crescent formation, and fibrosis by a blinded pathologist, and a glomerular score (0-4) was assigned. DMSO-treated NZB/W mice had severe proliferative glomerulonephritis, thickened GBM, and crescent formations. When treated with ITF2357 (10mg/kg) NZB/W mice had improved renal pathology (A,B). 5 μM kidney sections were stained with FITC-conjugated C3 or IgG and assessed for fluorescence intensity. Glomerular deposition of both C3 and IgG was greater in NZB/W (vehicle control) mice compared to NZW mice. ITF2357 treatment was able to decrease immune complex deposition. (n ≥ 5; *p < 0.05 ).
3.9. Histone acetylation is increased in the kidneys following ITF2357treatment
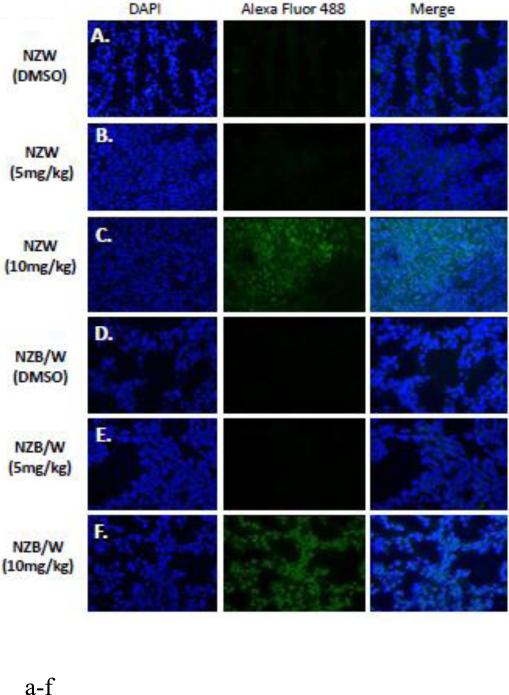
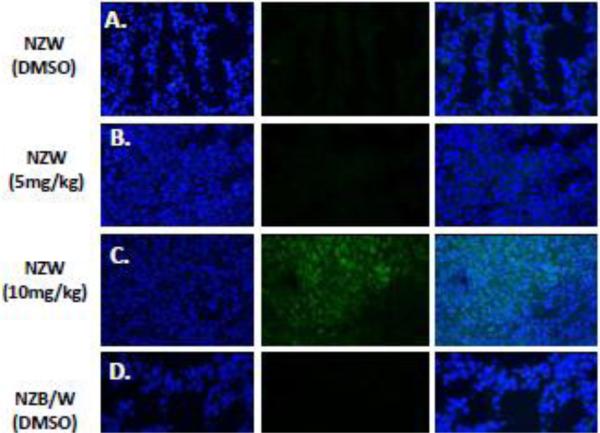
Acetylation of the H3 (Lys9) histone is involved with the regulation of nucleosome packaging and structure and is particularly susceptible to post-translational modification. Kidney sections were stained with an Ab for the acetylated H3 histone (FITC) and a nuclear (DAPI) stain and immunofluorescence was assessed. ITF2357 treatment at10 mg/kg increased histone H3 acetylation in both NZW and NZB/W mice (Figure 9). However, treatment at 5 mg/kg ITF2357 was unable to alter H3 histone acetylation (Figure 9 E).
Figure 9. ITF2357 increases histone H3 acetylation in the kidney.
(A) Five μM kidney sections from 38-week-old NZW and NZB/W mice treated with DMSO or ITF2357 (5mg/kg or 10mg/kg) were stained for acetyl-histone H3 (lys9). Treatment with ITF2357 (10mg/kg) increased the percentage of FITC (green) stained acetylated H3 histones colocalized with nuclear DAPI (blue) stain in both NZW and NZB/W mice (n ≥ 5).
3.10. In vitro treatment with ITF2357 increased Foxp3 acetylation
Foxp3 acetylation was assessed through immunoprecipitation and Western blot analysis of splenic T cells. A Treg cell phenotype was induced using IL-2, TGF-β and CD3/CD28 co-stimulation. Cells were treated with increasing concentrations of ITF2357 and levels of Foxp3 acetylation were determined by immunoprecipitation and Western blot analysis. Splenic CD4+ T cells were immunoprecipitated with Foxp3 as a control. Induced Tregs were immunoprecipitated with IgG as an isotype control. Treatment with the selective Class I and II HDACi was able to increase acetylation of Foxp3 in vitro in a concentration-dependent manner. At a 5 μM concentration the increase in Foxp3 acetylation was significantly increased compared to non-treated controls (Figure 10).
Figure 10. Acetylation of Foxp3 histones.
A single-cell suspension was isolated from the spleens of 22-week-old NZB/W mice. Cells were differentiated into Tregs and treated with increasing concentrations of ITF2357 (0.25, 5, and 1 μM). Non-induced splenic cells that did not receive the Treg cocktail (anti-CD3, anti-CD28, rhIL-2, and TGF-β) were used as a control. Foxp3 or IgG, as a control, were immunoprecipitated and Western blot analysis was used to determine levels of Foxp3 acetylation. Treatment with ITF2357 increased the acetylation of Foxp3 in Treg cells. Experiments were run in triplicate.
4. Discussion
Various HDAC inhibitors have been shown to have therapeutic potential in animal models of multiple autoimmune diseases, including SLE, arthritis, inflammatory bowel disease, and diabetes [41, 42, 47-50]. However, the mechanism through which HDAC inhibitors ameliorate autoimmune disease remains to be elucidated. We sought to determine if ITF2357 would decrease disease in NZB/W mice. NZB/W and NZW mice were treated for 16 weeks beginning at 22 weeks-of-age. Key urinary and sera markers of SLE including proteinuria (Figure 1B) and anti-dsDNA (Figure 2A) were decreased in lupus-prone NZB/W mice treated with ITF2357 throughout the study. Histone acetylation was confirmed through immunofluorescence in the kidney (Figure 9 A-F). DMSO-treated NZB/W mice had a marked increase in immune complex deposition and proliferative glomerulonephritis compared to NZW control mice, which was ameliorated following specific class I and II HDACi therapy (Figure 8). Flow cytometric analysis of splenic T cells showed increased Treg cell numbers (Figure 6), but a decreased Th17 phenotype (Figure 7).
Our results showed that treatment with ITF2357 resulted in increased Foxp3 acetylation in a dose-dependent manner. Recent studies suggest that HDAC inhibitors play a role in the acetylation of non-histone proteins to regulate protein stability, protein-protein interactions, and protein-DNA interactions [33]. Hyperacetylation by HDAC inhibition may prevent ubiquitination and proteasomal degradation, affecting protein stability [51]. One non-histone protein that has been shown to be regulated by HDACs is Foxp3 [35]. Increased Foxp3 acetylation has been demonstrated to prevent polyubiquitination and subsequent proteasomal degradation increasing the stability of the Foxp3 protein and thereby allowing for increased Treg differentiation [35]. Increasing the stability of Foxp3 is important for regulating Treg suppressive function as well as Treg development [52]. In our study, splenic cells treated with ITF2357 had increased Foxp3 acetylation at the 1 μM concentration (Figure 10). It has been hypothesized that as Foxp3 becomes acetylated, the interaction between transcription factors and the Foxp3 promoter is increased, thereby increasing Foxp3 expression and Treg cell populations [51].
In the present studies, the Treg (CD4+CD25+Foxp3+) phenotype was increased in NZB/W mice treated with ITF2357, a specific class I and II HDACi, compared to DMSO-treated control mice (Figure 7). Stable expression of Foxp3 is necessary for Treg suppression of Th cells and the regulation of autoimmune disease. Research suggests that Tregs may be able to downregulate glomerulonephritis [53, 54]. Our results indicate that the increase in the Treg cell population coincided with decreased glomerulonephritis. In NZB/W mice depleted of CD4+CD25+ T cells, glomerulonephritis develops in an accelerated manner suggesting that Treg cells are critical for suppression of inflammation in the kidneys [26].
Our study showed that treatment with ITF2357 was able to increase H3 histone acetylation in both NZW and NZB/W mice (Figure 10). Histones can be epigenetically regulated through acetylation or methylation of lysine residues. Acetylation of Lys 9 of the H3 histone has been implicated for its role in transcriptional activation [29]. Previous research has shown that an increase in acetylation of the H3 histone (lys9) correlated with a marked increase in Foxp3 expression [51, 55]. ITF2357 was able to regulate site-specific acetylation of Lys9 in the kidney tissue. We also found that treatment increased the percentage of Foxp3+ Treg cells in vivo. These data suggests that by inhibiting class I and II HDACs we were able to increase H3 histone acetylation, further aiding Foxp3 expression.
TGF-β promotes expression of Foxp3, a transcription factor for Treg cells [18, 56]. Our studies showed a decrease in TGF-β in the sera of NZB/W mice receiving vehicle alone (Figure 4B). TGF-β has been demonstrated to play a dual role in SLE pathogenesis [57]. Reduced levels of TGF-β in immune cells can coincide with an increase in TGF-β in target organs leading to autoimmune disease such as lupus [57]. Reduced TGF-β production by immune cells predisposes to autoantibody production, a hallmark of SLE, associated with complement activation, inflammatory cytokine production, and subsequent tissue inflammation and deposition of extracellular matrix [57-59]. Anti-inflammatory cytokines including TGF-β are produced in order to combat inflammation within target organs such as the kidneys inducing the production of extracellular matrix leading to fibrosis [60, 61]. Treatment of NZB/W mice with ITF2357 (10 mg/kg) was able to reverse this effect resulting in an increase in TGF-β in the sera. Furthermore, increased levels of TGF-β in the sera helps naïve CD4+ T cells differentiate into Treg cells which help to regulate autoimmune disease [56].
Anti-dsDNA is produced by autoreactive B cells that are characteristic of patients with SLE. These autoreactive B cells are able to overproduce anti-dsDNA in part due to activation by CD4+ Th cells [5]. Our studies show that NZB/W mice had increased numbers of CD4+ Th cells (Figure 6 C), which correlated with elevated anti-dsDNA sera levels (Figure 2A). However, treatment of NZB/W mice with ITF2357 (10 mg/kg) was able to reduce the percentage of CD4+ T cells as wells as decrease autoantibody production. There was also a marked decrease in the ratio of CD4+CD8+ cells in NZB/W mice treated with ITF2357 (10 mg/kg) when compared to DMSO-treated control mice (Figure 6 D). CD4+ T cells have increased activation in patients with SLE [61]. Conversely, CD8+ T cells are reduced in number and function resulting in lack of inhibition of autoreactive B cells [13, 62]. Our data suggests that increasing the number of cytotoxic T cells contributes to the decrease in autoantibody production by autoreactive B cells. Splenomegaly, or enlargement of the spleen, is suspected to result from a number of different factors during SLE including increased lymphocyte proliferation and autoantibody stimulation [63]. Reduced spleen: body weight ratio may be due to reduction in the number of lymphocytes following HDAC inhibition.
5. Conclusion
HDACi are able to provide a more targeted approach to treatment through inhibition of specific classes of HDACs and have been studied for efficacy in a number of autoimmune diseases [49, 64, 65]. Previous research has demonstrated the ability of HDACi including TSA and SAHA to decrease SLE pathogenesis in NZB/W mice [16, 47]. Our studies have shown the ability of ITF2357 to decrease sera and urinary markers of lupus, increase Treg numbers, while improving renal histopathology. We hypothesize that an increase in Treg cell number and function may reduce autoantibody production resulting in decreased disease activity during SLE. Taken together these data suggest class I and II histone deacetylation plays an important role in the development of lupus and that treatment to inhibit deacetylation can ameliorate SLE disease.
Lupus-prone NZB/W mice were treated with a class I/II HDACi (ITF2357)
ITF2357 treatment decreases anti-nuclear antibodies and immune complex deposition
ITF2357 treatment increases the Treg phenotype and Foxp3 acetylation
HDAC inhibition decreases SLE in NZB/W mice by altering the T cell phenotype
Acknowledgments
Grant Support: NIH/NIAID 5R03A1085467
Footnotes
Publisher's Disclaimer: This is a PDF file of an unedited manuscript that has been accepted for publication. As a service to our customers we are providing this early version of the manuscript. The manuscript will undergo copyediting, typesetting, and review of the resulting proof before it is published in its final citable form. Please note that during the production process errors may be discovered which could affect the content, and all legal disclaimers that apply to the journal pertain.
References
- 1.Aran AA, Putterman C. Treatment of lupus nephritis: facing the era of immunotherapy. Panminerva Med. 2008;50:235–245. [PubMed] [Google Scholar]
- 2.Mok CC, Lau CS. Pathogenesis of systemic lupus erythematosus. Journal of clinical pathology. 2003;56:481–490. doi: 10.1136/jcp.56.7.481. [DOI] [PMC free article] [PubMed] [Google Scholar]
- 3.Kuhn A, Beissert S, Krammer PH. CD4(+)CD25 (+) regulatory T cells in human lupus erythematosus. Archives of dermatological research. 2009;301:71–81. doi: 10.1007/s00403-008-0891-9. [DOI] [PubMed] [Google Scholar]
- 4.Crispin JC, Liossis SN, Kis-Toth K, Lieberman LA, Kyttaris VC, Juang YT, Tsokos GC. Pathogenesis of human systemic lupus erythematosus: recent advances. Trends in molecular medicine. 2010;16:47–57. doi: 10.1016/j.molmed.2009.12.005. [DOI] [PMC free article] [PubMed] [Google Scholar]
- 5.Lee JH, Wang LC, Lin YT, Yang YH, Lin DT, Chiang BL. Inverse correlation between CD4+ regulatory T-cell population and autoantibody levels in paediatric patients with systemic lupus erythematosus. Immunology. 2006;117:280–286. doi: 10.1111/j.1365-2567.2005.02306.x. [DOI] [PMC free article] [PubMed] [Google Scholar]
- 6.Ryan MJ, McLemore GR., Jr. Hypertension and impaired vascular function in a female mouse model of systemic lupus erythematosus. Am J Physiol Regul Integr Comp Physiol. 2007;292:R736–742. doi: 10.1152/ajpregu.00168.2006. [DOI] [PubMed] [Google Scholar]
- 7.Perry D, Sang A, Yin Y, Zheng YY, Morel L. Murine models of systemic lupus erythematosus. Journal of biomedicine & biotechnology. 2011;2011:271694. doi: 10.1155/2011/271694. [DOI] [PMC free article] [PubMed] [Google Scholar]
- 8.Benoist C, Mathis D, Satpathy A, Feuerer M. MPD:25804. Mouse Phenome Database web site. The Jackson Laboratory; 2013. Survey of regulatory T cells (Treg) of the thymus and spleen in males of 33 inbred strains of mice. [Google Scholar]
- 9.Burnett R, Ravel G, Descotes J. Clinical and histopathological progression of lesions in lupus-prone (NZB × NZW) F1 mice. Experimental and toxicologic pathology : official journal of the Gesellschaft fur Toxikologische Pathologie. 2004;56:37–44. doi: 10.1016/j.etp.2004.04.010. [DOI] [PubMed] [Google Scholar]
- 10.Peutz-Kootstra CJ, de Heer E, Hoedemaeker PJ, Abrass CK, Bruijn JA. Lupus nephritis: lessons from experimental animal models. The Journal of laboratory and clinical medicine. 2001;137:244–260. doi: 10.1067/mlc.2001.113755. [DOI] [PubMed] [Google Scholar]
- 11.Theofilopoulos AN, Dixon FJ. Murine models of systemic lupus erythematosus. Advances in Immunology. 1985;37:269–390. doi: 10.1016/s0065-2776(08)60342-9. [DOI] [PubMed] [Google Scholar]
- 12.Klinman DM. IgG1 and IgG2a production by autoimmune B cells treated in vitro with IL-4 and IFN-gamma. Journal of immunology. 1990;144:2529–2534. [PubMed] [Google Scholar]
- 13.Puliaeva I, Puliaev R, Via CS. Therapeutic potential of CD8+ cytotoxic T lymphocytes in SLE. Autoimmunity reviews. 2009;8:219–223. doi: 10.1016/j.autrev.2008.07.045. [DOI] [PMC free article] [PubMed] [Google Scholar]
- 14.Crispin JC, Kyttaris VC, Terhorst C, Tsokos GC. T cells as therapeutic targets in SLE, Nature reviews. Rheumatology. 2010;6:317–325. doi: 10.1038/nrrheum.2010.60. [DOI] [PMC free article] [PubMed] [Google Scholar]
- 15.Zhu J, Yamane H, Paul WE. Differentiation of effector CD4 T cell populations (*) Annual review of immunology. 2010;28:445–489. doi: 10.1146/annurev-immunol-030409-101212. [DOI] [PMC free article] [PubMed] [Google Scholar]
- 16.Mishra N, Reilly CM, Brown DR, Ruiz P, Gilkeson GS. Histone deacetylase inhibitors modulate renal disease in the MRL-lpr/lpr mouse. Journal of Clinical Investigation. 2003;111:539–552. doi: 10.1172/JCI16153. [DOI] [PMC free article] [PubMed] [Google Scholar]
- 17.Sabry A, Sheashaa H, El-Husseini A, Mahmoud K, Eldahshan KF, George SK, Abdel-Khalek E, El-Shafey EM, Abo-Zenah H. Proinflammatory cytokines (TNF-alpha and IL-6) in Egyptian patients with SLE: its correlation with disease activity. Cytokine. 2006;35:148–153. doi: 10.1016/j.cyto.2006.07.023. [DOI] [PubMed] [Google Scholar]
- 18.Apostolidis SA, Lieberman LA, Kis-Toth K, Crispin JC, Tsokos GC. The dysregulation of cytokine networks in systemic lupus erythematosus. Journal of interferon & cytokine research : the official journal of the International Society for Interferon and Cytokine Research. 2011;31:769–779. doi: 10.1089/jir.2011.0029. [DOI] [PMC free article] [PubMed] [Google Scholar]
- 19.Miyake K, Akahoshi M, Nakashima H. Th subset balance in lupus nephritis. Journal of biomedicine & biotechnology. 2011;2011:980286. doi: 10.1155/2011/980286. [DOI] [PMC free article] [PubMed] [Google Scholar]
- 20.Alunno A, Bartoloni E, Bistoni O, Nocentini G, Ronchetti S, Caterbi S, Valentini V, Riccardi C, Gerli R. Balance between regulatory T and Th17 cells in systemic lupus erythematosus: the old and the new. Clinical & developmental immunology. 2012;2012:823085. doi: 10.1155/2012/823085. [DOI] [PMC free article] [PubMed] [Google Scholar]
- 21.Joshi S, Pantalena LC, Liu XK, Gaffen SL, Liu H, Rohowsky-Kochan C, Ichiyama K, Yoshimura A, Steinman L, Christakos S, Youssef S. 1,25-dihydroxyvitamin D(3) ameliorates Th17 autoimmunity via transcriptional modulation of interleukin-17A. Molecular and cellular biology. 2011;31:3653–3669. doi: 10.1128/MCB.05020-11. [DOI] [PMC free article] [PubMed] [Google Scholar]
- 22.Apostolidis SA, Crispin JC, Tsokos GC. IL-17-producing T cells in lupus nephritis. Lupus. 2011;20:120–124. doi: 10.1177/0961203310389100. [DOI] [PubMed] [Google Scholar]
- 23.Liu MF, Lin LH, Weng CT, Weng MY. Decreased CD4+CD25+bright T cells in peripheral blood of patients with primary Sjogren's syndrome. Lupus. 2008;17:34–39. doi: 10.1177/0961203307085248. [DOI] [PubMed] [Google Scholar]
- 24.Wahl SM, Chen W. Transforming growth factor-beta-induced regulatory T cells referee inflammatory and autoimmune diseases. Arthritis research & therapy. 2005;7:62–68. doi: 10.1186/ar1504. [DOI] [PMC free article] [PubMed] [Google Scholar]
- 25.Wenzel J, Henze S, Brahler S, Bieber T, Tuting T. The expression of human leukocyte antigen-DR and CD25 on circulating T cells in cutaneous lupus erythematosus and correlation with disease activity. Experimental dermatology. 2005;14:454–459. doi: 10.1111/j.0906-6705.2005.00301.x. [DOI] [PubMed] [Google Scholar]
- 26.Hayashi T, Hasegawa K, Adachi C. Elimination of CD4(+)CD25(+) T cell accelerates the development of glomerulonephritis during the preactive phase in autoimmune-prone female NZB × NZW F mice. International journal of experimental pathology. 2005;86:289–296. doi: 10.1111/j.0959-9673.2005.00438.x. [DOI] [PMC free article] [PubMed] [Google Scholar]
- 27.Akimova T, Ge G, Golovina T, Mikheeva T, Wang L, Riley JL, Hancock WW. Histone/protein deacetylase inhibitors increase suppressive functions of human FOXP3+ Tregs. Clinical immunology. 2010;136:348–363. doi: 10.1016/j.clim.2010.04.018. [DOI] [PMC free article] [PubMed] [Google Scholar]
- 28.Beier UH, Akimova T, Liu Y, Wang L, Hancock WW. Histone/protein deacetylases control Foxp3 expression and the heat shock response of T-regulatory cells. Current opinion in immunology. 2011;23:670–678. doi: 10.1016/j.coi.2011.07.002. [DOI] [PMC free article] [PubMed] [Google Scholar]
- 29.Yan K, Cao Q, Reilly CM, Young NL, Garcia BA, Mishra N. Histone deacetylase 9 deficiency protects against effector T cell-mediated systemic autoimmunity. The Journal of biological chemistry. 2011;286:28833–28843. doi: 10.1074/jbc.M111.233932. [DOI] [PMC free article] [PubMed] [Google Scholar]
- 30.He H, Lehming N. Global effects of histone modifications. Brief Funct Genomic Proteomic. 2003;2:234–243. doi: 10.1093/bfgp/2.3.234. [DOI] [PubMed] [Google Scholar]
- 31.Koarada S, Tada Y, Ushiyama O, Morito F, Suzuki N, Ohta A, Miyake K, Kimoto M, Nagasawa K. B cells lacking RP105, a novel B cell antigen, in systemic lupus erythematosus. Arthritis & Rheumatism. 1999;42:2593–2600. doi: 10.1002/1529-0131(199912)42:12<2593::AID-ANR12>3.0.CO;2-G. [DOI] [PubMed] [Google Scholar]
- 32.Reilly CM, Regna N, Mishra N. HDAC inhibition in lupus models. Molecular medicine. 2011;17:417–425. doi: 10.2119/molmed.2011.00055. [DOI] [PMC free article] [PubMed] [Google Scholar]
- 33.Kim HJ, Bae SC. Histone deacetylase inhibitors: molecular mechanisms of action and clinical trials as anti-cancer drugs. American journal of translational research. 2011;3:166–179. [PMC free article] [PubMed] [Google Scholar]
- 34.Minucci S, Pelicci PG. Histone deacetylase inhibitors and the promise of epigenetic (and more) treatments for cancer, Nature reviews. Cancer. 2006;6:38–51. doi: 10.1038/nrc1779. [DOI] [PubMed] [Google Scholar]
- 35.van Loosdregt J, Vercoulen Y, Guichelaar T, Gent YY, Beekman JM, van Beekum O, Brenkman AB, Hijnen DJ, Mutis T, Kalkhoven E, Prakken BJ, Coffer PJ. Regulation of Treg functionality by acetylation-mediated Foxp3 protein stabilization. Blood. 2010;115:965–974. doi: 10.1182/blood-2009-02-207118. [DOI] [PubMed] [Google Scholar]
- 36.Lewis EC, Blaabjerg L, Storling J, Ronn SG, Mascagni P, Dinarello CA, Mandrup-Poulsen T. The oral histone deacetylase inhibitor ITF2357 reduces cytokines and protects islet beta cells in vivo and in vitro. Molecular medicine. 2011;17:369–377. doi: 10.2119/molmed.2010.00152. [DOI] [PMC free article] [PubMed] [Google Scholar]
- 37.Khan N, Jeffers M, Kumar S, Hackett C, Boldog F, Khramtsov N, Qian X, Mills E, Berghs SC, Carey N, Finn PW, Collins LS, Tumber A, Ritchie JW, Jensen PB, Lichenstein HS, Sehested M. Determination of the class and isoform selectivity of small-molecule histone deacetylase inhibitors. The Biochemical journal. 2008;409:581–589. doi: 10.1042/BJ20070779. [DOI] [PubMed] [Google Scholar]
- 38.Matalon S, Palmer BE, Nold MF, Furlan A, Kassu A, Fossati G, Mascagni P, Dinarello CA. The histone deacetylase inhibitor ITF2357 decreases surface CXCR4 and CCR5 expression on CD4(+) T-cells and monocytes and is superior to valproic acid for latent HIV-1 expression in vitro. Journal of acquired immune deficiency syndromes. 2010;54:1–9. doi: 10.1097/QAI.0b013e3181d3dca3. [DOI] [PMC free article] [PubMed] [Google Scholar]
- 39.Furlan A, Monzani V, Reznikov LL, Leoni F, Fossati G, Modena D, Mascagni P, Dinarello CA. Pharmacokinetics, safety and inducible cytokine responses during a phase 1 trial of the oral histone deacetylase inhibitor ITF2357 (givinostat) Molecular medicine. 2011;17:353–362. doi: 10.2119/molmed.2011.00020. [DOI] [PMC free article] [PubMed] [Google Scholar]
- 40.Bodar EJ, Simon A, van der Meer JW. Effects of the histone deacetylase inhibitor ITF2357 in autoinflammatory syndromes. Molecular medicine. 2011;17:363–368. doi: 10.2119/molmed.2011.00039. [DOI] [PMC free article] [PubMed] [Google Scholar]
- 41.Glauben R, Siegmund B. Inhibition of histone deacetylases in inflammatory bowel diseases. Molecular medicine. 2011;17:426–433. doi: 10.2119/molmed.2011.00069. [DOI] [PMC free article] [PubMed] [Google Scholar]
- 42.Grabiec AM, Korchynskyi O, Tak PP, Reedquist KA. Histone deacetylase inhibitors suppress rheumatoid arthritis fibroblast-like synoviocyte and macrophage IL-6 production by accelerating mRNA decay. Annals of the rheumatic diseases. 2012;71:424–431. doi: 10.1136/ard.2011.154211. [DOI] [PMC free article] [PubMed] [Google Scholar]
- 43.Leoni F, Fossati G, Lewis EC, Lee JK, Porro G, Pagani P, Modena D, Moras ML, Pozzi P, Reznikov LL, Siegmund B, Fantuzzi G, Dinarello CA, Mascagni P. The histone deacetylase inhibitor ITF2357 reduces production of pro-inflammatory cytokines in vitro and systemic inflammation in vivo. Molecular medicine. 2005;11:1–15. doi: 10.2119/2006-00005.Dinarello. [DOI] [PMC free article] [PubMed] [Google Scholar]
- 44.Tan J, Cang S, Ma Y, Petrillo RL, Liu D. Novel histone deacetylase inhibitors in clinical trials as anti-cancer agents. Journal of hematology & oncology. 2010;3:5. doi: 10.1186/1756-8722-3-5. [DOI] [PMC free article] [PubMed] [Google Scholar]
- 45.Vojinovic J, Damjanov N, D'Urzo C, Furlan A, Susic G, Pasic S, Iagaru N, Stefan M, Dinarello CA. Safety and efficacy of an oral histone deacetylase inhibitor in systemic-onset juvenile idiopathic arthritis. Arthritis and rheumatism. 2011;63:1452–1458. doi: 10.1002/art.30238. [DOI] [PubMed] [Google Scholar]
- 46.Hayashi T, Hasegawa K, Sasaki Y, Mori T, Adachi C, Maeda K. Systemic administration of interleukin-4 expressing plasmid DNA delays the development of glomerulonephritis and prolongs survival in lupus-prone female NZB × NZW F1 mice. Nephrology Dialysis Transplantation. 2007;22:3131–3138. doi: 10.1093/ndt/gfm465. [DOI] [PubMed] [Google Scholar]
- 47.Reilly CM, Thomas M, Gogal R, Jr., Olgun S, Santo A, Sodhi R, Samy ET, Peng SL, Gilkeson GS, Mishra N. The histone deacetylase inhibitor trichostatin A upregulates regulatory T cells and modulates autoimmunity in NZB/W F1 mice. Journal of autoimmunity. 2008;31:123–130. doi: 10.1016/j.jaut.2008.04.020. [DOI] [PubMed] [Google Scholar]
- 48.Nasu Y, Nishida K, Miyazawa S, Komiyama T, Kadota Y, Abe N, Yoshida A, Hirohata S, Ohtsuka A, Ozaki T. Trichostatin A, a histone deacetylase inhibitor, suppresses synovial inflammation and subsequent cartilage destruction in a collagen antibody-induced arthritis mouse model, Osteoarthritis and cartilage / OARS. Osteoarthritis Research Society. 2008;16:723–732. doi: 10.1016/j.joca.2007.10.014. [DOI] [PubMed] [Google Scholar]
- 49.Christensen DP, Dahllof M, Lundh M, Rasmussen DN, Nielsen MD, Billestrup N, Grunnet LG, Mandrup-Poulsen T. Histone deacetylase (HDAC) inhibition as a novel treatment for diabetes mellitus. Molecular medicine. 2011;17:378–390. doi: 10.2119/molmed.2011.00021. [DOI] [PMC free article] [PubMed] [Google Scholar]
- 50.Zhou X, Hua X, Ding X, Bian Y, Wang X. Trichostatin differentially regulates Th1 and Th2 responses and alleviates rheumatoid arthritis in mice. Journal of clinical immunology. 2011;31:395–405. doi: 10.1007/s10875-011-9508-8. [DOI] [PubMed] [Google Scholar]
- 51.Zhang H, Xiao Y, Zhu Z, Li B, Greene MI. Immune regulation by histone deacetylases: a focus on the alteration of FOXP3 activity. Immunology and cell biology. 2012;90:95–100. doi: 10.1038/icb.2011.101. [DOI] [PMC free article] [PubMed] [Google Scholar]
- 52.Hori S, Nomura T, Sakaguchi S. Control of regulatory T cell development by the transcription factor Foxp3. Science. 2003;299:1057–1061. [PubMed] [Google Scholar]
- 53.Kang HK, Michaels MA, Berner BR, Datta SK. Very low-dose tolerance with nucleosomal peptides controls lupus and induces potent regulatory T cell subsets. Journal of immunology. 2005;174:3247–3255. doi: 10.4049/jimmunol.174.6.3247. [DOI] [PubMed] [Google Scholar]
- 54.Paust HJ, Ostmann A, Erhardt A, Turner JE, Velden J, Mittrucker HW, Sparwasser T, Panzer U, Tiegs G. Regulatory T cells control the Th1 immune response in murine crescentic glomerulonephritis. Kidney international. 2011;80:154–164. doi: 10.1038/ki.2011.108. [DOI] [PMC free article] [PubMed] [Google Scholar]
- 55.Cavassani KA, Carson W.F.t., Moreira AP, Wen H, Schaller MA, Ishii M, Lindell DM, Dou Y, Lukacs NW, Keshamouni VG, Hogaboam CM, Kunkel SL. The post sepsis-induced expansion and enhanced function of regulatory T cells create an environment to potentiate tumor growth. Blood. 2010;115:4403–4411. doi: 10.1182/blood-2009-09-241083. [DOI] [PMC free article] [PubMed] [Google Scholar]
- 56.Zhou X, Kong N, Zou H, Brand D, Li X, Liu Z, Zheng SG. Therapeutic potential of TGF-beta-induced CD4(+) Foxp3(+) regulatory T cells in autoimmune diseases. Autoimmunity. 2011;44:43–50. doi: 10.3109/08916931003782163. [DOI] [PMC free article] [PubMed] [Google Scholar]
- 57.Saxena V, Lienesch DW, Zhou M, Bommireddy R, Azhar M, Doetschman T, Singh RR. Dual roles of immunoregulatory cytokine TGF-beta in the pathogenesis of autoimmunity-mediated organ damage. Journal of immunology. 2008;180:1903–1912. doi: 10.4049/jimmunol.180.3.1903. [DOI] [PMC free article] [PubMed] [Google Scholar]
- 58.Grande JP. Mechanisms of progression of renal damage in lupus nephritis: pathogenesis of renal scarring. Lupus. 1998;7:604–610. doi: 10.1191/096120398678920721. [DOI] [PubMed] [Google Scholar]
- 59.Strutz F, Neilson EG. New insights into mechanisms of fibrosis in immune renal injury. Springer seminars in immunopathology. 2003;24:459–476. doi: 10.1007/s00281-003-0123-5. [DOI] [PubMed] [Google Scholar]
- 60.Border WA, Okuda S, Languino LR, Sporn MB, Ruoslahti E. Suppression of experimental glomerulonephritis by antiserum against transforming growth factor beta 1. Nature. 1990;346:371–374. doi: 10.1038/346371a0. [DOI] [PubMed] [Google Scholar]
- 61.Hill GS, Delahousse M, Nochy D, Thervet E, Vrtovsnik F, Remy P, Glotz D, Bariety J. Outcome of relapse in lupus nephritis: roles of reversal of renal fibrosis and response of inflammation to therapy. Kidney international. 2002;61:2176–2186. doi: 10.1046/j.1523-1755.2002.00357.x. [DOI] [PubMed] [Google Scholar]
- 62.Filaci G, Bacilieri S, Fravega M, Monetti M, Contini P, Ghio M, Setti M, Puppo F, Indiveri F. Impairment of CD8+ T suppressor cell function in patients with active systemic lupus erythematosus. Journal of immunology. 2001;166:6452–6457. doi: 10.4049/jimmunol.166.10.6452. [DOI] [PubMed] [Google Scholar]
- 63.Mohan C, Morel L, Yang P, Watanabe H, Croker B, Gilkeson G, Wakeland EK. Genetic dissection of lupus pathogenesis: a recipe for nephrophilic autoantibodies. The Journal of clinical investigation. 1999;103:1685–1695. doi: 10.1172/JCI5827. [DOI] [PMC free article] [PubMed] [Google Scholar]
- 64.Grabiec AM, Krausz S, de Jager W, Burakowski T, Groot D, Sanders ME, Prakken BJ, Maslinski W, Eldering E, Tak PP, Reedquist KA. Histone deacetylase inhibitors suppress inflammatory activation of rheumatoid arthritis patient synovial macrophages and tissue. Journal of immunology. 2010;184:2718–2728. doi: 10.4049/jimmunol.0901467. [DOI] [PubMed] [Google Scholar]
- 65.Reilly CM, Thomas M, Gogal R, Jr, Olgun S, Santo A, Sodhi R, Samy ET, Peng SL, Gilkeson GS, Mishra N. The histone deacetylase inhibitor trichostatin A upregulates regulatory T cells and modulates autoimmunity in NZB/W F1 mice. Journal of autoimmunity. 2008;31:123–130. doi: 10.1016/j.jaut.2008.04.020. [DOI] [PubMed] [Google Scholar]


