

Abstract
Treatment of experimental autoimmune encephalomyelitis (EAE) with Resveratrol, an activator of Sirtuin 1 (SIRT1), reduces disease severity. This suggested that activators of SIRT1, a highly conserved nicotinamide adenine dinucleotide (NAD)-dependent protein deacetylase, might have immune-modulating or neuroprotective therapeutic effects in EAE. Previously, we showed that SIRT1 expression increases in EAE, suggesting that it is an adaptive response. In this study, we investigated the potential function of SIRT1 in regulating EAE using SIRT1 overexpressing mice. The current studies examine potential neuroprotective and immunomodulatory effects of SIRT1 overexpression in chronic EAE induced by immunization of C57Bl/6 mice with myelin oligodendrocyte glycoprotein peptide (MOG35-55). SIRT1 suppressed EAE clinical symptoms compared with wild-type EAE mice and prevented or altered the phenotype of inflammation in spinal cords; as a result, demyelination and axonal injury were reduced. Significant neuroprotective effects were observed, with fewer apoptotic cells found in the spinal cords of SIRT1 overexpressing EAE mice; associated with increased brain-derived neurotrophic factor (BDNF) and NAD levels. Earlier, we showed that BDNF and NAD play crucial neuroprotective roles in EAE. These results suggest that SIRT1 reduces neuronal loss in this chronic demyelinating disease model and that this is associated with a reduction in inflammation.
Keywords: Multiple sclerosis (MS), Experimental Autoimmune Encephalomyelitis (EAE), Sirtuin1 (SIRT1), Inflammation, Demyelination, Neuroprotection
Introduction
Multiple sclerosis (MS) is a disease of the CNS that is characterized by inflammation and neurodegeneration, which cause a variable course of neurologic disability (1). Clinically, MS can be characterized by relapses and remissions and/or progressive disability. Relapses result from inflammatory events causing focal neurologic dysfunction that remit as acute inflammation resolves. The process is associated with neurodegeneration, which more closely correlates with permanent neurologic deficits (2,3,4). In other cases, MS follows a primary or secondary progressive disease course marked by a slow neurologic decline, with axonal damage and irreversible neuronal loss often without clear episodes of inflammation (1). Much of the pathogenesis of MS has been inferred from studies of experimental autoimmune encephalomyelitis (EAE) (5,6,7). Based on this analogy, MS is thought to be an autoimmune disorder (7) mediated by autoreactive T cells specific for myelin antigens (1,8,9,10). The immune imbalance is mainly in the adaptive immune response involving both T cells and B cells of the proinflammatory subsets, T helper 1 (Th1) and Th17 (11,12,13). Immunomodulators were shown to reduce inflammation in MS, but they do not cure the disease or prevent long term disability (14) and have limited effects on neurodegeneration (15,16,17,18). It is widely believed that new treatments with neuroprotective properties are needed.
Sirtuin 1 (SIRT1) is the closest mammalian homologue of the yeast silent information regulator 2 (Sir2) and has a role in lifespan modulation (19,20,21,22). SIRT1 has been linked to neurodegenerative diseases (23,24,25). A pharmaceutical formulation of resveratrol (SRT501) that activates SIRT1 prevents neuronal damage, and long-term neurologic dysfunction in EAE (26,27,28). Importantly, either SRT501 or other SIRT1 activating compounds regulate inflammation in EAE (26,27,28). This result suggests that resveratrol has the potential to complement current immunomodulatory MS therapies that fail to prevent neurodegeneration. In this context, it is not clear whether SIRT1 can exert any neuroprotective role in EAE or MS. There are limited studies that suggest a relationship between SIRT1 and MS/EAE diseases based on in vivo transgenic (Tg) methods. In the present study, we generated neuron-specific SIRT1 transgenic mice that overexpress human SIRT1 in neurons. We examined possible neuroprotective effects of SIRT1 in SIRT1-overexpressing mice with EAE compared with wild-type (WT) mice with EAE. Overexpression of SIRT1 was associated with reduced neuronal damage during EAE suggesting a neuroprotective effect due to immunomodulatory and neuroprotective mechanisms.
Material and Methods
Animals
Wild Type (WT) C57Bl/6J mice were obtained from The Jackson Laboratory (Bar Harbor, ME, USA). Transgenic mice were developed in the University of Maryland School of Medicine Transgenic animal core facility, Baltimore, MD. Transgenic mice and WT mice were housed under pathogen-free conditions at the animal facility of the University of Maryland School of Medicine, Baltimore. All experimental procedures were conducted following NIH guidelines under an Institutional Animal Care and Use Committee-approved protocol from the University of Maryland School of Medicine, Baltimore.
Generation of pTet CaMKII-mito/eYFP transgenic mice
Mitochondrial eYFP (mito/eYFP) encodes a fusion protein of mitochondrial targeting sequence from subunit VIII of human cytochrome c oxidase with eYFP. The fragment of mito/eYFP was generated by digesting the plasmid pEYFP-mito (Clontech, Mountain View, CA, USA) with the restriction enzymes NheI and NotI. The mito/eYFP fragment was cloned between NheI and NotI sites of the tetracycline-responsive element (TRE) bi-functional plasmid pTRE2-Bi-Neo (Clontech). SIRT1 cDNA was purchased from Origene (Origene, Gaithersburg, MD, USA) and cloned into the Xba1/Nde1 site of pTRE2-Bi-Neo. The insert devoid of vector sequences, containing the Tetresponsive promoter upstream of the SIRT1 and mito/eYFP coding sequence and SV40 poly(A) signal, was used for injection into fertilized C57BL/6 eggs to create pTRE-SIRT1/mito/eYFP transgenic founders. Transgenic mice expressing the tetracycline-controlled transactivator protein (tTA) under regulatory control of the forebrain-specific calcium/calmodulin-dependent kinase IIα (CaMKIIα) promoter (pCaMKIIα-tTA) were purchased from The Jackson Laboratory (29). Bigenic mice that are positive for both pCaMKIIα-tTA and TRE-SIRT1/mito/eYFP (double-positive or bigenic) were obtained by crossing pTRE SIRT1/mito/eYFP mice with pCaMKIIα-tTA mice.
Genotyping
Animals positive for the transgene were identified by PCR using genomic DNA, isolated from the tails (Qiagen, Germantown, MD, USA). The primers were designed to hybridize with the mito/eYFP coding region (forward primer, 5′-GCTGACCCTGAAGTTCATCTGC-3, and reverse primer, 5′-CATGATATAGACGTTGTGGCTGTTG-3′) to amplify a 338 bp fragment. In the case of CaMKII, the primers (forward primer, 5′-GCTGTGGGGCATTTTACTTTAG-3, and reverse primer, 5′-CATGTCCAGATCGAAATCGTC-3′) were designed to amplify a 450 bp fragment. Fifty nanograms of genomic DNA were used in the PCRs, with a program of one cycle of 94°C for 3 min, 35 cycles of 94°C for 30 s, 60°C for 30 s, 72°C for 30 s, and one cycle of 72°C for 5 min. The PCR products were separated on 1% agarose gel, stained with ethidium bromide, and imaged.
Doxycycline-responsive regulation of SIRT1 and eYFP expression
The parents of the bigenic mice were fed a normal diet. Because pCaMKII-tTA is a tet-off system, the bigenic pups that inherits both pCaMKII-tTA and pTRE2- SIRT1/mito/eYFP genes expressed SIRT1 and eYFP and eYFP exhibited fluorescence in the brain, which could be visualized through the skull at postnatal day 1 using a fluorescence visualization goggle (GFSP-5; Biological Laboratory Equipment, Budapest, Hungary). We examined doxycycline-responsive regulation of transgene expression in the bigenic mice by replacing doxycycline-free diet with doxycycline (200 mg/kg; BioServ, Frenchtown, NJ, USA) containing diet.
EAE Induction
EAE was induced in WT and SIRT1 mice. All animals were used at 8 weeks of age. EAE induction, evaluation and scoring the clinical severity of the disease was carried out as described previously (30,31). EAE were induced with 200 μg myelin oligodendrocyte glycoprotein 35–55 (MOG) peptide (Biomer Technology, Pleasanton, CA, USA). EAE mice were given a clinical score until day 60.
Detection of tissue pathology
Mice were euthanized on day 60. Spinal cords were removed and paraffin sections were prepared as described previously (31). 7μm thick sections were stained with hematoxylin and eosin (H&E) (to detect inflammatory infiltrates) and Luxol Fast Blue (for demyelination) following standard protocols for conventional light microscopy. Analysis of inflammation and demyelination was performed as described previously (32) in a blinded manner.
TUNEL Assay for apoptotic cell death
Paraffin embedded tissues sections (7μm) were examined by in situ terminal deoxynucleotidyl transferase-mediated biotinylated UTP nick end labeling (TUNEL), and by activated cleaved caspase-3. Apoptosis was detected on paraffin sections by an ApopTag peroxidase in situ apoptosis detection kit (Chemicon International, Temecula, CA, USA) according to the manufacturer’s instructions.
Immunohistochemistry
Immunohistochemistry was performed as described (32) using VECTASTAIN ABC kits (Vector Laboratories, Burlingame, CA, USA). 7μm thick sections were used. Primary antibodies used are listed in Table I. Nuclei were counterstained with hematoxylin. Slides were examined using standard brightfield microscopy.
Table I.
Antibodies used in the present study
| Antibody | Vendor | Concentration |
|---|---|---|
| Anti MBP | EMD Millipore, Billerica, MA, USA | 1:200(IHC)* |
| Anti SIRT1 | LifeSpan BioSciences, Seattle, WA, USA | 1:500(IHC) |
| Anti SIRT1 | Santa Cruz Biotechnology, Santa Cruz, CA, USA | 1:400(WB)# |
| Anti SIRT3 | Santa Cruz Biotechnology, Santa Cruz, CA, USA | 1:100(IHC) |
| Anti Nampt | Novus Biologicals, Littleton, CO, USA | 1:100(IHC) |
| Anti Cleaved Caspase 3 | Cell Signaling Technology, Danvers, MA, USA | 1:50(IHC) |
| Anti TrkB | Santa Cruz Biotechnology, Santa Cruz, CA, USA | 1:250(IHC) |
| Anti GAD 67 | Santa Cruz Biotechnology, Santa Cruz, CA, USA | 1:200(IHC) |
| Anti CD3 | Abcam, Cambridge, MA, USA | 1:200(IHC) |
| Anti CD 20 | Santa Cruz Biotechnology, Santa Cruz, CA, USA | 1:100(IHC) |
| SMI-32 | Covance Inc., Gaithersburg, MD, USA | 1:1000(IF)** |
| Anti BDNF | Santa Cruz Biotechnology, Santa Cruz, CA, USA | 1:200(IF) |
| Anti IL-10 | Santa Cruz Biotechnology, Santa Cruz, CA, USA | 1:50(IHC) |
| Anti IL-17 | Santa Cruz Biotechnology, Santa Cruz, CA, USA | 1:50(IHC) |
| Anti INF-γ | Bioss, Inc., Woburn, MA, USA | 1:100(IHC) |
| GAPDH Antibody | Santa Cruz Biotechnology, Santa Cruz, CA, USA | 1:500(WB) |
IHC- Immunohistochemistry
WB- Western Blot
IF- Immunoflourescence
Immunofluorescence
7μm thick paraffin sections were deparaffinized in xylene, rehydrated through graded alcohols to water, washed in 0.01 M PBS, preincubated with 10% donkey serum for 60 min, and then incubated overnight at 4°C with primary antibody diluted in PBS with 1% bovine serum albumin (BSA) together with 0.3% Tween-20. SMI-32 and BDNF (Table 1) were used as primary antibodies in two different experiments. For the secondary antibody step, Alexa Fluor 594 Donkey anti-mouse and Alexa Fluor 594 Donkey Anti Rabbit (Invitrogen, Grand Island, NY) were used for SMI32 and BDNF respectively for 1 hr at room temperature in a humidified chamber. The specificity of the immunostaining for all the proteins was tested in control slides by incubation with pre-immune pre-adsorption of the antibody with the respective peptides used as immunogens. Slides were examined using standard fluorescence microscopy and results were quantitated by counting fluorescent cells per area or field.
Preparation of brain homogenates
Frozen mice brain tissue was rinsed in phosphate-buffered saline and then transferred to the Dounce tissue grinder (Wheaton Manufacturers, NJ, Milville, NJ). Homogenization buffer [10 mM HEPES (pH 7.9), 10 mM KCl, 0.1 mM EDTA, 0.1 mM EGTA, 1 mM DTT, 0.5 mM PMSF] was added at a ratio of 2.5 ml/g tissue. Five strokes of pestle were used to homogenize tissue to a liquid mass. After the addition of NP-40 (0.5%), five additional strokes of homogenization were performed. The homogenates were transferred to Eppendorf tubes and stored as whole brain homogenates at −80°C until Western blotting was done. The protein content of each sample was determined using the Bradford protein assay kit (Sigma, St. Louis, MO, USA).
Western blot analysis
Homogenized samples were boiled for 5 min with a gel-loading buffer [125 mM Tris-Cl, 4% sodium dodecyl sulfate (SDS), 10% 2-mercaptoethanol (pH 6.8), 0.2% bromphenol blue] in a ratio of 1:1. Total protein equivalents for each sample were separated by SDS–polyacrylamide gel electrophoresis (PAGE) with NuPAGE Novex Bis-Tris precast 4–12% gradient gels (Invitrogen Life Science, Carlsbad, CA, USA) and transferred to nitrocellulose membranes. The membranes were blocked for 1 hr and incubated overnight with primary antibody and then 1 hr with secondary antibody. The primary antibodies used for Western blots are listed in Table I. Horseradish peroxidase-conjugated donkey anti-rabbit IgG (1:2000) or Goat anti-mouse IgG (1:10,000) (Santa Cruz Biotechnology, CA, USA) were used as secondary antibodies. Chemiluminescent signals were detected using the ECL Western blotting detection Kit (Amersham Biosciences, Piscataway, NJ, USA).
Statistical analysis
Lumbar region spinal cord sections were selected from each of four animals per experimental group for pathology and immunohistochemistry. All the histological quantification was performed by a blinded observer. Statistical analyses were done using Prism software (GraphPad, San Diego, CA, USA). Data are provided as mean ± SEM. Significances between groups were examined by the t-test for EAE clinical score. For the remaining experiments, One-way ANOVA or t-test were used for statistical analysis. In all experiments, a P value of < 0.05 was defined as statistically significant.
Results
Generation and expression of SIRT1 overexpressing mice
OCT-embedded, fresh hippocampal brain and spinal cord sections (30μm), fixed with 4% paraformaldehyde were viewed under fluorescent microscope. These sections showed a distinct neuronal expression of mito-eYFP (Figure 1A) which confirms the presence of SIRT1 in the neurons. Bigenic mice were also identified by PCR analysis using tail DNA (Data not shown). To further confirm the overexpression of SIRT1 within the CNS, Western blot analysis was done on whole brain homogenates. SIRT1 mice showed a significantly (P<0.001) (Figure 1B,1C) higher expression of SIRT1 as compared to WT mice.
Figure 1. Generation and expression of SIRT1 and eYFP in the bigenic mice.

(A) Bigenic mice (SIRT1) were generated by crossing CamK2a-tTA mice with TRE-SIRT1–mito/eYFP mice. Hippocampal brain sections and spinal cord sections were prepared and viewed under a fluorescent microscope and showed neuronal expression of mito/eYFP. Brain, original magnification ×40. Spinal cord, original magnification ×100. (B) Western blot analysis of SIRT1 protein in the brain extracts prepared from bigenic and WT mice. GAPDH was used as loading control. (C) Quantification of SIRT1 protein levels shows a significant increase in the levels of SIRT1 protein in the bigenic mice compared with WT. **p < 0.001, t test.
SIRT1 reduces the severity of EAE
WT mice showed a typical course of chronic EAE, marked by increasing paralysis score beginning about 9 days after immunization, peaking several days later, and then persisting (Figure 2A). SIRT1 suppressed EAE post-immunization and EAE severity never reached levels equivalent to WT mice. The clinical severity was plotted between the groups and shown in Figure 2A. Mean clinical score for 60 days is plotted in Figure 2B. There is a significant decrease (P<0.0001) of mean clinical score in SIRT1 group of animals compared to WT groups. Day of disease onset and mean clinical scores during the acute and chronic phases and for the entire disease period are shown in Table II. It was reported previously that SIRT1 activators reduce clinical severity in EAE (33,34).
Figure 2. SIRT1 overexpression attenuates EAE clinical scores.
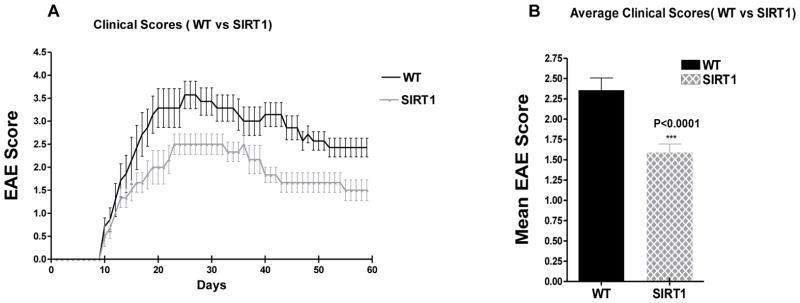
Female WT and SIRT1-overexpressing mice (n = 8/group) were immunized with MOG35–55 emulsified in CFA, followed by a pertussis toxin injection, to establish EAE. (A) Clinical disease scores in WT and SIRT1 EAE animals over a 60-d period. (B) Mean score for all animals in each group over the 60-d period. The mean score was significantly lower in SIRT1 EAE mice compared with WT EAE mice; t test.
Table II.
Summary of EAE clinical scores in WT and SIRT1 mice
| Group | Incidence/Total (%) | Number of mice dead | Disease onset (days)* | Mean clinical scores during acute phase | Mean clinical scores during chronic phase | Mean clinical scores throughout disease course |
|---|---|---|---|---|---|---|
| WT | 7/8(87.5) | 1 | 10.71±2.1 | 2.85 ± 0.15 | 2.68 ± 0.06 | 2.36 ± 0.15 |
| SIRT1 | 6/8(75) | 2 | 10.83±1.2 | 2.02 ± 0.11# | 1.6 ± 0.02## | 1.59 ± 0.11 |
Data were accumulated and averaged from one experiment with 8 mice each in WT and SIRT1 groups. The values are presented as mean ± SEM.
Disease onset is defined as the first day of two consecutive days with a clinical score of one or more. Statistical significance was determined by t-test.
No significant delay was found in the onset of disease.
The mean EAE score over the acute phase (10–39 days) was significantly lower (p<0.0001) in SIRT1 compared to WT EAE mice
The mean EAE score over the entire chronic phase (40–60 days) was also significantly lower (p<0.0001) in SIRT1 compared to WT EAE mice
SIRT1 reduces CNS inflammation
Sections of spinal cords stained by H&E were examined for areas of inflammatory cell infiltration. Foci of inflammation were observed in the white matter of WT EAE spinal cords, and similar inflammation was detected in EAE spinal cords from SIRT1 mice (Figure 3A–D). We compared the extent of the inflammatory response in spinal cord sections from the different experimental groups of animals. Meningeal, perivascular and parenchymal inflammatory infiltrates were quantitatively reduced (Figure 3M) n SIRT1 EAE mice compared with WT EAE mice. Histological analyses revealed a significant (p < 0.017) difference in the infiltrated cell accumulation: 25% of the quadrants in SIRT1 EAE mice were positive for inflammation compared with 51% in the WT EAE group.
Figure 3. SIRT1-overexpressing EAE mice show decreased inflammation and decreased amounts of CD3 and CD20+ cell infiltration in the spinal cord.

H&E-stained sections show infiltration of mononuclear cells in white matter of both WT EAE (B) and SIRT1 EAE (D) mice. However, fewer inflammatory pockets (arrows) and inflammatory cells are seen in SIRT1 EAE compared with WT EAE. Normal WT (A) and SIRT1 (C) mice show no inflammatory infiltrates. WT EAE spinal cord (F) stained with Ab to CD3 shows numerous T cells (arrows) mainly within the white matter compared with SIRT1 EAE (H). Normal WT (E) and SIRT1 (G) mice show negligible numbers of CD3+ cells. Adjacent sections stained with CD20 Ab, a B cell marker, demonstrate numerous CD20-expressing cells (arrows) in the same inflammatory foci in the white matter of WT EAE mice (J) compared with SIRT1 EAE mice (L). Normal WT (I) and SIRT1 (K) mice show no CD20+ cells. Original magnification ×200 (A–D), ×400 (E–L). (M) The number of positive quadrants with inflammation was scored and expressed as a percentage of the total number of quadrants (H&E; n = 4); t test. (N) Quantification of CD3-expressing cells in white matter (n = 4); t test. (O) Quantification of CD20-expressing cells in white matter (n = 4); t test.
SIRT1 modulates the phenotype of CNS inflammation
Although SIRT1 overexpression decreases clinical severity in EAE by suppressing the gross level of inflammation that occurs in the spinal cord, it is possible that SIRT1 may reduce neuronal damage by altering the type of inflammatory cells that enter the CNS. To assess the basic types of inflammatory cells present, sections of spinal cord from SIRT1 and WT EAE mice were stained with markers of T cells (CD3) and B cells (CD20). Similar to previous studies, inflammatory lesions in EAE spinal cord contained numerous T cells, with fewer B cells present, demonstrating the ability of these antibodies to detect expected cell types (Figure 3E–L). To quantify the relative contribution of different cell types in spinal cord infiltrates, the presence of each type of inflammatory cell, and the relative level of inflammation, was scored. A significant difference in the amount of inflammation caused by CD3 (p <0.0031) and CD20 (p<0.0197) was observed between SIRT1 EAE and WT EAE mice (Figure 3N,O). Studies conducted in EAE demonstrated a reduction of infiltrated leucocytes into the CNS possibly due to an induction of Th1 to Th2 shift and also suppression of proinflammatory Th17 responses (35,36,37). To further investigate the role of SIRT1 in immune modulation in vivo, we measured proinflammatory cytokines IFN-γ, IL-17, and anti-inflammatory cytokine IL-10 (Fig. 4). IFN-γ expression was increased significantly (Fig. 4M) in WT EAE animals, particularly in the white matter, compared with SIRT1 EAE animals (p < 0.0008). There was no IFN-γ detected in the gray matter. However, IL-17 was detected in both white and gray matter of the spinal cord. Interestingly, in the white matter, IL-17 expression was significantly higher in WT EAE animals compared with SIRT1 animals (p < 0.05) (Fig. 4N), but the numbers of IL-17–expressing cells in gray matter did not differ between the groups (data not shown). In contrast, expression of the Th2 cytokine IL-10 was decreased significantly (Fig. 4O) in the white matter of WT EAE animals compared with SIRT1 EAE animals (p < 0.04). IL-10 expression was also detected in the gray matter; however, there was no significant difference between the groups (data not shown).
Figure 4. SIRT1-overexpression in EAE mice altered the magnitude of the T cell response in the spinal cord.

Section of WT EAE spinal cord (B) stained with Ab to IFN-γ shows numerous IFN-γ–expressing cells (arrows) mainly within the white matter compared with SIRT1 EAE (D). (i) IFN-γ–expressing cells in the box in (D) are shown at higher magnification. Section of WT EAE spinal cord (F) stained with Ab to IL-17 shows numerous IL-17–expressing cells (arrows) mainly within the white matter compared with SIRT1 EAE (H). (ii) IL-17–expressing cells in the box in (H) are shown at a higher magnification. Section of SIRT1 EAE spinal cord (L) stained with Ab to IL-10 shows numerous IL-10–expressing cells (arrows) mainly within the white matter compared with WT EAE (J). (iii) IL-10–expressing cells in the box in (L) are shown at a higher magnification. Normal WT (A, E, I) and SIRT1 (C, G, K) showed negligible number of IFN-γ, IL-17, and IL-10–expressing cells. Original magnification ×400 (A–L). (M) Quantification of IFN-γ–expressing cells in white matter (n = 4); t test. (N) Quantification of IL-17–expressing cells in white matter (n = 4); t test. (O) Quantification of IL-10–expressing cells in white matter (n = 4); t test.
SIRT1 protects the spinal cord from demyelination and loss of oligodendrocytes
Demyelination is one of the major histopathologic hallmarks in EAE and MS (32). Our histological observation indicated that the spinal cords from the WT EAE mice were weakly stained with LFB, especially in the white matter tracts (Fig. 5B), whereas a more intense LFB stain was observed in the SIRT1 EAE group (Figure 5D) and a uniform intense staining was seen in normal WT and SIRT1 Mice (Figure 5A,C). We found a significant reduction of demyelinating area (P < 0.0049) in the spinal cord of the SIRT1 EAE mice as compared to WT EAE mice (Figure 5I).
Figure 5. SIRT1-overexpressing EAE mice show decreased demyelination and loss of myelin in the spinal cord.

LFB-stained sections show more areas of demyelination (lack of blue stain; arrows) in the spinal cords of WT EAE mice (B) compared with SIRT1 EAE mice (D). Normal WT (A) and SIRT1 (C) spinal cord sections show uniform staining. Section of WT EAE spinal cord (F) stained with Ab to MBP shows more myelin loss (arrows) compared with SIRT1 EAE spinal cord (H). Normal WT (E) and SIRT1 (G) mice exhibit normal myelin. Original magnification ×200 (A–H). (I) Total areas of demyelination were measured using NIH ImageJ software (n = 4); t test. (J) The number of quadrants with sparse staining for MBP was scored and expressed as a percentage of the total number of quadrants (n = 4); t test.
MBP is one of the major proteins in the myelin sheath (38) and mature oligodendrocytes (OLs) only have the capacity to produce MBP (39). Therefore, its expression indicates presence of OLs. Interestingly, a dramatically decreased MBP staining was observed in the WT as compared to SIRT1 EAE mice, indicating more OLs cells were present in the SIRT1 mice (Figure 5E–H). Histological analyses revealed a significant difference in MBP expression: 30% of the quadrants in SIRT1 EAE mice displayed sparse staining compared with 45% of the quadrants in WT EAE mice (p < 0.0092) (Figure 5J). Together, these results indicate that SIRT1 protects the spinal cord from demyelination and loss of OLs in EAE mouse models. This is a prominent response to demyelination.
SIRT1 protects the spinal cord from axonal injury
To assess the contents of spared spinal cord of SIRT1 and WT groups after EAE, spinal cords sections were examined for the extent of neurofilament H (NF-H) dephosphorylation via anti-SMI-32 immunohistochemstry. SMI-32 immunopositivity was found predominantly in neuronal cell bodies in both WT EAE and SIRT1 EAE animals (Figure 6A,D). There was a significant increase of SMI-32 staining, both in number of neurofilaments (p<0.0064)(Figure 6G) and the intensity of fluorescence, in the SIRT1 EAE mice compare to WT EAE mice. This data supports that SIRT1 plays an important role in preventing axonal damage in EAE.
Figure 6. SIRT1 prevents axonal damage.
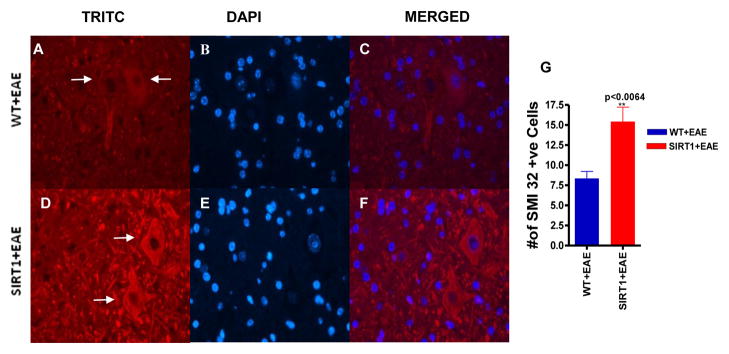
Section of SIRT1 EAE spinal cord (D) stained with Ab to SMI 32 shows numerous phosphorylated neurofilaments (red) (arrows) compared with WT EAE spinal cord (A). (B and E) Sections were counterstained with DAPI (blue). (C and F) Merged pictures of TRITC and DAPI. Original magnification ×400 (A–F). (G) Quantification of the number of SMI 32–expressing cells in gray matter (n = 4); t test.
SIRT1 and Nampt mediated neuroprotection in EAE
We targeted SIRT1 gene expression especially in neurons. The expression pattern of SIRT1 in the gray matter in WT EAE and SIRT1 mice with or without EAE suggest that it is expressed in the neurons (Figure 7A–D). Tanno et.al, (2007) (40) reported that SIRT1 has both nuclear as well as cytoplasmic localization in neurons. In some neurons, SIRT1 mostly appears predominantly cytoplasmic (41). Interestingly, we found SIRT1 expression in the cytosoloic fraction that we reported previously (32). In this model system we found a significant increase of SIRT1 expression in SIRT1 EAE mice (p<0.001) compared to WT EAE mice (Figure 7M). It is known that Nampt controls the activity of SIRT1 (42) There was no significant difference of Nampt expression in normal WT and SIRT1 mice (Figure 7E,G). Nampt levels decreased after EAE induction in both the groups of mice (Figure 7F,H). However, the expression of Nampt was significantly higher (p<0.001) in SIRT1 EAE mice compared to WT EAE mice (Figure 7N). This suggests that during EAE stress SIRT1-adaptive responses activate the NAD pathway, which may further contribute to neuroprotection. SIRT3 deacetylates and regulates the enzymatic activity of many metabolic enzymes in mitochondria. However, although we detected SIRT3 expression in our model system, there was no significant change between the animal groups (Figure 7I–L,O) which indicates that SIRT1 overexpression does not influence other sirtunins.
Figure 7. SIRT1 affects NAD dynamics through Nampt.

Section of SIRT1 EAE spinal cord (D) stained with Ab to SIRT1 shows numerous SIRT1-expressing cells (arrows) mainly within the gray matter compared with WT EAE spinal cord (B). Normal SIRT1 mice (C) also show more SIRT1 compared with WT mice (A). (E–H) All of the sections stained with Ab to Nampt show numerous Nampt-expressing cells (arrows) in the gray matter. Normal SIRT1 mice (G) show more Nampt compared with normal WT (E) and EAE mice (F, H). Nampt is depleted in EAE; however, SIRT1 EAE has more Nampt compared with WT EAE. (I–L) All of the sections stained with Ab to SIRT3 show numerous SIRT3-expressing cells (arrows) in the gray matter. There is no difference in SIRT3 staining among the groups. Original magnification ×200 (A–L). (M) Quantification of SIRT1-expressing cells in gray matter (n = 4). p < 0.001, SIRT1 EAE mice versus WT EAE, one-way ANOVA. (N) Quantification of Nampt-expressing cells in gray matter (n = 4). p < 0.001, SIRT1 EAE mice versus WT EAE, one-way ANOVA. (O) Quantification of SIRT3-expressing cells in gray matter.
SIRT1 protects against apoptosis in EAE
We used the TUNEL assay to evaluate the protective effects of SIRT1 in terms of neuronal apoptosis of the damaged spinal cords, as well as the neurologic deficits caused by EAE. We counted all TUNEL-positive cells in a single microscopic field of each of 5 randomly selected sections of each target area (Figure 8A–D). TUNEL-positive cells were significantly lower in SIRT1 EAE spinal cords than in WT EAE spinal cords (p < 0.0005) (Figure 8I). To testify that SIRT1 antiapoptotic function was associated with reduced pro-apoptotic cleaved caspase-3 expression, we further examined the levels of cleaved caspase-3 by immunohistochemistry (Figure 8E–H). Compared with WT EAE (Figure 8F), SIRT1 EAE spinal cords (Figure 8H) were associated with a significant reduction (p < 0.0047) in the number of cleaved caspase-3-positive cells (Figure 8J) within the lesions.
Figure 8. SIRT1 overexpression reduces apoptosis in EAE.

In situ TUNEL staining of spinal cord sections showed numerous apoptotic cells (brown) (arrows) in WT EAE mice (B) compared with SIRT1 EAE mice (D). Normal WT (A) and SIRT1 (C) mice do not exhibit apoptotic cells. Section of WT EAE spinal cord (F) stained with Ab to cleaved caspase-3 shows numerous positive cells (arrows) compared with SIRT1 EAE spinal cord (H). Normal WT (E) and SIRT1 (G) mice show no cleaved caspase-3+ cells. (I) Quantification of TUNEL+ cells in white matter (n = 4); t test. (J) Quantification of cleaved caspase-3–expressing cells in white matter (n = 4); t test.
SIRT1 restores BDNF function in EAE
Linker et.al 2010 reported the role of BDNF in MS and EAE (43). Our previous study suggests that BDNF delivery in EAE animals increases SIRT1 expression (32). In this context, it is not known if SIRT1 overexpression increases BDNF level. We performed immunofluorescence staining to detect BDNF expression in our animal models; it was found in both white and gray matter of spinal cord. In the white matter, a significant reduction (p < 0.0012) (Figure 9S) in BDNF expression was observed (Figure 9J) in WT EAE animals compared to SIRT1 EAE animals (Figure 9L) and the pattern of expression seems to be axonal and it is known that axons express BDNF (44). In contrast, in the gray matter, BDNF expression was from the neuronal cell body. Also, the number of BDNF-expressing cells was significantly increased (p<0.006) (Figure 9T) in SIRT1 EAE animals (Figure 9P) compared with WT EAE animals (Figure 9N). Overall, we found a significant increase of BDNF expression in SIRT1 spinal cord compared with WT spinal cord (Figure 9).
Figure 9. SIRT1 increases BDNF activity in the CNS.

(A–D) All of the sections stained with Ab to TrkB show numerous TrkB-expressing cells (arrows) in the gray matter. Normal SIRT1 mice (C) show more TrkB compared with normal WT (A) and EAE (B, D) groups. TrkB expression is decreased in EAE; however, SIRT1 EAE has more TrkB compared with WT EAE. (E–H) All of the sections stained with Ab to GAD67 show numerous GAD67-expressing cells (arrows) in the gray matter. Normal SIRT1 mice (G) show more GAD67 compared with normal WT (E) and EAE (F, H) groups. GAD67 expression is decreased in EAE; however, SIRT1 EAE has more GAD67 compared with WT EAE. (I–L) All of the sections stained with Ab to BDNF show BDNF expression in white matter. Normal WT (I) and SIRT1 (K) mice show uniform expression of BDNF throughout the white matter. WT EAE (J) shows more BDNF depletion (arrows) compared with SIRT1 EAE (L). (M–P) All of the sections stained with Ab to BDNF show numerous BDNF-expressing cells (arrows) in the gray matter. Normal SIRT1 mice (O) show more BDNF compared with normal WT (M) and EAE (N, P) groups. BDNF expression is decreased in EAE; however, SIRT1 EAE (P) has more BDNF compared with WT EAE (N). (Q) Quantification of TrkB-expressing cells (n = 4). p < 0.049, SIRT1 EAE versus WT EAE mice, t test. (R) Quantification of GAD67-expressing cells (n = 4). p < 0.0368, SIRT1 EAE versus WT EAE mice, t test. (S) The number of quadrants with depleted BDNF (loss) was scored and expressed as a percentage of the total number of quadrants (n = 4); t test. (T) Quantification of BDNF-expressing cells (n = 4). p < 0.006, SIRT1 EAE versus WT EAE mice, t test.
Furthermore, we detected increased expression of TrkB receptor in SIRT1 mice compared to WT mice (Figure 9A–D,Q). In addition we detected GAD67 expression in these spinal cords. We found a significantly increased expression of GAD67 in SIRT1 mice compared with WT mice (Figure 9E–H,R). GAD67 expression suggests that endogenous BDNF is functionally active, as GAD67 is a BDNF induced gene. The levels of BDNF decreased in WT EAE and SIRT1 EAE mice as reported (43). As a result, TrkB and GAD67 expression also decreased in these spinal cords. However, the expression of TrkB(p<0.049) and GAD67(p<0.0368) is still significantly higher in SIRT1 EAE mice compared to WT EAE mice. These experiments suggest that SIRT1-mediated restoration of BDNF concentration and function might be a mechanism for SIRT1 neuroprotection in EAE.
Discussion
To determine the role of SIRT1 in the mammalian MS disease model, EAE, we took advantage of an SIRT1 transgenic mouse model in which SIRT1 overexpression in the CNS is driven by a Tetracycline-regulated promoter. In this study, we show that SIRT1 overexpression actively attenuates the symptoms of disease progression in EAE.
The SIRT1 activator resveratrol (SRT501) was shown to suppress EAE exhibiting protection against myelin breakdown in the EAE animal model (26–28). Our present observations provide further evidence supporting the beneficial effects of SIRT1 on myelin forming oligodendrocytes (OLs) in EAE spinal cord. Enhanced MBP expression and more myelin staining by LFB in SIRT1 EAE mice spinal cord compared with WT EAE mice spinal cord suggest that SIRT1 protects OLs from undergoing cell death. Although we examined cell apoptosis in this case, we cannot provide direct evidence to confirm this proposed mechanism in the current study. Moreover, OLs dysfunction or demyelination has recently been implicated in the pathophysiology of schizophrenia, bipolar disorder, and major depression (45–48). Interestingly, all three disorders display major overlapping domains in their gene transcription profiles, especially genes involved in energy metabolism, inflammation, and myelination (49). Therefore, our present observations support the notion that some psychiatric disorders such as schizophrenia, bipolar disorder or major depression may share similarities in disease mechanism with MS.
Our investigation of CNS SIRT1 overexpression on inflammation in EAE mice reveals a significant reduction in the clinical symptoms, as well as reduced infiltration of inflammatory cells into the spinal cord. These results demonstrate that SIRT1 has potent antineuroinflammatory potential and strongly support its potential usefulness as a therapeutic intervention for MS and possibly other autoimmune and inflammatory diseases afflicting the CNS. Specifically, by showing that SIRT1 reduces T cell infiltration within the spinal cord parenchyma of EA mice, these data suggest a mechanism whereby diminishing persistent T cell infiltration might reduce ongoing neuronal damage. Also, our data indicate that the anti-inflammatory effects of SIRT1 in EAE are most likely mediated via T cell inactivation and inhibition of B cell infiltration. These findings add to a recent review by Kong et al. (50), in which they assert that small molecules that modulate SIRT1 functions are potential therapeutic reagents for autoimmune inflammatory disease.
Furthermore, to test the anti-inflammatory role of SIRT1 beyond immune cells, we investigated the inflammatory as well as anti-inflammatory cytokine profiles in these animal models. Interestingly, our observation of decreased pro-inflammatory cytokines (IFN-γ and IL-17) but an increase in the anti-inflammatory cytokine IL-10 in SIRT1 EAE animals compared with WT EAE animals is consistent with immunomodulatory function; SIRT1 skewed monocytes toward a a regulatory phenotype and also acted via modulation of anti-inflammatory mechanisms that may contribute to neuroprotective environment. Only recently has the role of SIRT1 in regulating IFN-γ, IL-17 and IL-10 levels in EAE been studied. In particular, IFN-γ has been shown to suppress SIRT1 transcription which disrupts energy expenditure and metabolic homeostasis in skeletal muscle cells (51). Sirtinol treatment (known SIRT1 inhibitor) or SIRT1 knockdown (by small interfering RNA) have blocked LPS-stimulated IL-17 in a cell culture model (52), whereas sirtinol treatment also reduced airway inflammation and hyper-reactivity in a mouse model of atopic asthma (53). However, in our model system, IL-17 expression decreased in SIRT1 EAE animals compared with WT EAE animals as the result of fewer infiltrated cells. In vitro studies have shown that SIRT1 limits the inflammatory process by inhibiting NF-κB and AP-1 (54,55,56), two transcription factors that are involved in the expression of proinflammatory cytokines such as TNF-α and IFN-γ. Furthermore, it has been shown that SIRT1 shows anti-inflammatory activities in different disease models (57,58) by inhibiting proinflammatory transcription factors such as NF-κB. Recently it has been shown that SIRT1 promotes Th2 responses (59). In this context, the increase in anti-inflammatory and Th2 cytokine IL-10 expression in our model system also supports a role for SIRT1 in the regulation of the Th2 response. Analysis of our animal model of EAE demonstrates that SIRT1 reduces infiltration of leucocytes into the CNS, induces a Th1 to Th2 shift and suppresses Th17 responses. The present findings demonstrate for the first time, to our knowledge, that SIRT1 promotes an anti-inflammatory environment in EAE.
A growing body of evidence supports the notion that neurologic dysfunction in MS occurs as a result of axonal degeneration (60,61) which may be dependent on or occur independently of chronic demyelination (62). SMI-32 staining identified numerous nonphosphorylated neurofilaments, indicating the presence of axons (63). We found evidence of axonal protection in SIRT1 animals compared with WT animals following EAE induction, which indicates the axonal protection capacity of SIRT1 protein. Considerable insight into the role of apoptosis in MS has been obtained by using its animal model (EAE). Experiments using the EAE model have revealed that both infiltrating lymphocytes and CNS resident cells die following an apoptotic pathway, thereby contributing to axonal injury as well as the resolution of inflammation. Our immunolabeling analysis (TUNEL positive cells) of DNA fragmentation, and cleaved-caspase-3 positive cells reveal that apoptotic cells are present in the spinal cord of WT EAE animals, whereas SIRT1 animals exhibit a dramatic reduction in the frequency of apoptotic cell death that can be correlated with neuronal protection. MOG35-55 peptide immunization results in more severe axonal damage, increased number of apoptotic OLs and a reduction in proliferating OPCs compared to wild-type mice (64).
One limitation in our experimental design is that we are not able to identify the phenotype of the apoptotic cells as infiltrated lymphocytes or neuronal cells. In this context, first, the variety of apoptotic mechanisms in combination with their often opposing effects on the disease course highlights the need for a detailed understanding of apoptosis. Secondly, because SIRT1 has antiapoptotic activity (65,66,67), it will be interesting to determine the antiapoptotic mechanism of SIRT1 in this model system. The tumor suppressor gene p53 can be deacetylated by SIRT1, thereby inhibiting p53-mediated apoptosis. Actually SIRT1 is a key regulator of cellular defenses and survival in response to stress (24,68). SIRT1 is expressed in the brain, where it is upregulated in mouse models of Alzheimer’s disease and amyotrophic lateral sclerosis. This is thought to be a neuroprotective adaptational response (69), because upregulation of SIRT1 can protect neurons against neurodegeneration and neurotoxic insults (24,69). Recently, we reported (32) that EAE could augment cellular stress which indirectly increases expression of SIRT1, as an adaptive response to provide protection against neurodegeneration.
Earlier, we reported that BDNF can stimulate this anti-inflammatory and neuroprotectional microenvironment(31). Interestingly, having demonstrated that stem cell–mediated delivery of BDNF protects against apoptotic cell death in the CNS of EAE animals (70) and other neuronal system (71,72), we have detected increased expression of BDNF in the SIRT1 spinal cord compared with WT spinal cords. Earlier it was reported that SIRT1 overexpression stimulates BDNF transcription (73). Jeong et.al 2011 (74) have reported that overexpression of SIRT1 improved cell survival by increasing BDNF expression levels in Huntington’s disease mice. Jiang et.al 2011 (75) also reported that SIRT1 overexpression improved motor function in an animal model of Huntington’s disease by preventing the decline in BDNF and signalling of TrkB receptor. Lee et.al.2012 showed that Laquinimod treatment increased BDNF levels as a result of inhibited CD3 expression in EAE animals. (76). In our model system we found increased BDNF and decreased CD3 expression indicating that SIRT1 anti-inflammatory activities are involved with BDNF induction. We found increased BDNF expression, as well as increased expression of TrkB and the BDNF-induced gene GAD67, in SIRT1 EAE animals compared with WT EAE animals.
These findings suggest that one of the anti-apoptotic functions of SIRT1 may be involved with the BDNF pathway although further experimental data are needed. Activation of the BDNF pathway by SIRT1 also may help to explain how overexpression of SIRT1 protein in neurons provides anti-inflammation properties. It is proposed that SIRT1 deacetylates and activates transcription co-activator 1 (TORC1) by promoting its dephosphorylation. This allows TORC1 to interact with CREB. The identified key target of TORC1/CREB pathway is transcriptional activity in BDNF transcription (73–75). Chang et al. (77) reported that lowering intracellular NAD levels in cortical neurons inhibits activity-dependent BDNF transcription. We found that overexpression of SIRT1 increased BDNF and Nampt, a key enzyme in NAD biosynthesis. These reports suggest a mechanism involving SIRT1, NAD, and BDNF gene regulation. Thus, both NAD and SIRT1 could play a neuroprotective role in models of MS.
It is important to note that we also found higher Nampt expression in the SIRT1 EAE animals as compared to WT EAE animals. Nampt is the rate-limiting enzyme in mammalian nicotinamide adenine dinucleotide (NAD)(+) biosynthesis and contributes to cell fate decisions. Wang et.al.2011 (78) have reported that Nampt positively modulated NAD(+) levels and thereby controlled SIRT1 activity in an animal model of ischemia. They also reported that Nampt overexpression in local brains reduced the incidence of ischemia-induced cerebral injuries. Although Nampt is known to control SIRT1 activity (42), it remains unknown if SIRT1 regulates Nampt. Although we did not find any significant differences in Nampt expression between normal WT and SIRT1 animals, following EAE induction, we did find a significant increase of Nampt expression between these groups indicating high NAD synthesis. Together, these findings further support the notion that SIRT1 increases BDNF activity, as well as increases NAD levels needed for cell survival. These findings support a neuroprotective role for SIRT1 in mammalian MS disease models and open new avenues for the development of neuroprotective strategies in MS disease.
Taken together, these results suggest that SIRT1 plays a neuroprotective role in EAE and overexpression results in improvement in the neurologic score, axon preservation, and neuronal survival, as well as a decrease in inflammation and myelin loss.
Acknowledgments
Grant Support: This work was supported by grants from:
1. The Veterans Affairs Merit Review Program (NEUC-003008S and NEUC-00508S),
2. The National Multiple Sclerosis Society (RG 4625-A-2),
3. The National Institutes of Health (RR024888), and
4. Bayer Pharmaceuticals (Investigator Sponsored Study NEURO_2009_6).
We would like to thank Anitha Bhadravathi for technical assistance and Valerie Stewart (University of Maryland School of Medicine Transgenic Core Facility) for helping with the generation of transgenic mice.
Abbreviations
- BDNF
brain-derived neurotrophic factor
- CaMKIIa
calcium/calmodulin-dependent kinase IIa
- CaMKIa promoter
pCaMKIIatTA
- EAE
experimental autoimmune encephalomyelitis
- LFB
Luxol Fast Blue
- mito/eYFP
mitochondrial eYFP
- MOG35–55
myelin oligodendrocyte glycoprotein 35–55
- MS
multiple sclerosis
- Nampt
nicotinamide phosphoribosyltransferase
- OL
oligodendrocyte
- SIRT1
sirtuin 1
- TORC1
transcription coactivator 1
- TRE
tetracycline-responsive element
- tTA
tetracycline-controlled transactivator protein
- WT
wild type
References
- 1.Noseworthy JH, Lucchinetti C, Rodriguez M, Weinshenker BG. Multiple sclerosis. N Engl J Med. 2000;343:938–952. doi: 10.1056/NEJM200009283431307. [DOI] [PubMed] [Google Scholar]
- 2.Losseff NA, Webb SL, O’Riordan JI, Page R, Wang L, Barker GJ, Tofts PS, McDonald WI, Miller DH, Thompson AJ. Spinal cord atrophy and disability in multiple sclerosis: a new reproducible and sensitive MRI method with potential to monitor disease progression. Brain. 1996;119:701–708. doi: 10.1093/brain/119.3.701. [DOI] [PubMed] [Google Scholar]
- 3.Trapp BD, Peterson J, Ransohoff RM, Rudick R, Mork S, Bo L. Axonal transection in the lesions of multiple sclerosis. N Engl J Med. 1998;338:278–285. doi: 10.1056/NEJM199801293380502. [DOI] [PubMed] [Google Scholar]
- 4.Fisher JB, Jacobs DA, Markowitz CE, Galetta SL, Volpe NJ, Nano-Schiavi ML, Baier ML, Frohman EM, Winslow H, Frohman TC, Calabresi PA, Maguire MG, Cutter GR, Balcer LJ. Relation of visual function to retinal nerve fiber layer thickness in multiple sclerosis. Ophthalmology. 2006;113:324–332. doi: 10.1016/j.ophtha.2005.10.040. [DOI] [PubMed] [Google Scholar]
- 5.Gold R, Linington C, Lassmann H. Understanding pathogenesisand therapy of multiple sclerosis via animal models: 70 years of merits and culprits in experimental autoimmune encephalomyelitis research. Brain. 2006;129:1953–1971. doi: 10.1093/brain/awl075. [DOI] [PubMed] [Google Scholar]
- 6.Hohlfeld R, Wekerle H. Immunological update on multiple sclerosis. Curr Opin Neurol. 2001;14:299–304. doi: 10.1097/00019052-200106000-00006. [DOI] [PubMed] [Google Scholar]
- 7.Sawcer S, Hellenthal G, Pirinen M, Spencer CC, Patsopoulos NA, Moutsianas L. Genetic risk and a primary role for cell-mediated immune mechanisms in multiple sclerosis. Nature. 2011;476:214–219. doi: 10.1038/nature10251. [DOI] [PMC free article] [PubMed] [Google Scholar]
- 8.Weiner HL, Hafler DA, Fallis RJ, Johnson D, Ault KA, Hauser SL. T cell subsets in patients with multiple sclerosis. An overview. Ann N Y Acad Sci. 1984;436:281–293. doi: 10.1111/j.1749-6632.1984.tb14800.x. [DOI] [PubMed] [Google Scholar]
- 9.Lock C, Hermans G, Pedotti R, Brendolan A, Schadt E, Garren H, Langer-Gould A, Strober S, Cannella B, Allard J, Klonowski P, Austin A, Lad N, Kaminski N, Galli SJ, Oksenberg JR, Raine CS, Heller R, Steinman L. Gene microarray analysis of multiple sclerosis lesions yields new targets validated in autoimmune encephalomyelitis. Nat Med. 2002;8:500–508. doi: 10.1038/nm0502-500. [DOI] [PubMed] [Google Scholar]
- 10.Gran B, Zhang GX, Rostami A. Role of the IL-12/IL-23 system in the regulation of Tcell responses in central nervous system inflammatory demyelination. Crit Rev Immunol. 2004;24:111–128. doi: 10.1615/critrevimmunol.v24.i2.20. [DOI] [PubMed] [Google Scholar]
- 11.Berer K, Wekerle H, Krishnamoorthy G. B cells in spontaneous autoimmune diseases of the central nervous system. Mol Immunol. 2011;48:1332–1337. doi: 10.1016/j.molimm.2010.10.025. [DOI] [PubMed] [Google Scholar]
- 12.El-behi M, Rostami A, Ciric B. Current views on the roles of Th1 and Th17 cells in experimental autoimmune encephalomyelitis. J Neuroimmune Pharmacol. 2010;5:189–197. doi: 10.1007/s11481-009-9188-9. [DOI] [PMC free article] [PubMed] [Google Scholar]
- 13.Lovett-Racke AE, Yang Y, Racke MK. Th1 versus Th17: are T cell cytokines relevant in multiple sclerosis? Biochim Biophys Acta. 2011;1812:246–251. doi: 10.1016/j.bbadis.2010.05.012. [DOI] [PMC free article] [PubMed] [Google Scholar]
- 14.Hagemeier K, Brück W, Kuhlmann T. Multiple sclerosis - remyelination failure as a cause of disease progression. Histol Histopathol. 2012;27:277–87. doi: 10.14670/HH-27.277. [DOI] [PubMed] [Google Scholar]
- 15.Johnson KP, Brooks BR, Cohen JA, Ford CC, Goldstein J, Lisak RP, Myers LW, Panitch HS, Rose JW, Schiffer RB, Vollmer T, Weiner LP, Wolinsky JS. The Copolymer 1 Multiple Sclerosis Study Group Copolymer 1 reduces relapse rate and improves disability in relapsing-remitting multiple sclerosis: results of a phase III multicenter, double-blind, placebo-controlled trial. Neurology. 1995;45:1268–1276. doi: 10.1212/wnl.45.7.1268. [DOI] [PubMed] [Google Scholar]
- 16.Jacobs LD, Cookfair DL, Rudick RA, Herndon RM, Richert JR, Salazar AM, Fischer JS, Goodkin DE, Granger CV, Simon JH, Alam JJ, Bartoszak DM, Bourdette DM, Braiman J, Brownscheidle CM, Coats ME, Cohan SL, Dougherty DS, Kinkel RP, Mass MK, Munschauer FE, III, Priore RL, Pullicino PM, Scherokman BJ, Weinstock-Guttman B, Whitham RH. The Multiple Sclerosis Collaborative Research Group Intramuscular interferon beta-1a for disease progression in relapsing multiple sclerosis. Ann Neurol. 1996;39:285–294. doi: 10.1002/ana.410390304. [DOI] [PubMed] [Google Scholar]
- 17.Hickman SJ, Kapoor R, Jones SJ, Altmann DR, Plant GT, Miller DH. Corticosteroids do not prevent optic nerve atrophy following optic neuritis. J Neurol Neurosurg Psychiatr. 2003;74:1139–1141. doi: 10.1136/jnnp.74.8.1139. [DOI] [PMC free article] [PubMed] [Google Scholar]
- 18.Parry A, Corkill R, Blamire AM, Palace J, Narayanan S, Arnold D, Styles P, Matthews PM. Beta-Interferon treatment does not always slow the progression of axonal injury in multiple sclerosis. J Neurol. 2003;250:171–178. doi: 10.1007/s00415-003-0965-8. [DOI] [PubMed] [Google Scholar]
- 19.Imai S, Armstrong CM, Kaeberlein M, Guarente L. Transcriptional silencing and longevity protein Sir2 is an NAD-dependent histone deacetylase. Nature. 2000;403:795–800. doi: 10.1038/35001622. [DOI] [PubMed] [Google Scholar]
- 20.Guarente L. Sir2 links chromatin silencing, metabolism, and aging. Genes Dev. 2000;14:1021–1026. [PubMed] [Google Scholar]
- 21.Tissenbaum HA, Guarente L. Increased dosage of a sir-2 gene extends lifespan in Caenorhabditis elegans. Nature. 2001;410:227–230. doi: 10.1038/35065638. [DOI] [PubMed] [Google Scholar]
- 22.Rogina B, Helfand SL. Sir2 mediates longevity in the fly through a pathway related to calorie restrictionProc. Natl Acad Sci USA. 2004;101:15998–16003. doi: 10.1073/pnas.0404184101. [DOI] [PMC free article] [PubMed] [Google Scholar]
- 23.Pallas M, Pizarro JG, Gutierrez-Cuesta J, Crespo-Biel N, Alvira D, Tajes M, Yeste-Velasco M, Folch J, Canudas AM, Sureda FX, Ferrer I, Camins A. Modulation of SIRT1 expression in different neurodegenerative models and human pathologies. Neuroscience. 2008;154:1388–1397. doi: 10.1016/j.neuroscience.2008.04.065. [DOI] [PubMed] [Google Scholar]
- 24.Kim D, Nguyen MD, Dobbin MM, Fischer A, Sananbenesi F, Rodgers JT, Delalle I, Baur JA, Sui G, Armour SM, Puigserver P, Sinclair DA, Tsai LH. SIRT1 deacetylase protects against neurodegeneration in models for Alzheimer’s disease and amyotrophic lateral sclerosis. EMBO J. 2007;26:3169–3179. doi: 10.1038/sj.emboj.7601758. [DOI] [PMC free article] [PubMed] [Google Scholar]
- 25.Qin W, Yang T, Ho L, Zhao Z, Wang J, Chen L, Zhao W, Thiyagarajan M, MacGrogan D, Rodgers JT, Puigserver P, Sadoshima J, Deng H, Pedrini S, Gandy S, Sauve AA, Pasinetti GM. Neuronal SIRT1 activation as a novel mechanism underlying the prevention of Alzheimer disease amyloid neuropathology by calorie restriction. J Biol Chem. 2006;281:21745–21754. doi: 10.1074/jbc.M602909200. [DOI] [PubMed] [Google Scholar]
- 26.Shindler KS, Ventura E, Rex TS, Elliott P, Rostami A. SIRT1 activation confers neuroprotection in experimental optic neuritis. Invest Ophthalmol Vis Sci. 2007;48:3602–3609. doi: 10.1167/iovs.07-0131. [DOI] [PMC free article] [PubMed] [Google Scholar]
- 27.Shindler KS, Ventura E, Dutt M, Elliott P, Fitzgerald DC, Rostami A. Oral resveratrol reduces neuronal damage in a model of multiple sclerosis. J Neuroophthalmol. 2010;30:328–339. doi: 10.1097/WNO.0b013e3181f7f833. [DOI] [PMC free article] [PubMed] [Google Scholar]
- 28.Shindler KS, Revere K, Dutt M, Ying GS, Chung DC. In vivo detection of experimental optic neuritis by pupillometry. Exp Eye Res. 2012;100:1–6. doi: 10.1016/j.exer.2012.04.005. [DOI] [PMC free article] [PubMed] [Google Scholar]
- 29.Mayford M, Bach ME, Huang YY, Wang L, Hawkins RD, Kandel ER. Control of memory formation through regulated expression of a CaMKII transgene. Science. 1996;274(5293):1678–1683. doi: 10.1126/science.274.5293.1678. [DOI] [PubMed] [Google Scholar]
- 30.Makar TK, Trisler D, Bever CT, Goolsby JE, Sura KT, Balasubramanian S, Sultana S, Patel N, Ford D, Singh IS, Gupta A, Valenzuela RM, Dhib-Jalbut S. Stem cell based delivery of IFN-beta reduces relapses in experimental autoimmune encephalomyelitis. J Neuroimmunol. 2008;196:67–81. doi: 10.1016/j.jneuroim.2008.02.014. [DOI] [PubMed] [Google Scholar]
- 31.Makar TK, Bever CT, Singh IS, Royal W, Sahu SN, Sura TP, Sultana S, Sura KT, Patel N, Dhib-Jalbut S, Trisler D. Brain-derived neurotrophic factor gene delivery in an animal model of multiple sclerosis using bone marrow stem cells as a vehicle. J Neuroimmunol. 2009;210:40–51. doi: 10.1016/j.jneuroim.2009.02.017. [DOI] [PubMed] [Google Scholar]
- 32.Makar TK, Nimmagadda VK, Patibandla GK, Le T, Judge SI, Trisler D, Bever CT. Use of engineered bone marrow stem cells to deliver brain derived neurotrophic factor under the control of a tetracycline sensitive response element in experimental allergic encephalomyelitis. J Neuroimmunol. 2012 doi: 10.1016/j.jneuroim.2012.07.005. [DOI] [PubMed] [Google Scholar]
- 33.Quinn T, Dutt M, Shindler KS. Optic neuritis and retinal ganglion cell loss in a chronic murine model of multiple sclerosis. Front Neurol. 2011;2:5055. doi: 10.3389/fneur.2011.00050. [DOI] [PMC free article] [PubMed] [Google Scholar]
- 34.Singh NP, V, Hegde L, Hofseth LJ, Nagarkatti M, Nagarkatti P. Resveratrol (trans-3, 5, 4′-trihydroxystilbene) ameliorates experimental allergic encephalomyelitis, primarily via induction of apoptosis in T cells involving activation of aryl hydrocarbon receptor and estrogen receptor. Mol Pharmacol. 2007;72:1508–1521. doi: 10.1124/mol.107.038984. [DOI] [PMC free article] [PubMed] [Google Scholar]
- 35.Yang JS, Xu LY, Xiao BG, Hedlund G, Link H. Laquinimod (ABR-215062) suppresses the development of experimental autoimmune encephalitis, modulates the Th1/Th2 balance and induces the Th3 cytokine TGF-beta in Lewis rats. J Neuroimmunol. 2004;156:3–9. doi: 10.1016/j.jneuroim.2004.02.016. [DOI] [PubMed] [Google Scholar]
- 36.Brunmark CA, Runström A, Ohlsson L, Sparre B, Brodin T, Aström M, Hedlund G. The new orally active immunoregulator laquinimod (ABR-215062) effectively inhibits development and relapses of experimental autoimmune encephalomyelitis. J Neuroimmunol. 2002;130:163–172. doi: 10.1016/s0165-5728(02)00225-4. [DOI] [PubMed] [Google Scholar]
- 37.Wegner C, Stadelmann C, Pförtner R, Raymond E, Feigelson S, Alon R, Timan B, Hayardeny L, Brück W. Laquinimod interferes with migratory capacity of T cells and reduces IL-17 levels, inflammatory demylination and acute axonal damage in mice with experimental autoimmune encephalomyelitis. J Neuroimmunol. 2010;227:133–143. doi: 10.1016/j.jneuroim.2010.07.009. [DOI] [PubMed] [Google Scholar]
- 38.Tolcos M, Bateman E, O’Dowd R, Markwick R, Vrijsen K, Rehn A, Rees S. Intrauterine growth restriction affects the maturation of myelin. Exp Neurol. 2011;232:53–65. doi: 10.1016/j.expneurol.2011.08.002. [DOI] [PubMed] [Google Scholar]
- 39.Davis H, Guo X, Lambert S, Stancescu M, Hickman JJ. Small Molecule Induction of Human Umbilical Stem Cells into MBP-positive Oligodendrocytes in a Defined Three-Dimensional Environment. ACS Chem Neurosci. 2012;3:31–39. doi: 10.1021/cn200082q. [DOI] [PMC free article] [PubMed] [Google Scholar]
- 40.Tanno M, Sakamoto J, Miura T, Shimamoto K, Horio Y. Nucleocytoplasmic shuttling of the NAD?-dependent histonedeacetylase SIRT1. J Biol Chem. 2007;282:6823–6832. doi: 10.1074/jbc.M609554200. [DOI] [PubMed] [Google Scholar]
- 41.Li Y, Xu W, McBurney MW, Longo VD. Sirt1 inhibition reduces IGF-I/IRS-2/Ras/ERK1/2 signaling and protects neurons. Cell Metab. 2008;8:38–48. doi: 10.1016/j.cmet.2008.05.004. [DOI] [PMC free article] [PubMed] [Google Scholar]
- 42.Revollo JR, Grimm AA, Imai S. The NAD biosynthesis pathway mediated by nicotinamide phosphoribosyltransferase regulates Sir2 activity in mammalian cells. J Biol Chem. 2004;279:50754–50763. doi: 10.1074/jbc.M408388200. [DOI] [PubMed] [Google Scholar]
- 43.Linker RA, Lee DH, Demir S. Functional role of brain-derived neurotrophic factor in neuroprotective autoimmunity: therapeutic implications in a model of multiple sclerosis. Brain. 2010;133:2248–2263. doi: 10.1093/brain/awq179. [DOI] [PubMed] [Google Scholar]
- 44.Michael GJ, Averill S, Nitkunan A, Rattray M, Bennett DL, Yan Q, Priestley JV. Nerve growth factor treatment increases brain-derived neurotrophic factor selectively in TrkA-expressing dorsal root ganglion cells and in their central terminations within the spinal cord. J Neurosci. 1997;17(21):8476–90. doi: 10.1523/JNEUROSCI.17-21-08476.1997. [DOI] [PMC free article] [PubMed] [Google Scholar]
- 45.Janardhan V, Bakshi R. Quality of life in patients with multiple sclerosis: the impact of fatigue and depression. J Neurol Sci. 2002;205:51–8. doi: 10.1016/s0022-510x(02)00312-x. [DOI] [PubMed] [Google Scholar]
- 46.Mostert JP, Admiraal-Behloul F, Hoogduin JM, Luyendijk J, Heersema DJ. Effects of fluoxetine on disease activity in relapsing multiple sclerosis: a double-blind, placebo-controlled, exploratory study. J Neurol Neurosurg Psychiatry. 2008;79:1027–31. doi: 10.1136/jnnp.2007.139345. [DOI] [PubMed] [Google Scholar]
- 47.Kerns D, Vong GS, Barley K, Dracheva S, Katsel P. Gene expression abnormalities and oligodendrocyte deficits in the internal capsule in schizophrenia. Schizophr Res. 2010;120:150–8. doi: 10.1016/j.schres.2010.04.012. [DOI] [PubMed] [Google Scholar]
- 48.Aston C, Jiang L, Sokolov BP. Transcriptional profiling reveals evidence for signaling and oligodendroglial abnormalities in the temporal cortex from patients with major depressive disorder. Mol Psychiatry. 2005;10:309–22. doi: 10.1038/sj.mp.4001565. [DOI] [PubMed] [Google Scholar]
- 49.Konradi C, Sillivan SE, Clay HB. Mitochondria, oligodendrocytes and inflammation in bipolar disorder: evidence from transcriptome studies points to intriguing parallels with multiple sclerosis. Neurobiol Dis. 2012;45:37–47. doi: 10.1016/j.nbd.2011.01.025. [DOI] [PMC free article] [PubMed] [Google Scholar]
- 50.Kong S, McBurney MW, Fang D. Sirtunin 1 in immune regulation and autoimmunity. Immunol Cell Biol. 2012;90:6–13. doi: 10.1038/icb.2011.102. [DOI] [PubMed] [Google Scholar]
- 51.Li P, Zhao Y, Wu X, Xia M, Fang M, Iwasaki Y, Sha J, Chen Q, Xu Y, Shen A. Interferon gamma (IFN-γ) disrupts energy expenditure and metabolic homeostasis by suppressing SIRT1 transcription. Nucleic Acids Res. 2012;40(4):1609–20. doi: 10.1093/nar/gkr984. [DOI] [PMC free article] [PubMed] [Google Scholar]
- 52.Park YD, Kim YS, Jung YM, Lee SI, Lee YM, Bang JB, Kim EC. Porphyromonas gingivalis lipopolysaccharide regulates interleukin (IL)-17 and IL-23 expression via SIRT1 modulation in human periodontal ligament cells. Cytokine. 2012 Oct;60(1):284–93. doi: 10.1016/j.cyto.2012.05.021. [DOI] [PubMed] [Google Scholar]
- 53.Kim SR, Lee KS, Park SJ, Min KH, Choe YH, Moon H, Yoo WH, Chae HJ, Han MK, Lee YC. Involvement of sirtuin 1 in airway inflammation and hyperresponsiveness of allergic airway disease. J Allergy Clin Immunol. 2010;125:449–460. doi: 10.1016/j.jaci.2009.08.009. [DOI] [PubMed] [Google Scholar]
- 54.Yeung F, Hoberg JE, Ramsey CS, Keller MD, Jones DR, Frye RA, Mayo MW. Modulation of NF-kappaB-dependent transcription and cell survival by the SIRT1 deacetylase. EMBO J. 2004;23:2369–2380. doi: 10.1038/sj.emboj.7600244. [DOI] [PMC free article] [PubMed] [Google Scholar]
- 55.Yang SR, Wright J, Bauter M, Seweryniak K, Kode A, Rahman I. Sirtuin regulates cigarette smoke-induced proinflammatory mediator release via RelA/p65 NF-κB in macrophages in vitro and in rat lungs in vivo: implications for chronic inflammation and aging. Am J Physiol Lung Cell Mol Physiol. 2007;292:L567–L576. doi: 10.1152/ajplung.00308.2006. [DOI] [PubMed] [Google Scholar]
- 56.Gao Z, Ye J. Inhibition of transcriptional activity of c-JUN by SIRT1. Biochem Biophys Res Commun. 2008;376:793–796. doi: 10.1016/j.bbrc.2008.09.079. [DOI] [PMC free article] [PubMed] [Google Scholar]
- 57.Rajendrasozhan S, Yang SR, Kinnula VL, Rahman I. SIRT1, an antiinflammatory and antiaging protein, is decreased in lungs of patients with chronic obstructive pulmonary disease. Am J Respir Crit Care Med. 2008;177:861–870. doi: 10.1164/rccm.200708-1269OC. [DOI] [PMC free article] [PubMed] [Google Scholar]
- 58.Yoshizaki T, Milne JC, Imamura T, Schenk S, Sonoda N, Babendure JL, Lu JC, Smith JJ, Jirousek MR, Olefsky JM. SIRT1 exerts anti-inflammatory effects and improves insulin sensitivity in adipocytes. Mol Cell Biol. 2009;29:1363–1374. doi: 10.1128/MCB.00705-08. [DOI] [PMC free article] [PubMed] [Google Scholar]
- 59.Legutko A, Marichal T, Fiévez L, Bedoret D, Mayer A, de Vries H, Klotz L, Drion PV, Heirman C, Cataldo D, Louis R, Thielemans K, Andris F, Leo O, Lekeux P, Desmet CJ, Bureau F. Sirtuin 1 promotes Th2 responses and airway allergy by repressing peroxisome proliferator-activated receptor-γ activity in dendritic cells. J Immunol. 2011;187(9):4517–29. doi: 10.4049/jimmunol.1101493. [DOI] [PubMed] [Google Scholar]
- 60.Budde MD, Kim JH, Liang H-F, Russell JH, Cross AH, Song S-K. Axonal injury detected by in vivo diffusion tensor imaging correlates with neurological disability in a mouse model of multiple sclerosis. NMR in Biomedicine. 2008;21:589–597. doi: 10.1002/nbm.1229. [DOI] [PMC free article] [PubMed] [Google Scholar]
- 61.Budde MD, Xie M, Cross AH, Song SK. Axial diffusivity is the primary correlate of axonal injury in the experimental autoimmune encephalomyelitis spinal cord: a quantitative pixelwise analysis. J Neurosci. 2009;29:2805–13. doi: 10.1523/JNEUROSCI.4605-08.2009. [DOI] [PMC free article] [PubMed] [Google Scholar]
- 62.Dandekar AA, Wu GF, Pewe L, Perlman S. Axonal Damage Is T Cell Mediated and Occurs Concomitantly with Demyelination in Mice Infected with a Neurotropic Coronavirus. J Virol. 2001;75:6115–6120. doi: 10.1128/JVI.75.13.6115-6120.2001. [DOI] [PMC free article] [PubMed] [Google Scholar]
- 63.Lee V, Carden M, Schlaepfer W, Trojanowski J. Monoclonal antibodies distinguish several differentially phosphorylated states of the two largest rat neurofilament subunits (NF-H and NF-M) and demonstrate their existence in the normal nervous system of adult rats. The Journal of Neuroscience. 1987;7:3474–3488. doi: 10.1523/JNEUROSCI.07-11-03474.1987. [DOI] [PMC free article] [PubMed] [Google Scholar]
- 64.Linker RA, Mäurer M, Gaupp S, Martini R, Holtmann B, Giess R, Rieckmann P, Lassmann H, Toyka KV, Sendtner M, Gold R. CNTF is a major protective factor in demyelinating CNS disease: a neurotrophic cytokine as modulator in neuroinflammation. Nat Med. 2002;8:620–6244. doi: 10.1038/nm0602-620. [DOI] [PubMed] [Google Scholar]
- 65.Luo J, Nikolaev AY, Imai S, Chen D, Su F, Shiloh A, Guarente L, Gu W. Negative control of p53 by Sir2alpha promotes cell survival under stress. Cell. 2001;107:137–148. doi: 10.1016/s0092-8674(01)00524-4. [DOI] [PubMed] [Google Scholar]
- 66.Vaziri H, Dessain SK, Eaton ENg, Imai SI, Frye RA, Pandita TK, Guarente L, Weinbergh RA. SIR2(SIRT1) functions as an NAD-dependent p53 deacetylase. Cell. 2001;107:149–159. doi: 10.1016/s0092-8674(01)00527-x. [DOI] [PubMed] [Google Scholar]
- 67.Cohen HY, Miller C, Bitterman KJ, Wall NR, Hekking B, Kessler B, Howitz KT, Gorospe M, de Cabo R, Sinclair DA. Calorie restriction promotes mammalian cell survival by inducing the SIRT1 deacetylase. Science. 2004;305:390–392. doi: 10.1126/science.1099196. [DOI] [PubMed] [Google Scholar]
- 68.Brunet A, Sweeney LB, Sturgill JF, Chua KF, Greer PL, Lin Y, Tran H, Ross SE, Mostoslavsky R, Cohen HY, Hu LS, Cheng HL, Jedrychowski MP, Gygi SP, Sinclair DA, Alt FW, Greenberg ME. Stress-dependent regulation of FOXO transcription factors by the SIRT1 deacetylase. Science. 2004;303:2011–2015. doi: 10.1126/science.1094637. [DOI] [PubMed] [Google Scholar]
- 69.Chen J, Zhou Y, Mueller-Steiner S, Chen LF, Kwon H, Yi S, Mucke L, Gan L. SIRT1 protects against microglia-dependent amyloid-beta toxicity through inhibiting NF-kappaB signaling. J Biol Chem. 2005;280:40364–40374. doi: 10.1074/jbc.M509329200. [DOI] [PubMed] [Google Scholar]
- 70.Makar TK, Trisler D, Sura TK, Sultana S, Patel N, Bever CT. Brain derived neurotrophic factor treatment reduces inflammation and apoptosis in experimental allergic encephalomyelitis. J Neurol Sci. 2008;15;270(1–2):70–6. doi: 10.1016/j.jns.2008.02.011. [DOI] [PubMed] [Google Scholar]
- 71.Uchida K, Nakajima H, Hirai T, Yayama T, Chen K, Guerrero AR, Johnson WE, Baba H. The Retrograde Delivery of Adenovirus Vector Carrying the Gene for Brain-derived Neurotrophic Factor Protects Neurons and Oligodendrocytes from Apoptosis in the Chronically Compressed Spinal Cord of Twy/twy Mice. Spine. 2012 doi: 10.1097/BRS.0b013e3182600ef7. [DOI] [PubMed] [Google Scholar]
- 72.Steinkamp M, Schulte N, Spaniol U, Pflüger C, Hartmann C, Kirsch J, von Boyen GB. Brain derived neurotrophic factor inhibits apoptosis in enteric glia during gut inflammation. Med Sci Monit. 2012;18(4):BR117–22. doi: 10.12659/MSM.882612. [DOI] [PMC free article] [PubMed] [Google Scholar]
- 73.Zocchi L, Sassone-Corsi P. SIRT1-mediated deacetylation of MeCP2 contributes to BDNF expression. Epigenetics. 2012;7(7):695–700. doi: 10.4161/epi.20733. [DOI] [PMC free article] [PubMed] [Google Scholar]
- 74.Jeong H, Cohen DE, Cui L, Supinski A, Savas JN, Mazzulli JR, Yates JR, Bordone L, Guarente L, Krainc D. Sirt1 mediates neuroprotection from mutant huntingtin by activation of the TORC1 and CREB transcriptional pathway. Nat Med. 2011;18(1):159–65. doi: 10.1038/nm.2559. [DOI] [PMC free article] [PubMed] [Google Scholar]
- 75.Jiang M, Wang J, Fu J, Du L, Jeong H, West T, Xiang L, Peng Q, Hou Z, Cai H, Seredenina T, Arbez N, Zhu S, Sommers K, Qian J, Zhang J, Mori S, Yang XW, Tamashiro KL, Aja S, Moran TH, Luthi-Carter R, Martin B, Maudsley S, Mattson MP, Cichewicz RH, Ross CA, Holtzman DM, Krainc D, Duan W. Neuroprotective role of Sirt1 in mammalian models of Huntington’s disease through activation of multiple Sirt1 targets. Nat Med. 2011;18(1):153–8. doi: 10.1038/nm.2558. [DOI] [PMC free article] [PubMed] [Google Scholar]
- 76.Lee DH, Geyer E, Flach AC, Jung K, Gold R, Flügel A, Linker RA, Lühder F. Central nervous system rather than immune cell-derived BDNF mediates axonal protective effects early in autoimmune demyelination. Acta Neuropathol. 2012;123(2):247–58. doi: 10.1007/s00401-011-0890-3. [DOI] [PMC free article] [PubMed] [Google Scholar]
- 77.Chang J, Zhang B, Heath H, Galjart N, Wang X, Milbrandt J. Nicotinamide adenine dinucleotide (NAD)-regulated DNA methylation alters CCCTC-binding factor (CTCF)/cohesinbinding and transcription at the BDNF locus. Proc Natl Acad Sci U S A. 2010;107(50):21836–41. doi: 10.1073/pnas.1002130107. [DOI] [PMC free article] [PubMed] [Google Scholar]
- 78.Wang P, Xu TY, Guan YF, Tian WW, Viollet B, Rui YC, Zhai QW, Su DF, Miao CY. Nicotinamide phosphoribosyltransferase protects against ischemic stroke through SIRT1-dependent adenosine monophosphate-activated kinase pathway. Ann Neurol. 2011;69(2):360–74. doi: 10.1002/ana.22236. [DOI] [PubMed] [Google Scholar]