Abstract
Gene point mutations present important biomarkers for genetic diseases. However, existing point mutation detection methods suffer from low sensitivity, specificity, and tedious assay processes. In this report, we propose an assay technology which combines the outstanding specificity of gap ligase chain reaction (Gap-LCR), the high sensitivity of single molecule coincidence detection and superior optical properties of quantum dots (QDs) for multiplexed detection of point mutations in genomic DNA. Mutant-specific ligation products are generated by Gap-LCR and subsequently captured by QDs to form DNA-QD nanocomplexes that are detected by single molecule spectroscopy (SMS) through multi-color fluorescence burst coincidence analysis, allowing for multiplexed mutation detection in a separation-free format. The proposed assay is capable of detecting zeptomoles of KRAS codon 12 mutation variants with near 100% specificity. Its high sensitivity allows direct detection of KRAS mutation in crude genomic DNA without PCR pre-amplification.
Keywords: Single molecule spectroscopy, Diagnostics, Quantum dots, Biosensors, Gap ligase chain reaction
1. Introduction
DNA single nucleotide substitutions, also known as point mutations, are abnormalities widely found in genomic DNA of various types of cancers. For example, point mutations discovered in KRAS genes are closely associated with lung cancer, colorectal cancer, ovarian cancer, and other cancer types.[1] They are therefore valuable genetic markers for cancer diagnostics and prognostics,[2-5] as well as important predictors of patients’ resistance to specific cancer therapies.[6-8] Currently, the majority of point mutation detection techniques rely on PCR amplification of target sequences from crude genomic DNA samples. Although highly sensitive, PCR based methods are complicated by amplification errors due to mispriming, limited accuracy of discriminating single nucleotide variations, and limited multiplexing capability.[9-13]
Although a number of alternative PCR-free methods, such as the Invader assay[14] and rolling circle amplification,[15] have been introduced, ligation-based techniques remain the most widely used for point mutation detection due to their exceptional specificity on base discrimination and robust multiplexing capabilities.[16] A number of variations of ligation assays have been proposed for point mutation detection. Ligase detection reaction (LDR)[17-20] employs a set of primers to sense the mutation. Only if the primers fully complement the target sequence containing the mutation of interest does the ligase join the two primers together to form ligation products which are then detected using gel electrophoresis or FRET-based approaches.[21-23] Although it is highly specific in base recognition, LDR has very limited sensitivity. Consequently, LDR is usually combined with PCR that exponentially amplifies the ligation product to a detectable level. The combined PCR-LDR process significantly improves the assay sensitivity but suffers from the complications of PCR. Ligase chain reaction (LCR)[24-27] has been introduced to enhance the sensitivity of mutation detection by ligation. Instead of using one pair of primers in the case of LDR, LCR uses two pairs of primers to flank both the sense and the antisense strands of DNA targets, generating ligation products that in turn serve as templates for ligation reaction of the next cycle. As a result, the mutation can be easily detected through exponentially amplified ligation products even with gel electrophoresis.[28] Despite high sensitivity, LCR has not been widely adopted for mutation detection. The primers used in LCR would inevitably form primer dimers with blunt ends, which tend to cause false positives due to blunt-end ligation.[29] An improved version of LCR known as Gap-LCR bypasses the blunt-end ligation by introducing a “gap” between the primers hybridized to the target template.[30,31] The primers are intentionally designed to form dimers with sticky-ends, thereby eliminating the problem of blunt-end ligation. After filling the gap by DNA polymerase, DNA ligase can seal the nick between primers and generate an allele-specific ligation product. Previous research results suggest that Gap-LCR and allele-specific PCR have similar sensitivity, but Gap-LCR generates less false positives than allele-specific PCR when presented with mismatch targets. Gap-LCR achieves this increased specificity by the dual layering of ligase based mismatch discrimination on top of polymerase discrimination.[30] However, most of the ligation-based assays including Gap-LCR rely on cumbersome separation techniques such as gel electrophoresis or solid phase-based purification.[32-34] Such labor-intensive protocols seriously hinder their applications in routine medical diagnostics procedures.
Although Taqman probes[35-38] or molecular beacons[39,40] combined with PCR have enabled separation-free detection of DNA targets in solutions, incomplete quenching of free probes often leads to high fluorescence background and low signal-to-noise ratio.[41] Alternatively, the advancement of single molecule spectroscopy (SMS) and single molecule probe strategies facilitate homogeneous, separation-free detection with high sensitivity.[42-52] As opposed to conventional ensemble detection methods that measure averaged fluorescence from the entire analyte population, SMS measures fluorescent bursts emitted from individual molecules as they pass through a femtoliter-sized laser detection volume. In SMS, background fluorescence from out-of-focus molecules and scattered light are minimized by a pinhole incorporated to the confocal design. Single molecule coincidence detection[53] is a SMS-enabled approach for sequence-specific detection of single DNA molecules. It employs two differently labeled oligonucleotide probes to search for a specific DNA target. Presence of the target can be determined by coincident fluorescence bursts emitted from the two probes bound to the same target as the probes-target hybrid passes the detection volume of SMS. This strategy permits direct detection of molecular bindings in a solution without the need for separation of free probes from targets. This fluorescence burst coincidence detection method has been successfully applied to detection of specific DNA sequences,[53-55] DNA methylation,[56] or microRNA expression.[57]
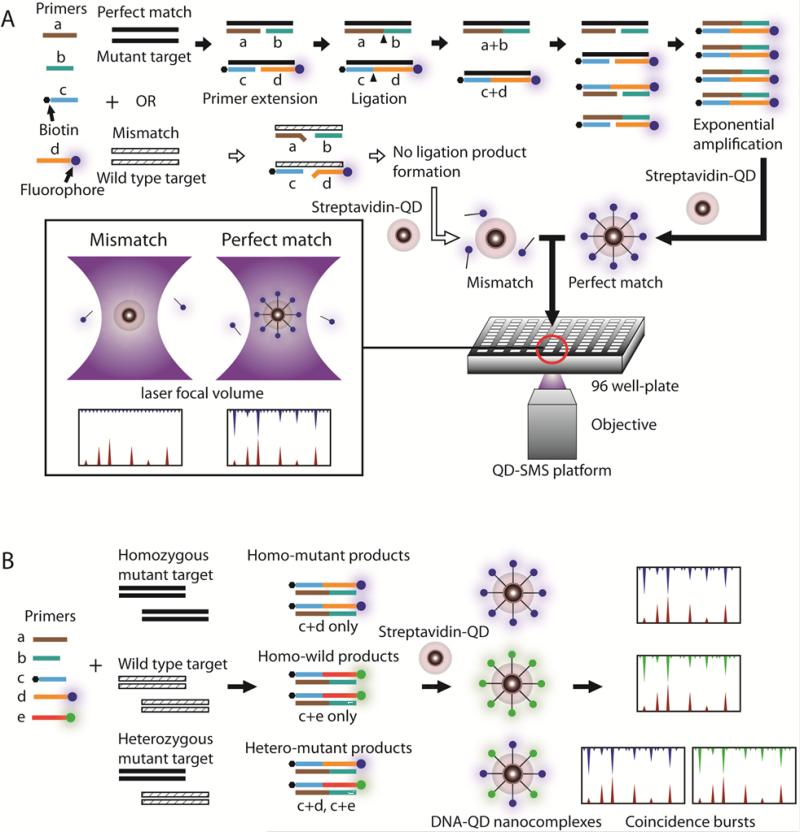
In this report, we introduce a single QD-based multiplexed coincident fluorescence detection method for PCR-free and separation-free detection of point mutations in genomic DNA. The method employs Gap-LCR for multiplexed enzymatic reactions to generate mutation-specific ligation products that are detected by SMS, through single-dot multi-color fluorescence coincidence analysis, without the need for PCR and molecular separation. In this method, dye-labeled probes are first used for generation of mutation-specific ligation products from genomic DNA templates. Then the ligation products are captured by QDs through biotin-streptavidin binding to form DNA-QD nanocomplexes. Upon illumination, the nanocomplex emits a unique single-dot coincident fluorescence signal that is detected by SMS (Figure 1A). By performing multiplexed Gap-LCR with multiple sets of differently labeled primers, mutation variants can be determined by specific patterns of coincident signals measured by multi-color SMS (Figure 1B). QDs serve as both a high intensity fluorescent label and a nanoconcentrator to capture multiple dye-conjugated ligation products for signal amplification, which facilitates highly accurate detection of coincident fluorescence events. We have demonstrated the method to detect mutations on codon 12 of the KRAS gene in human fibroblast and Panc-1 pancreatic cancer cell lines, respectively. The assay has demonstrated exceptional sensitivity, capable of detecting zeptomoles of targets.
Figure 1.
Schematic drawing of the point mutation detection assay. (A) The mutant-specific primer is labeled with a fluorophore and a common primer is labeled with biotin. In case of a perfect match (flow illustrated by black arrows), primers hybridize to the mutant target template (black strand) with a gap in-between. The polymerase fills the gap and then the nick (black triangle) is sealed by the ligase. The ligation product serves as a target template in the next cycle of the thermal cycling, leading to exponential increase of target template. After Gap-LCR reaction, streptavidin-coated QDs are introduced to form DNA-QD nanocomples, which give rise to coincident fluorescence bursts when analyzed in single molecule coincidence detection platform. In case of a mismatch (flow illustrated by white arrows), the primers do not hybridize stably to wild type target templates (striped strand). As a result, no ligation product is formed and captured by QD, as evidenced by absence of coincident fluorescence bursts. (B) Multiplexed detection of homozygous mutant, wild type and heterozygous mutant. Mutant and wild type-specific primers are introduced simultaneously. The presence of mutant is evidenced as coincident fluorescence burst from Alexa488 (blue) and QD (red) channel. Similarly, presence of wild type target is evidenced as coincident fluorescence burst from Alexa546 (green) and QD (red) channel.
2. Results
2.1. Assay Principles
In the assay, the DNA sample is first subjected to Gap-LCR and then is detected by the coincidence detection platform (Figure 1A). In Gap-LCR, polymerase extends primers only if primers form a perfect match to target templates. Following primer extension, the ligase is introduced to join the primers into ligation products. A set of four primers (two pairs of complementary primers) is used to allow chain reaction. The primer annealing, gap filling and ligation processes are then repeated through thermal cycling in order to exponentially amplify the target. In contrast, the polymerase is not able to elongate the primer to fill the gap if primers and target template form mismatch hybridization. Consequently, no ligation product is formed in the case of mismatch. Since one of the primers is labeled with biotin and another labeled with fluorophore, ligation products which are generated by Gap-LCR are labeled with both a biotin and a fluorophore. Such ligation products are captured by streptavidinfunctionalized QDs to form DNA-QD nanocomplexes that are subsequently analyzed using coincidence detection. In the coincidence detection platform, the laser beam is focused into a femtoliter-sized volume from where fluorescence signals are collected. When a DNA-QD nanocomplex diffuses into the laser focal volume of the SMS platform, both QD and the fluorophore labeled on the ligation products are excited, emitting a coincident fluorescence burst that indicates the presence of target template of interest. A pinhole placed in front of the detectors is used to reject fluorescence emitted by out-of-focus molecules, allowing high signal-to-noise ratio detection and preventing detection of false-positives (Figure S1).
In order for multiplexed detection of single nucleotide polymorphisms, a set of five primers that include three common primers and two variant-specific primers (Table 1) are used to simultaneously detect mutant and wild type target (Figure 1B). Mutant-specific and wild type-specific primers are labeled with different species of fluorophores. Depending on the genotype of target template (homozygous mutant, wild type or heterozygous mutant), DNA-QD nanocomplexes of different color-combinations are generated and are detected using the coincidence detection platform.
Table 1.
Oligonucleotide used in the assay.
| Code | Description | Sequence (5' to 3') |
|---|---|---|
| KAS | A segment in mutant type KRAS codon 12 gene sense strand (GGT → GAT) | AAT ATA AAC TTG TGG TAG TTG GAG CTG ATG GCG TAG GCA AGA GTG CCT |
| KAA | A segment in mutant type KRAS codon 12 gene anti-sense strand (Complementary to KAS) | AGG CAC TCT TGC CTA CGC CAT CAG CTC CAA CTA CCA CAA GTT TAT ATT |
| KGS | A segment in wild type KRAS codon 12 gene sense strand | AAT ATA AAC TTG TGG TAG TTG GAG CTG GTG GCG TAG GCA AGA GTG CCT |
| KGA | A segment in wild type KRAS codon 12 gene anti-sense strand (Complementary to KGS) | AGG CAC TCT TGC CTA CGC CAC CAG CTC CAA CTA CCA CAA GTT TAT ATT |
| Apr | Alexa488 labeled discrimination primer for GGT → GAT mutant KRAS detection | A488-CAC TCT TGC CTA CGC CAT C |
| Gpr | Alexa546 labeled discrimination primer for wild type KRAS detection | A546- CAC TCT TGC CTA CGC CAC C |
| Cpr1 | Common primer 1 labeled with phosphate and biotin | p CTC CAA CTA CCA CAA GTT TAT ATT-Biotin |
| Cpr2 | Common primer 2 | AAT ATA AAC TTG TGG TAG TTG GAG CT |
| Cpr3 | Common primer 3 labeled with phosphate | p TGG CGT AGG CAA GAG TG |
2.2. Assay Validation
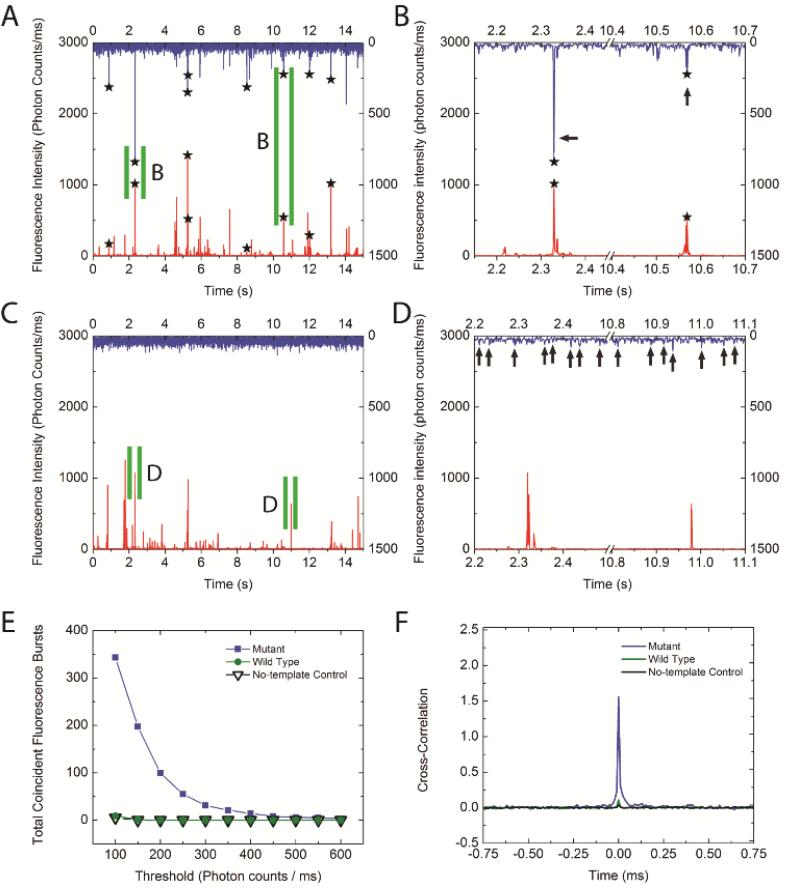
We evaluated our assay by detecting KRAS codon 12 GGT → GAT mutation using the sample containing mutant targets. Four primers including mutant-specific primer Apr and common primers Cpr1-3 were used. Apr and Cpr1 were labeled with Alexa488 and biotin, respectively (Table 1). Ligation products were generated by Gap-LCR and were captured by QDs. As a result, coincident fluorescence bursts were observed in both QD and Alexa488 optical channels (marked by stars), indicating the presence of DNA-QD nanocomplexes (Figure 2A, B). In the case of mismatch control, where the sample contained only the wild type KRAS target, no ligation product was generated as evidenced by the absence of coincident fluorescence burst events (Figure 2C, D). As mentioned earlier, QDs resulted in stronger fluorescence bursts due to their high extinction coefficient and quantum yield. In the meantime, the fluorescence burst size of Alexa488 was significantly increased in case of perfect match because QDs brought multiple Alexa488 dyes together to pass through the detection volume at the same time. Therefore, QDs did not only serve as nanosensors that confirmed the presence of ligation products through coincidence detection, but also act as target concentrators that greatly enhanced the signals from labeled fluorophores. The number of coincident events was plotted as a function of the threshold applied to Alexa488 signal (Figure 2E). Since the primers are specific to the KRAS mutant, only the mutant samples exhibited detectable coincident events. The wild type in this case displayed negligible coincident signals. The specificity of the wild type primers was also tested, in which case the coincident events were observed in the wild type but not in the mutant samples (Figure S2).
Figure 2.
Detection of KRAS mutant target. (A) Mutant was detected as evidenced by coincident fluorescence bursts (marked with stars) from Alexa488 (blue) and QD (red) channels. (B) Enlarged view of coincident fluorescence bursts from panel (A). Regions specified with green slits were enlarged. Because each QD captures multiple ligation products, signal from Alexa488 was significantly enhanced (arrows). (C) Mutant-specific primers do not form perfect match with wild type target. Therefore, no coincident fluorescence bursts were observed. (D) Enlarged view of QD fluorescence bursts from panel (C). Arrows indicate unamplified Alexa Fluor488 fluorescence bursts observed from free primers. (E) Coincident fluorescence bursts at various thresholds. (F) Cross-correlation analysis of QD and Alexa488 signals reveals a strong correlation for the mutant but not wild type samples.
In order to further verify the results obtained using coincidence detection, the cross-correlation function[58] G(τ) was calculated based on SMS data of Alexa488 and QD according to
| (1) |
where τ was the lag time, IA488 and IQD were the fluorescent intensities from the Alexa488 channel and the QD channel respectively, and δIA488, δIQD were the deviation of Alexa488 and QD655 intensities from their respective means. As shown in Figure 2F, only the mutant sample exhibited a strong correlation between the signals from Alexa488 and QD as evidenced by the pronounced peak, which suggested that fluorescence bursts were simultaneously detected from both channels as a result of the ligation products being generated and captured by the QDs. In contrast, the wild type showed minimum cross-correlation because the Alexa488 and QDs moved independently through the detection volume in the absence of ligation products.
2.3. Assessment of Analytical Specificity
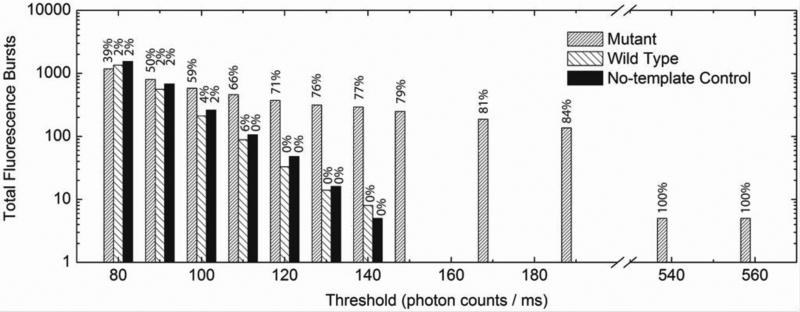
Figure 3 shows the intensity histograms of Alexa488 fluorescence bursts detected from three different samples including mutant, wild type and no-template control. Since ligation was prohibited in the no-template control sample, the detected fluorescence bursts should originate only from the free Alexa488-labeled primers. The free primers exhibited an intensity level of lower than 140 photon counts ms-1 and a similar result was observed in the wild type experiment. In contrast, fluorescence bursts with a much enhanced intensity of 500 photon counts ms-1 or higher were detected in the mutant sample. The percentages of Alexa488 fluorescence bursts that were coincident with QD fluorescence bursts were calculated as also shown in Figure 3. A small number of statistical fluorescence coincident events (2-6%) were counted in both the wild type and the control experiments when using a small intensity threshold. Since QDs serve as a nanoconcentrator to facilitate signal enhancement, a higher threshold can be imposed to achieve effective differentiation of binding-induced coincident signals and the statistical coincident signals, greatly enhancing the specificity and accuracy in mutation detection. In the current experiment, the statistical background coincident signals, which may lead to false positives, can be completely removed when a higher threshold (≥ 120 photon counts ms-1) is used, thereby achieving near 100% specificity. The same conclusion can be drawn for detection of wild type target as shown in Alexa546 intensity histogram (Figure S3).
Figure 3.
Histograms of Alexa488 fluorescence bursts detected from perfect match (mutant sample, shown in densely striped bars), mismatch (wild type sample, shown in sparsely striped bars) and no-template control samples (black bars) in 180 second-measurements. The number above each bar presents the percentage of Alexa488 fluorescence bursts that were coincident with QD fluorescence bursts.
2.4. Assessment of Analytical Sensitivity
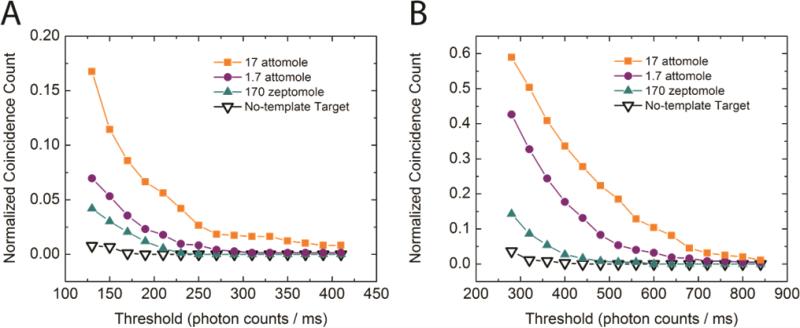
In order to access the sensitivity of the assay, we tested the assay with various amounts of target input (Figure 4). A dilution series from 17 attomole to 170 zeptomole of mutant and the wild type were used as target templates. Instead of the Alexa488-labeled, mutant specific Apr primer, we used wild type specific primer Gpr, which was labeled with Alexa546, to detect the wild type target. As expected, samples with larger amount of target input showed higher coincidence count at any threshold due to larger amount of ligation products generated in the Gap-LCR reaction. Signals from mutant as well as wild type samples with zeptomoles of target input were routinely detected above the background of no-template control, demonstrating excellent sensitivity.
Figure 4.
Detection of serial dilutions of (A) mutant target and (B) wild type target. The normalized coincidence count is defined as the number of coincidence bursts divided by the number of total QD bursts observed within the respective detection period.
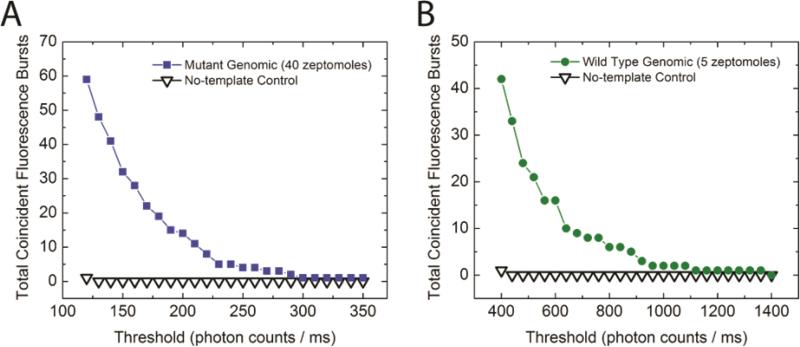
The proposed QD-SMS Gap-LCR assay has been applied for KRAS genotyping in human foreskin fibroblast and pancreatic cancer cell lines (Panc-1). Human foreskin fibroblast carries wild type GGT at KRAS codon 12 while Panc-1 cancer cells carry GGT → GAT mis-sense mutation. DNA was first extracted from the cell lines. Then, the mutant was amplified with mutant-specific primers and the wild type was amplified with wild type-specific primers by Gap-LCR. Compared to no-template control, high coincident counts were observed in positive samples over a wide range of threshold, indicating successful identification of particular genotypes (Figure 5).
Figure 5.
KRAS codon 12 point mutation detection from genomic DNA samples. (A) GGT → GAT mutant detection from genomic DNA extracted from pancreatic cancer cell line (Panc-1). (B) Wild type target detection from genomic DNA extracted from human foreskin fibroblast.
2.5. Multiplexed KRAS Mutation Detection
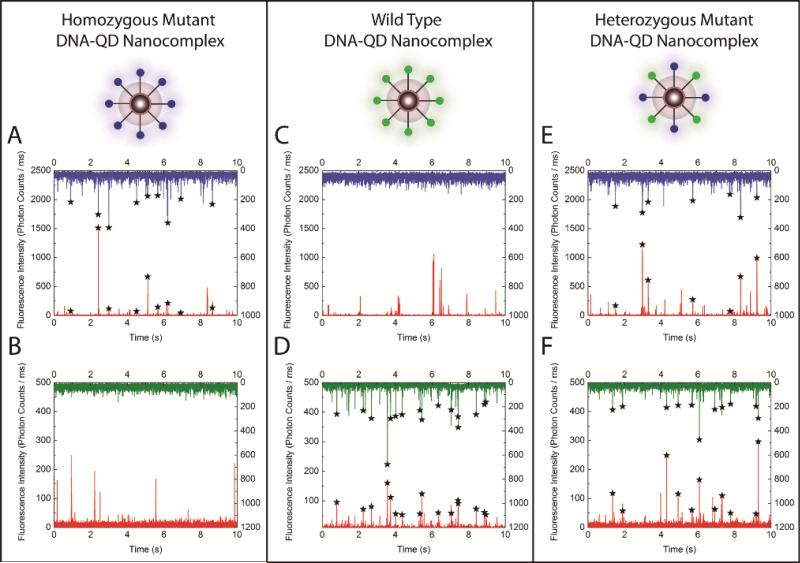
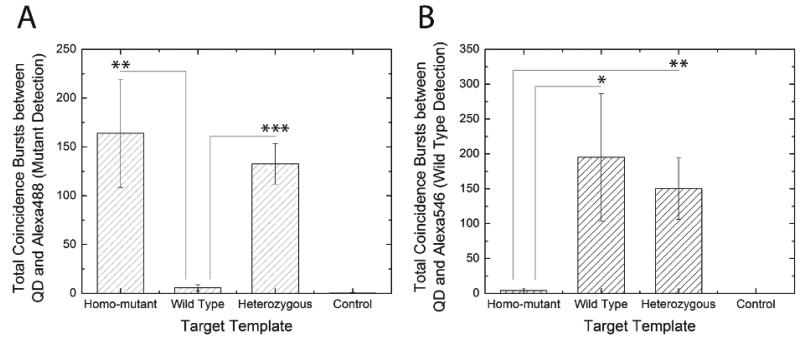
In the QD nano-assay, the high detection specificity and sensitivity complements its multiplexing capability. The assay was able to differentiate between the homogeneous mutant, the heterozygous mutant and the wild type by analyzing the sample using differently labeled mutant specific primers and wild type-specific primers in a single reaction (Figure 1B). The experiment was performed at a ligation temperature of 65.1 °C, optimized for multiplexed ligation reaction for KRAS codon 12 (Supporting Information and Figure S4). Four samples, including homozygous mutant, heterozygous mutant, wild type, and no-template control, were analyzed and coincidence detection was conducted with SMS via two dual-color detection settings (see Materials and Methods). For the homozygous mutant, the coincident events were observed between QD and Alexa488, but not between QD and Alexa546 (Figure 6A and B). In contrast, the coincident events were only observed between QD and Alexa546 but not between QD and Alexa488 in the case of wild type sample (Figure 6C and D). For heterozygous mutant sample, coincident events were observed with both combinations due to the presence of both mutant and wild type alleles (Figure 6E and F). In Figure 7, we also statistically verified that coincidence fluorescence bursts obtained from samples containing perfect match target templates were significantly higher than samples which didn't. As a result, the combination of the coincidence analysis provided unambiguous information for determining the mutational status of the sample under investigation. This demonstrates that the assay is capable of detecting point mutations in a multiplexed manner with high specificity.
Figure 6.
Multiplexed point mutation detection. Coincident fluorescence bursts (marked with starts) from Alexa488 (blue) and QD (red) channels suggest the successful detection of mutant target in homozygous mutant sample (A) and heterozygous mutant sample (E). Coincident fluorescence bursts from Alexa546 (green) and QD (red) channels suggested the successful detection of wild type target in wild type sample (D) and heterozygous mutant sample (F). Coincident Fluorescence bursts were not detected in absence of specific targets (B and C).
Figure 7.
Analysis of multiplexed point mutation detection. The asterisk, double asterisk, and triple asterisk indicate that p-value is less than 0.05, 0.01, and 0.001, respectively, in Student's one-tailed T-test. The error bar indicates standard deviation of three measurements. (A) Detection of mutant target. Only homozygous mutant sample and heterozygous mutant sample showed significant number of coincident fluorescence bursts. (B) Detection of wild type target. Only wild type sample and heterozygous mutant sample showed significant number of coincident fluorescence bursts.
3. Discussion
Herein, we demonstrated a highly sensitive and specific QD nano-assay which reveals genotype of the target biomarker in a multiplexed manner. Our single molecule approach provides significant values over the conventional ensemble measurements. Firstly, perfect match samples with Gap-LCR reaction (leading to labeled ligation product) and those without (leaving behind free labeled primers) result in same ensemble fluorescence intensities. Therefore, conventional ensemble measurements need to rely on an additional separation step such as gel electrophoresis or bead-based purification in order to isolate ligation products from free primers to distinguish signal resulting from ligation products from the background. Alternatively, SMS can be used for the examination of individual molecules in a homogeneous environment. Therefore, ligation products and free primers labeled with the same fluorophore could be easily distinguished from one another using coincidence detection in a separation-free manner, which greatly improves the sensitivity and simplifies the procedures of the assay.
Secondly, multiplexing experiment using multiple species of fluorophores also greatly benefit from a SMS-enabled approach compared to conventional ensemble measurement. While even a minor degree of fluorophores’ emission spectra bleed through from one detection channel to the other might result in false positive detection in ensemble measurements, SMS is capable of circumventing the problem. Conventional fluorescence measurement relies on analog fluorescence acquisition. Therefore, when multiple species of fluorophores are present in the sample, it is difficult decouple the signal obtained from targeted fluorophores and bleed through from other fluorophore species. For instance, we confirmed that there is <5% spectra bleed through of Alexa488 fluorescence signal into Alexa546 channel in ensemble measurement (data not shown). On the other hand, SMS decouples the analog ensemble fluorescence signal into digital signals from individual molecules. Therefore, by setting the threshold, it becomes possible to totally eliminate weak bleed through signals without losing any targeted fluorescence bursts, which are significantly stronger than bleed through signals and background noise (Figure 2B).
Multiplexing capability of separation-free assays, or the number of genetic markers which can be investigated in single reaction, is dependent on availability of fluorophore combinations which can be cleanly separated by optical filters. On one hand, since most organic fluorophores have relatively broad emission spectra, it becomes challenging to optically separate more than a few fluorophores at the same time. On the other hand, since the emission spectra of QDs are narrow and can be easily separated from each other, QD biosensor could be a powerful solution to boost the multiplexing capability of separation-free assays. Further improvement in conjugation techniques would prove beneficial in order to completely substitute chemical fluorophores labeled on DNA with QDs. Specifically, more variations of suitable conjugation method are required so that each species of QD can be easily, stably, and specifically labeled to target DNA molecules without affecting the biochemical reaction and components in the solution.
4. Conclusions
In summary, we demonstrated single-QD, multiple-color coincident fluorescence analysis that facilitates multiplexed and separation-free detection of point mutations. By combining the high specificity of Gap-LCR and high sensitivity of QD-SMS, we successfully detected zeptomoles of KRAS codon 12 mutation variants with close to 100% specificity. Such high sensitivity eliminated the requirement for PCR pre-amplification from genomic DNA. In addition, a tedious separation step commonly required by ligation-based mutation assays was circumvented by the integration of coincidence detection, which identifies specific target sequence by detecting coincident multi-color fluorescence bursts in homogeneous environment. Such a highly sensitive, specific, multiplexed separation-free genotyping method would prove valuable as novel single molecule approach for genetic mutation detection.
5. Experimental Section
DNA Extraction
Genomic DNA was extracted from human foreskin fibroblast (CRL-2522, ATCC, Manassas, VA) and Panc-1 cancer cell lines using Biosprint 15 DNA extraction kit (Qiagen, Inc., Venlo, Netherlands). The extracted DNA was stored at 4 °C until use.
Oligonucleotides
All the synthetic oligonucleotides were purchased from the Integrated DNA Technology and the sequences were listed in Table 1. Apr and Gpr were labeled with Alexa488 and Alexa546, respectively, at their 5’ terminals. Cpr1 and Cpr3 were labeled with phosphate at their 5’ terminals for ligation reaction to take place. Primer Cpr1 was labeled with biotin at its 3’ terminal for coupling with streptavidin-coated QD. All primers were HPLC purified.
Gap-LCR Reaction
Gap-LCR was conducted in 25 μl of reaction volume containing ThermoPol Buffer (1X); Taq Ligase Buffer (0.25X); NAD β (1mM); dGTP (10 μM); dATP (10 μM); MgCl2 (3 mM); Taq DNA Polymerase (1.25 units, New England Biolabs); Taq DNA Ligase (10 units, New England Biolabs); various amounts of mutant and/or wild type templates (synthetic or genetic DNA extracted from cell lines); common primers (60 nM, Cpr1 – 3) as well as discrimination primers (Apr and/or Gpr). The mixture was first incubated at 94 °C for 2 minutes, and then thermal cycling was conducted for 60 cycles at 94 °C for 30 seconds (denaturation step) and 65.1 °C for 60 seconds (ligation step) unless otherwise noted (Supporting Information). After thermal cycling, Taq DNA polymerase and Taq DNA ligase were inactivated by incubating the sample at 94 °C for 30 minutes. Ligation products were stored at 4 °C until use.
Coupling of QD and Ligation Products
Qdot 655 streptavidin conjugate (QD655), which has a peak emission wavelength at 655 nm, was purchased from Invitrogen (Carlsbad, CA). QD was first diluted to 1 nM with phosphate-buffered saline without calcium & magnesium (1X, Invitrogen). The ligation products were then mixed with QD at 30:1 biotin:QD ratio in order to generate DNA-QD nanocomplex. Since each QD had 40-80 biotin binding sites, all biotin-labeled DNA molecules could be captured by QDs (supporting information). After 20 minutes incubation in dark at room temperature, the nanocomplex was further diluted to 50 pM using PBS. Later, the samples were dispensed into 96-well plate with glass bottom for SMS measurements. All tubes were washed with BSA solution (0.1 %) and were baked at 70°C degrees for 15 min before use.
Coincident Fluorescence Detection
Coincident fluorescence detection was conducted using Zeiss LSM 510 Confocal microscope (Figure S1). 488 nm Argon laser and 543 nm Helium-Neon Laser were used to excite Alexa488 and Alexa546, respectively. Both lasers were capable of exciting QD655. The 488 nm laser and 543 nm laser were kept at 7.2 mW and 1.2 mW, respectively, at all time. A C-Apochromat 40X/1.2 water immersion objective was used to focus the laser into the sample contained in the 96-well plate and to collect emitted fluorescence. A 90 μm pinhole (PH) was placed after dichroic mirror (DM) to reject background fluorescence from out-of-focus molecules and scattered light. Fluorescence emitted from in-focus molecules was separated by dichroic mirrors to fluorescence emitted from fluorophore labeled on ligation product (Alexa488 and/or Alexa546) and from QD. Fluorescence light was then respectively filtered by emission filters (EF) and subsequently detected by avalanche photodiode (APD). Measurements were conducted for 180 seconds for each sample.
Coincidence Analysis
Acquired data were analyzed by a customized program written in LabView (National Instrument, Autstin, TX). Individual fluorescence bursts were first identified by applying threshold to raw single molecule data. Fluorescence signals which exceeded the threshold were recognized as true fluorescence bursts. Coincident fluorescence bursts were then identified as a pair of simultaneous fluorescence bursts from both QD and Alexa488/546 channels.
Supplementary Material
Acknowledgements
We thank J. Elisseeff and S. Leach at The Johns Hopkins University School of Medicine for providing human foreskin fibroblast (ATCC, Inc.) and Panc-1 cancer cell lines, respectively. We also thank the funding support from NIH (R01CA155305, U54CA151838), AACR Stand Up To Cancer (SU2C-AACR-CT0109) and NSF (1159711, 0967375, 0546012).
Footnotes
Supporting Information is available on the WWW under http://www.small-journal.com or from the author.
Contributor Information
Yunke Song, Department of Biomedical Engineering, The Johns Hopkins University School of Medicine. 3400 N. Charles Street, 122 Clark Baltimore, MD, 21218 (USA).
Yi Zhang, Department of Biomedical Engineering, The Johns Hopkins University School of Medicine. 3400 N. Charles Street, 122 Clark Baltimore, MD, 21218 (USA).
Tza-Huei Wang, Department of Mechanical Engineering, Department of Biomedical Engineering, Sidney Kimmel Comprehensive Cancer Center, and Center of Cancer Nanotechnology Excellence, The Johns Hopkins University. 3400 N. Charles Street, 108 Latrobe Baltimore, MD, 21218 (USA).
References
- 1.Sidransky D, Tokino T, Hamilton SR, Kinzler KW, Levin B, Frost P, Vogelstein B. Science. 1992;256:102. doi: 10.1126/science.1566048. [DOI] [PubMed] [Google Scholar]
- 2.Sidransky D. Nat. Rev. Cancer. 2002;2:210. doi: 10.1038/nrc755. [DOI] [PubMed] [Google Scholar]
- 3.Hayashi N, Arakawa H, Nagase H, Yanagisawa A, Kato Y, Ohta H, Takano S, Ogawa M, Nakamura Y. Cancer Res. 1994;54:3853. [PubMed] [Google Scholar]
- 4.Brennan JA, Mao L, Hruban RH, Boyle JO, Eby YJ, Koch WM, Goodman SN, Sidransky D, Engl N. J. Med. 1995;332:429. doi: 10.1056/NEJM199502163320704. [DOI] [PubMed] [Google Scholar]
- 5.Ho CL, Kurman RJ, Dehari R, Wang TL, Shih I. Cancer Res. 2004;64:6915. doi: 10.1158/0008-5472.CAN-04-2067. [DOI] [PubMed] [Google Scholar]
- 6.Amado RG, Wolf M, Peeters M, Van Cutsem E, Siena S, Freeman DJ, Juan T, Sikorski R, Suggs S, Radinsky R, Patterson SD, Chang DD. J. Clin. Oncol. 2008;26:1626. doi: 10.1200/JCO.2007.14.7116. [DOI] [PubMed] [Google Scholar]
- 7.Massarelli E, Varella-Garcia M, Tang X, Xavier AC, Ozburn NC, Liu DD, Bekele BN, Herbst RS, Wistuba II. Clin. Cancer Res. 2007;13:2890. doi: 10.1158/1078-0432.CCR-06-3043. [DOI] [PubMed] [Google Scholar]
- 8.van Krieken JH, Jung A, Kirchner T, Carneiro F, Seruca R, Bosman FT, Quirke P, Flejou JF, Plato Hansen T, de Hertogh G, Jares P, Langner C, Hoefler G, Ligtenberg M, Tiniakos D, Tejpar S, Bevilacqua G, Ensari A. Virchows Arch. 2008;453:417. doi: 10.1007/s00428-008-0665-y. [DOI] [PubMed] [Google Scholar]
- 9.Syvanen AC. Nat. Rev. Genet. 2001;2:930. doi: 10.1038/35103535. [DOI] [PubMed] [Google Scholar]
- 10.Tsuchihashi Z, Dracopoli NC. Pharmacogenomics J. 2002;2:103. doi: 10.1038/sj.tpj.6500094. [DOI] [PubMed] [Google Scholar]
- 11.Kwok PY, Chen X. Curr. Issues Mol. Biol. 2003;5:43. [PubMed] [Google Scholar]
- 12.Kwok PY. Annu. Rev. Genomics Hum. Genet. 2001;2:235. doi: 10.1146/annurev.genom.2.1.235. [DOI] [PubMed] [Google Scholar]
- 13.Ragoussis J. Annu. Rev. Genomics Hum. Genet. 2009;10:117. doi: 10.1146/annurev-genom-082908-150116. [DOI] [PubMed] [Google Scholar]
- 14.Lyamichev V, Mast AL, Hall JG, Prudent JR, Kaiser MW, Takova T, Kwiatkowski RW, Sander TJ, de Arruda M, Arco DA, Neri BP, Brow MA. Nat. Biotechnol. 1999;17:292. doi: 10.1038/7044. [DOI] [PubMed] [Google Scholar]
- 15.Lizardi PM, Huang X, Zhu Z, Bray-Ward P, Thomas DC, Ward DC. Nat. Genet. 1998;19:225. doi: 10.1038/898. [DOI] [PubMed] [Google Scholar]
- 16.Cao W. Trends Biotechnol. 2004;22:38. doi: 10.1016/j.tibtech.2003.11.001. [DOI] [PubMed] [Google Scholar]
- 17.Barany F. Proc. Natl. Acad. Sci. U. S. A. 1991;88:189. doi: 10.1073/pnas.88.1.189. [DOI] [PMC free article] [PubMed] [Google Scholar]
- 18.Huang Y, Zhang YL, Xu X, Jiang JH, Shen GL, Yu RQ. J. Am. Chem. Soc. 2009;131:2478. doi: 10.1021/ja808700d. [DOI] [PubMed] [Google Scholar]
- 19.Huh YS, Lowe AJ, Strickland AD, Batt CA, Erickson D. J. Am. Chem. Soc. 2009;131:2208. doi: 10.1021/ja807526v. [DOI] [PMC free article] [PubMed] [Google Scholar]
- 20.Chen X, Ying A, Gao Z. Biosens. Bioelectron. 2012;36:89. doi: 10.1016/j.bios.2012.03.045. [DOI] [PubMed] [Google Scholar]
- 21.Day DJ, Speiser PW, White PC, Barany F. Genomics. 1995;29:152. doi: 10.1006/geno.1995.1226. [DOI] [PubMed] [Google Scholar]
- 22.Khanna M, Park P, Zirvi M, Cao W, Picon A, Day J, Paty P, Barany F. Oncogene. 1999;18:27. doi: 10.1038/sj.onc.1202291. [DOI] [PubMed] [Google Scholar]
- 23.Chen X, Livak KJ, Kwok PY. Genome Res. 1998;8:549. doi: 10.1101/gr.8.5.549. [DOI] [PMC free article] [PubMed] [Google Scholar]
- 24.Landegren U, Kaiser R, Sanders J, Hood L. Science. 1988;241:1077. doi: 10.1126/science.3413476. [DOI] [PubMed] [Google Scholar]
- 25.Cheng Y, Du Q, Wang L, Jia H, Li Z. Anal. Chem. 2012;84:3739. doi: 10.1021/ac300314c. [DOI] [PubMed] [Google Scholar]
- 26.Shen W, Deng H, Gao Z. J. Am. Chem. Soc. 2012;134:14678. doi: 10.1021/ja306265n. [DOI] [PubMed] [Google Scholar]
- 27.Wee EJH, Shiddiky MJA, Brown MA, Trau M. Chem. Commun. 2012 doi: 10.1039/c2cc35841g. [DOI] [PubMed] [Google Scholar]
- 28.Barany F. PCR Methods Appl. 1991;1:5. doi: 10.1101/gr.1.1.5. [DOI] [PubMed] [Google Scholar]
- 29.Demchinskaya AV, Shilov IA, Karyagina AS, Lunin VG, Sergienko OV, Voronina OL, Leiser M, Plobner L. J. Biochem. Biophys. Methods. 2001;50:79. doi: 10.1016/s0165-022x(01)00178-6. [DOI] [PubMed] [Google Scholar]
- 30.Abravaya K, Carrino JJ, Muldoon S, Lee HH. Nucleic Acids Res. 1995;23:675. doi: 10.1093/nar/23.4.675. [DOI] [PMC free article] [PubMed] [Google Scholar]
- 31.Yi P, Jiang H, Li L, Dai F, Zheng Y, Han J, Chen Z, Guo J. Cell Biochem. Biophys. 2012;62:161. doi: 10.1007/s12013-011-9277-2. [DOI] [PubMed] [Google Scholar]
- 32.Grossman PD, Bloch W, Brinson E, Chang CC, Eggerding FA, Fung S, Iovannisci DM, Woo S, Winn-Deen ES. Nucleic Acids Res. 1994;22:4527. doi: 10.1093/nar/22.21.4527. [DOI] [PMC free article] [PubMed] [Google Scholar]
- 33.Iannone MA, Taylor JD, Chen J, Li MS, Rivers P, Slentz-Kesler KA, Weiner MP. Cytometry. 2000;39:131. [PubMed] [Google Scholar]
- 34.Jou C, Rhoads J, Bouma S, Ching S, Hoijer J, Schroeder-Poliak P, Zaun P, Smith S, Richards S, Caskey CT, Gordon J. Hum. Mutat. 1995;5:86. doi: 10.1002/humu.1380050112. [DOI] [PubMed] [Google Scholar]
- 35.Livak KJ. Genet. Anal. 1999;14:143. doi: 10.1016/s1050-3862(98)00019-9. [DOI] [PubMed] [Google Scholar]
- 36.Baelum J, Jacobsen CS. Appl. Environ. Microbiol. 2009;75:2969. doi: 10.1128/AEM.02051-08. [DOI] [PMC free article] [PubMed] [Google Scholar]
- 37.Li Y, Guessous F, Zhang Y, Dipierro C, Kefas B, Johnson E, Marcinkiewicz L, Jiang J, Yang Y, Schmittgen TD, Lopes B, Schiff D, Purow B, Abounader R. Cancer Res. 2009;69:7569. doi: 10.1158/0008-5472.CAN-09-0529. [DOI] [PMC free article] [PubMed] [Google Scholar]
- 38.Adams JS, Ren S, Liu PT, Chun RF, Lagishetty V, Gombart AF, Borregaard N, Modlin RL, Hewison M, Immunol J. 2009;182:4289. doi: 10.4049/jimmunol.0803736. [DOI] [PMC free article] [PubMed] [Google Scholar]
- 39.Tyagi S, Kramer FR. Nat. Biotechnol. 1996;14:303. doi: 10.1038/nbt0396-303. [DOI] [PubMed] [Google Scholar]
- 40.Zhao Y, Park S, Kreiswirth BN, Ginocchio CC, Veyret R, Laayoun A, Troesch A, Perlin DS. J. Clin. Microbiol. 2009;47:2067. doi: 10.1128/JCM.02230-08. [DOI] [PMC free article] [PubMed] [Google Scholar]
- 41.Foy CA, Parkes HC. Clin. Chem. 2001;47:990. [PubMed] [Google Scholar]
- 42.Yahiatene I, Doose S, Huser T, Sauer M. Anal. Chem. 2012;84:2729. doi: 10.1021/ac2030283. [DOI] [PubMed] [Google Scholar]
- 43.Orte A, Clarke RW, Klenerman D. Chemphyschem. 2011;12:491. doi: 10.1002/cphc.201000636. [DOI] [PubMed] [Google Scholar]
- 44.Orte A, Birkett NR, Clarke RW, Devlin GL, Dobson CM, Klenerman D. Proc. Natl. Acad. Sci. U. S. A. 2008;105:14424. doi: 10.1073/pnas.0803086105. [DOI] [PMC free article] [PubMed] [Google Scholar]
- 45.Orte A, Clarke RW, Klenerman D. Anal. Chem. 2008;80:8389. doi: 10.1021/ac8009092. [DOI] [PubMed] [Google Scholar]
- 46.Lymperopoulos K, Crawford R, Torella JP, Heilemann M, Hwang LC, Holden SJ, Kapanidis AN. Angew. Chem. Int. Ed Engl. 2010;49:1316. doi: 10.1002/anie.200904597. [DOI] [PubMed] [Google Scholar]
- 47.Zhang CY, Yang K. Anal. Bioanal Chem. 2010;397:703. doi: 10.1007/s00216-010-3555-5. [DOI] [PubMed] [Google Scholar]
- 48.Zhang CY, Hu J. Anal. Chem. 2010;82:1921. doi: 10.1021/ac9026675. [DOI] [PubMed] [Google Scholar]
- 49.Zhang CY, Yeh HC, Kuroki MT, Wang TH. Nat. Mater. 2005;4:826. doi: 10.1038/nmat1508. [DOI] [PubMed] [Google Scholar]
- 50.Ranasinghe RT, Brown T. Chem. Commun. (Camb) 2011;47:3717. doi: 10.1039/c0cc04215c. [DOI] [PubMed] [Google Scholar]
- 51.Yeh HC, Ho YP, Shih I, Wang TH. Nucleic Acids Res. 2006;34:e35. doi: 10.1093/nar/gkl021. [DOI] [PMC free article] [PubMed] [Google Scholar]
- 52.Ho YP, Kung MC, Yang S, Wang TH. Nano Lett. 2005;5:1693. doi: 10.1021/nl050888v. [DOI] [PubMed] [Google Scholar]
- 53.Castro A, Williams JG. Anal. Chem. 1997;69:3915. doi: 10.1021/ac970389h. [DOI] [PubMed] [Google Scholar]
- 54.Yeh HC, Ho YP, Wang TH. Nanomedicine. 2005;1:115. doi: 10.1016/j.nano.2005.03.004. [DOI] [PubMed] [Google Scholar]
- 55.Li H, Ying L, Green JJ, Balasubramanian S, Klenerman D. Anal. Chem. 2003;75:1664. doi: 10.1021/ac026367z. [DOI] [PubMed] [Google Scholar]
- 56.Cipriany BR, Zhao R, Murphy PJ, Levy SL, Tan CP, Craighead HG, Soloway PD. Anal. Chem. 2010;82:2480. doi: 10.1021/ac9028642. [DOI] [PMC free article] [PubMed] [Google Scholar]
- 57.Neely LA, Patel S, Garver J, Gallo M, Hackett M, McLaughlin S, Nadel M, Harris J, Gullans S, Rooke J. Nat. Methods. 2006;3:41. doi: 10.1038/nmeth825. [DOI] [PubMed] [Google Scholar]
- 58.Schwille P, Meyer-Almes FJ, Rigler R. Biophys. J. 1997;72:1878. doi: 10.1016/S0006-3495(97)78833-7. [DOI] [PMC free article] [PubMed] [Google Scholar]
Associated Data
This section collects any data citations, data availability statements, or supplementary materials included in this article.


