Abstract
Rapid-scan EPR has been shown to improve the signal-to-noise ratio relative to conventional continuous wave spectroscopy. Equations are derived for the steady-state solution to the Bloch equations as a Fourier expansion in the harmonics of the scan frequency. This simulation method is about two orders of magnitude faster than time-domain numerical integration.
1. Introduction
Rapid-scan EPR provides enhanced signal-to-noise relative to conventional continuous wave (CW) for samples ranging from nitroxides [1] and spin-trapped radicals [2] in fluid solution to paramagnetic centers in materials [3]. When the magnetic field is scanned through resonance in a time that is short relative to relaxation times, passage effects may result in oscillations on the trailing edge of the signal. Initially linear scans were employed because of the availability of a deconvolution procedure [4] to recover the slow-scan absorption and dispersion signals. Sinusoidal scans with resonated coils permit faster and wider scans within the constraints of the power available from the coil driver [5]. Development of sinusoidal deconvolution and background subtraction procedures made it practical to employ rapid sinusoidal scans of the external magnetic field [6,7]. The rapid-scan signals can be simulated using numerical integration of the Bloch equations [8]. However, numerical integration is computationally intensive. For a spectrum with many hyperfine lines, it may take from minutes to hours to compute the fitting function.
Robinson and co-workers described a method to simulate continuous wave (CW) EPR spectra including the effects of power saturation, magnetic field modulation, and modulation frequency [9]. Since the spin excitation is periodic, the steady-state signal can be expressed as a Fourier expansion in the harmonics of the modulation frequency [9]. We now show that an analogous approach starting from the Bloch equations can be used to efficiently compute rapid-scan spectra. Since the method does not require the B1 excitation magnetic field to be in the linear response regime, it can be used to simulate spectra at a range of microwave powers, as in a power saturation curve. The Fourier expansion method reduces computation time by two to three orders of magnitude relative to time-domain integration of the Bloch equations. Explicit equations are provided that can be easily implemented in software.
2. Periodic solution of Bloch Equations
The Bloch equations for a sinusoidal magnetic field scan [8] are:
| (1) |
| (2) |
where B is the offset in gauss of the center field from the resonance field for the spin packet, Bpp is the scan width, B1 is the amplitude of the excitation field, and fs is the scan frequency. The variables in Eq. (1) are expressed in angular frequency units.
T1 and T2 are the longitudinal and transverse relaxation times, mx, my and mz are the projections of the magnetization vector on the Cartesian axes. The time evolution of the spin system starts at time t = 0 with mx = my = 0 and mz = M0. In about 5T1 the spin system comes to dynamic equilibrium, and the EPR signal becomes periodic with period P = 2 /s. Since data acquisition normally starts more than 5T1 after the initialization of the field scans, one can neglect the transition of the spin system to the steady state when simulating experimental data. This allows us to seek periodic solutions of the Bloch equations in a form:
| (3) |
where Xk, Yk, and Zk are the complex Fourier amplitudes for the kth harmonic of s, and j is the imaginary unit. The number of included harmonics, N, should be large enough that XN, YN, and ZN are negligibly small. The maximum frequency in the rapid-scan signal would occur if the spins were excited at an extreme of the scan and T2 was long enough that the rapid-scan oscillations continued until the other extreme of the scan. This frequency would be about Bpp, so N could be as large as the closest integer above (Bpp)/ s.
Substitution of Eq.(3) into Eq.(1) and collection of the coefficients of ejkωst, produces a system of algebraic equations:
| (4.1) |
| (4.2) |
| (4.3) |
Since the solution is proportional to M0, M0 is set equal to 1 in Eq. (4.3). In the derivation of Eq.(4), the term cos st was substituted by . 0k is the Kronecker delta function that is equal to 1 if k=0 and equal to zero otherwise. By expressing Xk and Zk in Eqs. (4.1) and (4.3) in terms of Yk, and substitution into Eq.(4.2) one can obtain an equation for the Yk unknowns:
| (5) |
Here Ak, Bk, Ck, Dk, Fk and Gk are parameters that can be computed using the following relations:
| (6) |
Eq.(6) represents a linear system of 2N +1 algebraic equations, that constitute a pentadiagonal matrix Eq. (7).
| (7) |
The system can be solved for vector Y by inversion of the matrix. Since the matrix is pentadiagonal, a computationally-efficient method is available to find Y [10]. This approach is very efficient in term of both computational time and memory allocation. After array Y is obtained, X and Z can be found using Eqs.(4.1) and (4.3). Time-domain solutions mx, my, and mz can be computed by Fourier transformation of X, Y and Z.
To verify performance of the Fourier expansion approach to solution of the Bloch equations, a Matlab program was written that uses the pentsolve routine downloaded from the Matlab Central File Exchange to solve Eq.(7). The program performs computations two to three orders of magnitude faster than an analogous program that used the ode45 Matlab routine to numerically integrate the Bloch equations. For both methods the spectra were constructed by summing contributions from multiple spin packets with different field offsets. Three comparisons are shown.
3. Examples
The time-domain (numerical integration) and frequency-domain (solution of Eq. (7)) methods produce identical results. The latter method is substantially faster for two major reasons. The first reason is that it seeks the periodic solution, while the time-domain method requires integration of a number of scan cycles for the spin system to come to a dynamic equilibrium. Secondly, a system of three differential equations is transformed to a matrix-vector form Eq. (7), which can be solved using an efficient algorithm.
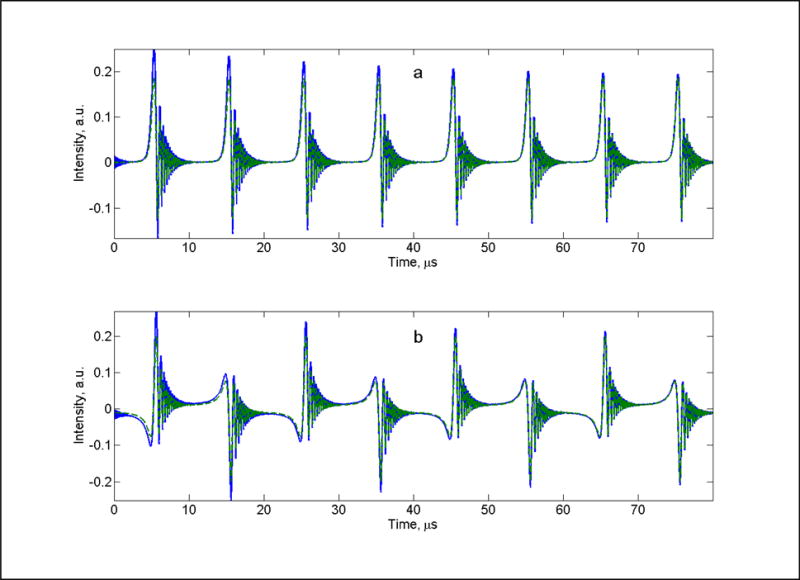
In Figure 1 four cycles of a calculated rapid-scan signal obtained by the two methods for a single spin packet are compared. The scan frequency was selected to be 50 kHz. This corresponds to a time per cycle of 10 s, which is short relative to the T1 of 50 s. In the time-domain integration method the signal must be calculated for multiple cycles before the steady-state signal amplitude is obtained. By contrast, the Fourier expansion method gives the steady-state solution in the first cycle (dashed green). For comparison three additional cycles are shown for the steady-state solution (Fig.1), which shows that the time-domain solution (blue) converges into the steady-state solution. Transient oscillations at the beginning of the time-domain integration are the result of the sudden jump of excitation from zero to 1, which produces broad band excitation. The decrease of the signal amplitude calculated by time-domain integration over the first three cycles is due to saturation of the spin system. The steady-state lineshapes and oscillations calculated by the two methods are indistinguishable.
Fig. 1.

Comparison of four cycles of the absorption (a) and dispersion (b) rapid-scan signals calculated by the Fourier expansion
 and time-domain numerical integration
 methods for Bpp = 4.0 G, B = 0.0 G, T1 = 50 s, T2 = 1 s, fm = 50 kHz, B1 = 0.03 G.
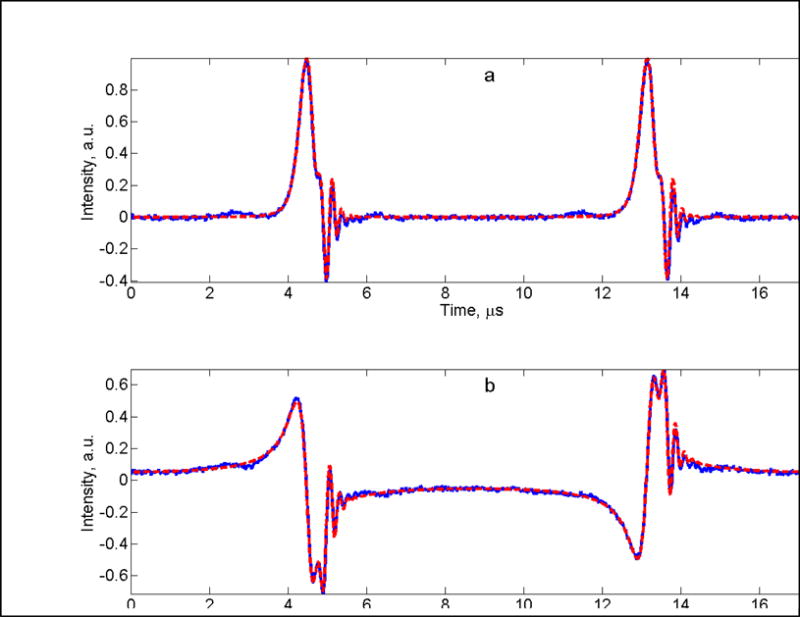
When contributions from multiple spin packets need to be summed in a simulation to account for unresolved hyperfine structure, time-domain integration becomes extremely time consuming. If in addition, the computations have to be repeated for a series of B1 values to simulate a power saturation curve, the task may take days to accomplish. For example, X-band rapid-scan experimental data for the nitroxide 15N-mHCTPO (4-protio-3-carbamoyl-2,2,5,5-tetraperdeuteromethyl-3-pyrrolin-1-yloxy) in aqueous solution were reported previously [1]. Figure 2 shows the rapid-scan signal of the nitroxide and its simulation using the Fourier expansion method, which is in excellent agreement with both the absorption and dispersion components of the experimental spectrum. The EPR signals for 38 spin packets were calculated and summed with corresponding weighting factors to account for the resolved and unresolved hyperfine structure [1]. The simulation required only a fraction of a second, so that it was done in essentially real time. A similar calculation using time-domain integration took a few minutes.
Fig. 2.

Simulation
 of experimental X-band rapid-scan spectrum
 of the low-field nitrogen hyperfine line for the nitroxide 15N-mHCTPO in water obtained with Bpp = 10.43 G, fm = 57.454 kHz, and incident power = 21 mW (B1 = 0.06 G) (a) absorption and (b) dispersion. The scan rate in the center of the sinusoidal scan is 1.9 MG/s.
The power saturation curves for rapid scans of 15N-mHCTPO were reported previously in Fig. 3 of Ref. [1]. Simulations of the power saturation curve in the published paper were obtained by time-domain numerical integration, which required about 4.2 hr. The simulations of the same data with the Fourier expansion method were indistinguishable from the published simulations, but required only about 29 s, which is an approximately factor of 500 decrease in calculation time.
Acknowledgments
The support of this work by NIH EB000557, NIH 1K25EB016040-01A1 and NSF IDBR 0753018 are gratefully acknowledged. The experimental data for mHCTPO were obtained by Deborah Mitchell, University of Denver.
References
- 1.Mitchell DG, Quine RW, Tseitlin M, Eaton SS, Eaton GR. X-band Rapid-Scan EPR of Nitroxyl Radicals. J Magn Reson. 2012;214:221–226. doi: 10.1016/j.jmr.2011.11.007. [DOI] [PubMed] [Google Scholar]
- 2.Mitchell DG, Rosen GM, Tseitlin M, Symmes B, Eaton SS, Eaton GR. Use of Rapid-Scan EPR to Improve Detection Sensitivity for Spin-Trapped Radicals. Biophys J. 2013;105:338–342. doi: 10.1016/j.bpj.2013.06.005. [DOI] [PMC free article] [PubMed] [Google Scholar]
- 3.Mitchell DG, Tseitlin M, Quine RW, Meyer V, Newton ME, Schnegg A, George B, Eaton SS, Eaton GR. X-Band Rapid-scan EPR of Samples with Long Electron Relaxation Times: A Comparison of Continuous Wave, Pulse, and Rapid-scan EPR. Mol Phys. 2013;111 111:2664-2673. [Google Scholar]
- 4.Joshi JP, Ballard JR, Rinard GA, Quine RW, Eaton SS, Eaton GR. Rapid-Scan EPR with Triangular Scans and Fourier Deconvolution to Recover the Slow-Scan Spectrum. J Magn Reson. 2005;175:44–51. doi: 10.1016/j.jmr.2005.03.013. [DOI] [PubMed] [Google Scholar]
- 5.Quine RW, Mitchell DG, Eaton SS, Eaton GR. A Resonated Coil Driver for Rapid Scan EPR. Conc Magn Reson, Magn Reson Engineer. 2012;41B:95–110. [Google Scholar]
- 6.Tseitlin M, Rinard GA, Quine RW, Eaton SS, Eaton GR. Deconvolution of Sinusoidal Rapid EPR Scans. J Magn Reson. 2011;208:279–283. doi: 10.1016/j.jmr.2010.11.015. [DOI] [PMC free article] [PubMed] [Google Scholar]
- 7.Tseitlin M, Mitchell DG, Eaton SS, Eaton GR. Corrections for sinusoidal background and non-orthogonality of signal channels in sinusoidal rapid magnetic field scans. J Magn Res. 2012;223:80–84. doi: 10.1016/j.jmr.2012.07.023. [DOI] [PMC free article] [PubMed] [Google Scholar]
- 8.Stoner JW, Szymanski D, Eaton SS, Quine RW, Rinard GA, Eaton GR. Direct-detected rapid-scan EPR at 250 MHz. J Magn Res. 2004;170:127–135. doi: 10.1016/j.jmr.2004.06.008. [DOI] [PubMed] [Google Scholar]
- 9.Robinson BH, Mailer C, Reese AW. Linewidth analysis of spin labels in liquids. I. Theory and data analysis. J Magn Reson. 1999;138:199–209. doi: 10.1006/jmre.1999.1737. [DOI] [PubMed] [Google Scholar]
- 10.Engeln-Muellges G, Uhlig F. Numerical Algorithms with C. Springer-Verlag; 1996. Linear Systems with Five-Diagonal Matrices; pp. 98–100. [Google Scholar]


