

Abstract
Haptoglobin binds free haemoglobin that prevents oxidative damage produced by haemolysis. There is a copy number variant (CNV) in the haptoglobin gene (HP) consisting of two alleles, Hp1 (no duplication), and Hp2 (1.7kb duplication involving two exons). The spread of the Hp2 allele is believed to have taken place under selective pressures conferred by malaria resistance. However, molecular evidence is lacking and Hp did not emerge in genomewide SNPs surveys for evidence of selection. In Europe, there is geographical constancy of Hp2 frequency, indicative of absence of clinal pressures and that modern day European alleles represent a “snapshot” of their out-of-Africa migrations. In this work we test for signatures of natural selection acting on the Hp CNV in a sample from the UK population (Avon Longitudinal Study of Parents and Children, ALSPAC). We present here heterozygosity decay, pairwise FST values observed between ALSPAC and 301 populations from all five populated continents, extended haplotype homozygosity analyses involving the CNV and 80 SNPs surrounding the CNV ∼500kb in each direction, and linkage disequilibrium and pairwise haplotypic analyses involving 160 SNPs on chromosome 16q22.1. Taken together, our results represent the first molecular analysis of natural selection in the Hp CNV genetic region.
Keywords: Haptoglobin, natural selection, copy number variant, ALSPAC
Introduction
Haptoglobin is an acute-phase binding protein that scavenges free haemoglobin in the plasma: this prevents oxidative damage following intravascular haemolysis (Garby & Noyes, 1959) and also directs haem and iron to specific recycling pathways via the CD163 receptor. In humans, the haptoglobin gene (HP) is located on chromosome 16q22.1. HP is a copy number variant (CNV) gene with two main alleles: Hp1 and Hp2. Whilst the Hp1 allele features no duplication and 4 exons, the Hp2 allele contains a 1.7kb duplication, originated by a non-homologous recombination event (Maeda et al., 1984). This event gives a total of 6 exons, the fifth and sixth being identical to exons 3 and 4 of Hp1 (Yang et al., 1983). The HP CNV is functional, with the genotypes producing different peptides which form dimers/polymers. Hp1/1 expression results in a dimer, and products of Hp1/2 and Hp2/2 result in varying sizes of polymers. These proteins bind to haemoglobin with differing affinities (Okazaki et al., 1997). Additionally, HP allele products may differ in functional affinity with the CD163 receptor, for the removal of haptoglobin–haemoglobin complexes through endocytosis (Kristiansen et al., 2001).
The HP gene has become polymorphic in human populations. The phenotypic distribution of HP in northwestern European populations is: Hp1/1 16%, Hp1/2 48% and Hp2/2 36%, corresponding to allele frequencies of Hp1 at 0.4 and Hp2 at 0.6 (Langlois and Delanghe, 1996). Furthermore, the proportions of HP genotype are highly variable between populations worldwide (Carter & Worwood, 2007).
There is growing evidence that HP genotype has a role in disease aetiology, due to the differential effect of products on the binding and removal of free haemoglobin, which may damage renal tissue and aggravate bacterial infection (Carter & Worwood, 2007). Several studies have suggested a protective role for Hp2 with several infectious diseases [(McDermid & Prentice, 2006) for review], but it has also been reported that Hp2/2 individuals are at higher risk of developing cardiovascular disease (Levy et al., 2002; Asleh and Levy, 2005; Levy et al., 2007). To date, however, results about the strength and direction of the association of HP genotype with cardiovascular disease and other diseases are conflicting (Carter & Worwood, 2007). Whether this association has come under the influence of natural selection is unknown.
Despite the reported associations of the HP genotype with several diseases, it is unclear what provided selective advantage for the spread of the Hp2 allele. One hypothesis to explain this is the conferral of malarial resistance by the Hp2 allele (Atkinson et al., 2007). Haptoglobin has demonstrable toxicity to malarial parasites in vitro (Imrie et al., 2004), and results from case-control studies suggest significantly lower prevalence of malaria in Hp2/2 and Hp1/2 individuals compared with those with Hp1/1 (Elagib et al., 1998). Also, evidence from a recent prospective cohort study showed increased protection from clinical malaria in Hp2/2 children, relative to the number of Hp1/2 and Hp1/1 patients, with a 30% reduction in recorded cases between genotypes (Atkinson et al., 2007). The authors suggest that higher anti-malarial protection offered by Hp2/2 allowed the genotype to spread in populations, but also that Hp1/1 may be sustained due to higher protection against other febrile processes, leading to the patterns of balanced polymorphism witnessed worldwide. However, the relationship between HP genotype, malaria resistance and possible selection remains controversial (Aucan et al., 2002; Bienzle et al., 2005). Furthermore, selection pressure provided by exposure to malaria is unlikely to have driven the persistence of the Hp2 allele in populations living at higher latitudes (McDermid and Prentice, 2006). In terms of molecular evolution, if the novel polymorphism (in this case, the haptoglobin duplication) offers an advantage for an organism to survive and reproduce, it will be a target of positive selection and not solely a product of genetic drift (Biswas & Akey, 2006).
In this work, we tested for molecular signatures of natural selection in HP in Europeans. To this end, we analysed HP CNV and SNPs densely distributed around HP from a random sample of 400 individuals from the Avon Longitudinal Study of Parents and Children (ALSPAC) cohort (Golding et al., 2001). Ethical approval for all aspects of data collection was obtained from the ALSPAC Law and Ethics Committee (institutional review board 00003312). Written informed consent for the study was obtained.
Materials and Methods
HP CNV Typing
The haptoglobin duplication was typed using amplification ratio control system (ARCS, a liquid phase high-throughput assay for quantifying gene copy number that has been developed and validated in our lab (Guthrie et al., 2011). A short junction sequence which exists between exons 4 and 5 when the duplication is present was amplified using primers positioned on either side of it; thus no amplicons represented no duplication (1,1), one amplicon represented heterozygous duplication (1,2) and 2 amplicons represented homozygous duplication (2,2). A short amplicon in a stable copy number reference gene (TP53) was amplified simultaneously using another pair of primers, and after the first two cycles, amplification for both target and reference amplicons was driven by a single universal primer, thus stabilising the amplification kinetics of all amplicons and preserving ratiometry between target and reference. Following PCR, the samples were analysed using a LightTyper™ (Roche Diagnostics GmbH, Roche Applied Science, 68298 Mannheim, Germany), which recorded the melting profiles of the DNA as temperature was increased from 45 °C to 80 °C. The haptoglobin amplicon was designed to have a melting temperature 4–5°C lower than the reference amplicon, resulting in a first derivative plot of the melting profile which showed two well separated peaks. The LightTyper melt file was analysed by Perl software written in-house which calculated peak heights as proxy for areas under the curve, and then generated cluster plots of the target peak height/reference peak height ratios. Junction nulls were handled separately, with absence of a target amplicon peak being output as zero. Samples which failed, or which amplified poorly resulting in unreliable clustering, were discarded; all others were assigned their HP CNV genotype.
SNPs
SNP data surrounding the Hp locus were obtained for the genotyped samples as part of a genome-wide association study of the ALSPAC cohort, the details of which have been published previously (Timpson et al., 2009). And 161 SNPs were included for analysis within ∼1 Mb in each direction of the HP gene at position 70649447 on chromosome 16, according to build 36.
LD Estimation
Haploview (Barrett et al., 2005) was used to estimate linkage disequilibrium (LD) measures between SNPs and the CNV in the sample. Additionally, we utilised the programme MIDAS (Gaunt et al., 2006) for analysis of interallelic association between diplotypes involving the SNPs and the CNV. MIDAS enables the characterization of LD and allelic frequencies observed for all four haplotypes in each pairwise LD.
Heterozygosity
Heterozygosity was estimated for SNPs in a 2Mb interval centred on from the HP CNV for HapMap samples from Europeans (CEU), Africans (YRI) Chinese (CHB) and Japanese (JPT) using data available in HapMap (http://hapmap.ncbi.nlm.nih.gov/). Heterozygosity was estimated using the formula
 |
where m is the number of alleles and fi is the allele frequency of the ith allele.
FST
We estimated pairwise interpopulation diversity between 301 populations across the five continents, with allele frequency available for the HP CNV (Carter & Worwood, 2007). To this end, we computed the FST statistic according to Weir and Cockerham ()1984.
Extended Haplotype Homozygosity
In order to test for the occurrence of positive selection acting around the haptoglobin CNV in Europeans, we analysed extended haplotype homozygosity (EHH) as previously described (Sabeti et al., 2002). EHH measures the decay of homozygosity at a core haplotype of interest. Phased haplotypes involving the CNV and 79 SNPs (spanning ∼500 kb either side from the CNV) were obtained by the software PHASE v.2.0 (Stephens and Donnelly, 2003). We used the Sweep program for the identification of core haplotypes involving the CNV using the block definition from Gabriel et al. (Gabriel et al., 2002). Relative EHH (rEHH), accounting for different recombination rates across the genome, and significance values for both EHH and rEHH were also measured using the default parameters in Sweep.
Results
Of 400 samples analysed, 365 were successfully genotyped for the HP CNV. Clustering of the HP CNV raw data can be seen in Figure S1. Genotype and allele frequencies (Table 1)were similar to those in Northern European populations (Carter and Worwood, 2007). Using an online tool for Hardy-Weinberg Equilibrium (HWE) testing (http://www.oege.org/software/hardy-weinberg.html) (Rodriguez et al., 2009), the observed genotype frequencies were found to be consistent with HWE (χ2= 2.71, P= 0.10).
Table 1.
Haptoglobin Genotype and Allele Frequencies in 400 ALSPAC Samples.
| Genotype Frequency | ||
|---|---|---|
| Hp1/1 | 55 | |
| Hp1/2 | 154 | |
| Hp2/2 | 156 | |
| Fails | 35 | |
| Number | Allele frequency | |
| Hp1 | 264 | 0.362 |
| Hp2 | 466 | 0.638 |
Tagging SNPs
We checked for the existence of tagging SNP(s) for the duplication that could be used for the testing of selection. Three SNPs were in complete LD (D’= 1) with the CNV (rs152837, rs152828 and rs217180). However, individually the SNPs showed insufficient tagging power: r2= 0.04, 0.06 and 0.07, respectively. Insufficient tagging power was also observed for the remaining pairwise comparisons involving the CNV and each SNP (Table S1, Fig. 1). The maximum value of r2 observed for all pairwise comparisons involving the CNV was 0.16 (mean ± S.E. = 0.026 ± 0.003). Subsequently an Expectation Maximization algorithm implemented in the Haplotype Trend Regression program (Zaykin et al., 2002) was applied to assess whether a combination of nearby markers could be used to tag the Hp2 allele. We analysed various combinations of SNP series, using the three SNPs above and also those in incomplete LD with the duplication. Neither the use of specific haplotype blocks nor “sliding” analysis across several markers resulted in increased tagging power for the duplication (data not shown). Difficulty in tagging copy number variants with SNPs has been widely encountered in complex genomic regions (Kehrer-Sawatzki, 2007), and no SNP or haplotype was found to offer effective tagging of the haptoglobin duplication.
Figure 1.
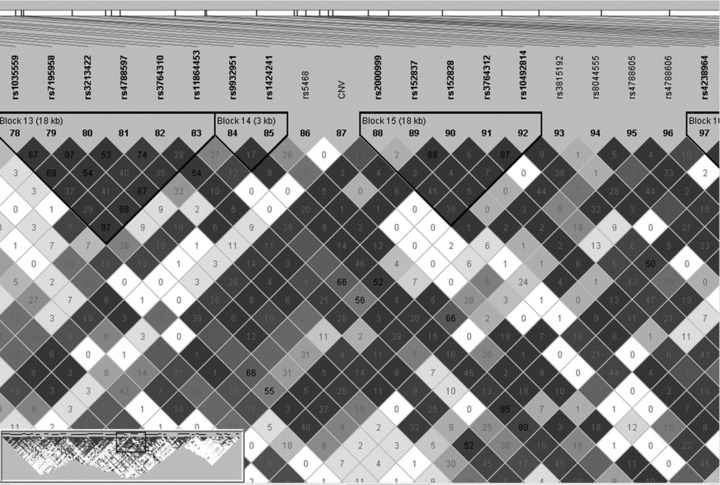
The r2 values observed between the HP CNV (87) and neighbouring SNPs taken from Haploview.
Heterozygosity
Figure 2 shows reduced polymorphism around the HP CNV. This effect is evident in all four populations.
Figure 2.
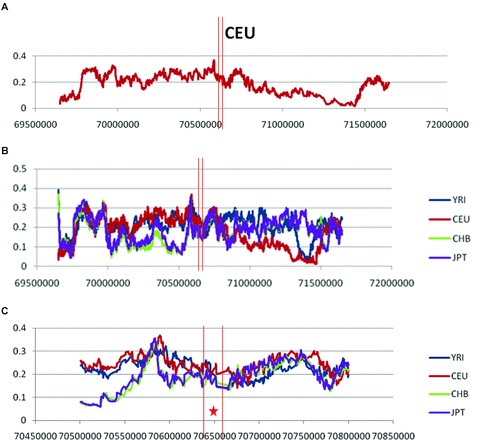
Polymorphism across ∼2 Mb centred on the HP CNV observed in HapMap samples from Europeans (CEU), Africans (YRI), Chinese (CHB) and Japanese (JPT). A decay in heterozygosity around the HP CNV was observed in all population samples. (A) Pattern of heterozygosity variation observed in CEU for a ∼2Mb interval centred on the HP CNV. (B) Pattern of heterozygosity variation observed in CEU, YRI, CHB and JPT for the same ∼2 Mb interval. (C) Heterozygosity decay in a 300Kb region centred on the HP CNV. The two vertical lines represent the interval where HP is located. The asterisk in Figure 1c represents the location of the HP CNV.
FST
Table 2 shows descriptive statistics for FST values observed between the population analysed in this work (ALSPAC) and all other populations grouped by continent. Overall interpopulation genetic diversity (as measured by the mean FST), ranges from the smallest value of 0.0032 ± 0.0006 between ALSPAC and Europe populations to the largest value of 0.1443 ± 0.0180 between ALSPAC and Oceania populations. FST values for Europeans are comparable to those previously reported by Tian et al. ()2009.
Table 2.
Descriptive Statistics of Pairwise FST Values Observed between ALSPAC and each of the 301 Populations Across Five Continents with Information available for the HP CNV (Carter and Worwood, 2007).
| N | Minimum | Maximum | Mean | Std. Deviation | |
|---|---|---|---|---|---|
| ALSPAC vs. Africa | 41 | 0 | 0.3672 | 0.1046 | 0.0891 |
| ALSPAC vs. America | 42 | 0 | 0.3848 | 0.1032 | 0.1137 |
| ALSPAC vs. Asia | 99 | 0 | 0.1837 | 0.0291 | 0.0343 |
| ALSPAC vs. Europe | 91 | 0 | 0.0322 | 0.0032 | 0.0055 |
| ALSPAC vs. Oceania | 28 | 0.0025 | 0.3582 | 0.1443 | 0.0952 |
None of these mean values and none of the maximum FST values observed between ALSPAC and populations from all five continents was higher than 0.45 (a threshold previously used to define high FST candidate selection genes (Akey et al., 2002)).
Individual FST values for each pairwise comparison involving ALSPAC can be seen in Table S2. Table S1 shows a number of instances where FST= 0 (4 for Africa, 2 for America, 6 for Asia, 30 for Europe and 0 for Oceania) and FST < 0.005 (2 for Africa, 4 for America, 12 for Asia, 41 for Europe and 2 for Oceania) for pairwise comparisons involving ALSPAC.
Table 3 shows descriptive statistics of pairwise FST values observed for each pair of populations within each continent from published HP CNV frequencies (Carter and Worwood, 2007). In all continents with the exception of Europe, there are instances of FST > 0.45. Europe is the most homogeneous continent in relation to the HP CNV, as shown by the low mean FST value observed (mean FST= 0.004). This is in agreement with the absence of clinal pressures and is also consistent with the hypothesis that modern day Europeans represent a “snapshot” of their out-of-Africa migration with respect to the HP gene region.
Table 3.
Descriptive statistics of pairwise FST values observed between populations within each continent for the 301 populations with information available for the HP CNV (Carter and Worwood, 2007).
| Continent | N | Minimum | Maximum | Average | S.D. |
|---|---|---|---|---|---|
| Africa | 41 | 0 | 0.594 | 0.072 | 0.090 |
| America | 42 | 0 | 0.549 | 0.111 | 0.120 |
| Asia | 99 | 0 | 0.558 | 0.029 | 0.044 |
| Europe | 91 | 0 | 0.107 | 0.004 | 0.008 |
| Oceania | 28 | 0 | 0.652 | 0.124 | 0.159 |
Extended Haplotype Homozygosity
One core haplotype involving the HP CNV and the SNPs rs2000999 and rs152837 was observed. The allelic composition and frequencies of each haplotype were as follows: Hp1-G-A (36%), Hp2-G-A (36%), Hp2-A-A (21%) and Hp2-G-G (7%), markers in the order HP CNV, rs2000999 and rs152837. The non-duplication allele (Hp1) is known to be older in the population. The G and A alleles in rs2000999 and rs152837 are ancestral according to the chimpanzee allele as provided with the Sweep program. The frequency of the four haplotypes is therefore indicative of the age of each allele, with Hp1-G-A being the oldest haplotype and Hp2-G-G the youngest. Significant EHH (P= 0.010) was observed for the core haplotype Hp2-G-G, which displayed higher levels of EHH than expected among SNPs located ∼500 Kb away from the duplication (Fig. 3). The addition of neighbouring SNPs to the core region did not change the results. The elimination of the HP CNV from the core region did not change the results.
Figure 3.
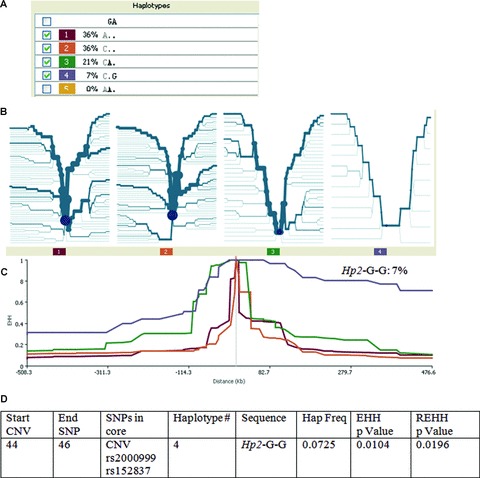
EHH analysis of the HP CNV and neighboring SNPs. (A) Frequency of the four haplotypes defined by a core haplotype including the HP CNV. G and A are the ancestral alleles for SNPs rs2000999 and rs152837, respectively. In the first position, A corresponds to Hp1 and C corresponds to Hp2; (B) Bifurcation diagrams for each of the four haplotypes. Division of the diagram reflects breakdown of LD; (C) EHH plotted for the core haplotype at ∼500 kb in both directions from the core haplotype. The decay of EHH for haplotype Hp2-G-G is markedly different from the other haplotypes; (D) Significance of EHH and rEHH values for haplotype Hp2-G-G.
LD and Haplotypes of HP CNV and SNPs
We have also characterised patterns of LD between the CNV and SNPs located up to ∼1 Mb apart in either direction. Stratification of the pairwise comparisons according to the magnitude of LD (D′≥ 0.75 vs. D′ < 0.75) showed a significantly lower allele frequency for those cases of higher LD (Table 4), in accordance with previous observations showing that rarer alleles show on average more LD than more common alleles (Zapata et al., 2001). In addition we found that, in general, the rarer allele in each SNP associates more frequently with Hp2 than with Hp1. Table 5 shows the 12 diplotypes (each involving the HP CNV and one SNP) with the highest levels of LD, as measured by D′. In total, 136 SNPs out of the 160 SNPs analysed showed higher haplotypic frequency for the haplotype “rare allele-Hp2” than for the haplotype “rare allele-Hp1” (Table S3). We computed the binomial probability of observing 136 or more successes (rare SNP allele associated with Hp2 in higher frequency) by using a Binomial Calculator (http://stattrek.com/Tables/Binomial.aspx). The specification of a probability of success on a single trial of 0.6 (allele frequency of Hp2), the number of trials (160) and the number of successes (136), rendered a binomial probability of p= 3 × 10⁻¹². Therefore it seems unlikely that this effect is due to chance alone. The higher frequency of the haplotypes “rare allele-Hp2” than of haplotypes “rare allele-Hp1” is consistent with a non-random effect in the population leading to this pattern. This adds independently to the evidence from our EHH analysis suggesting a possible role of natural selection in the variation of haplotypes involving the HP CNV.
Table 4.
ANOVA test comparing mean minor allele frequencies (MAF) between groups of SNPs stratified by level of disequilibrium with the Hp2 allele.
| SNP | N | Mean q (95% CI) | S.D. | Minimum q | Maximum q |
|---|---|---|---|---|---|
| (a) D′ < 0.75 | 148 | 0.28 (0.26,0.30) | 0.12 | 0.05 | 0.50 |
| (b) D′≥ 0.75 | 12 | 0.13 (0.10,0.17) | 0.06 | 0.04 | 0.22 |
P < 0.001.
Based on one way ANOVA.
Table 5.
Haplotype frequencies for SNPs in high LD with the HP genotype. 10 SNPs show alleles associating more closely with the Hp2 allele (labels B-J and L), whilst two are more closely associated with the Hp1 allele (labels A and K).
| SNP code | Haplotype (HP, SNP) | Observed haplotype frequency | D′ | r2 | Position on chromosome 16 | Min. allele frequency | |
|---|---|---|---|---|---|---|---|
| (A) | rs17665900 | 2,G | 0.624 | 0.81 | 0.16 | 69915112 | 0.878 |
| 2,A | 0.015 | −0.81 | 0.122 | ||||
| 1,G | 0.255 | −0.81 | 0.878 | ||||
| 1,A | 0.107 | 0.81 | 0.122 | ||||
| (B) | rs1424241 | 2,C | 0.475 | −0.79 | 0.08 | 69966408 | 0.824 |
| 2,T | 0.162 | 0.79 | 0.176 | ||||
| 1,C | 0.349 | 0.79 | 0.824 | ||||
| 1,T | 0.013 | −0.79 | 0.176 | ||||
| (C) | rs2000999 | 2,G | 0.433 | −0.89 | 0.12 | 69995594 | 0.786 |
| 2,A | 0.205 | 0.89 | 0.214 | ||||
| 1,G | 0.353 | 0.89 | 0.786 | ||||
| 1,A | 0.009 | −0.89 | 0.214 | ||||
| (D) | rs152837 | 2,A | 0.567 | −1.00 | 0.04 | 70005252 | 0.929 |
| 2,G | 0.071 | 1.00 | 0.071 | ||||
| 1,A | 0.362 | 1.00 | 0.929 | ||||
| 1,G | 0.000 | −1.00 | 0.071 | ||||
| (E) | rs152828 | 2,G | 0.540 | −1.00 | 0.06 | 70011387 | 0.901 |
| 2,A | 0.099 | 1.00 | 0.099 | ||||
| 1,G | 0.362 | 1.00 | 0.901 | ||||
| 1,A | 0.000 | −1.00 | 0.099 | ||||
| (F) | rs217180 | 2,G | 0.529 | −1.00 | 0.07 | 70072130 | 0.890 |
| 2,A | 0.110 | 1.00 | 0.110 | ||||
| 1,G | 0.362 | 1.00 | 0.890 | ||||
| 1,A | 0.000 | −1.00 | 0.110 | ||||
| (G) | rs12926250 | 2,G | 0.529 | −0.83 | 0.05 | 70100817 | 0.884 |
| 2,T | 0.109 | 0.83 | 0.116 | ||||
| 1,G | 0.355 | 0.83 | 0.884 | ||||
| 1,T | 0.007 | −0.83 | 0.116 | ||||
| (H) | rs12928056 | 2,C | 0.527 | −0.84 | 0.05 | 70113075 | 0.882 |
| 2,A | 0.111 | 0.84 | 0.118 | ||||
| 1,C | 0.355 | 0.84 | 0.882 | ||||
| 1,A | 0.007 | −0.84 | 0.118 | ||||
| (I) | rs11646048 | 2,A | 0.439 | −0.90 | 0.12 | 70179233 | 0.793 |
| 2,G | 0.200 | 0.90 | 0.207 | ||||
| 1,A | 0.355 | 0.90 | 0.793 | ||||
| 1,G | 0.007 | −0.90 | 0.207 | ||||
| (J) | rs9940976 | 2,A | 0.431 | −0.82 | 0.11 | 70199327 | 0.778 |
| 2,C | 0.207 | 0.82 | 0.222 | ||||
| 1,A | 0.347 | 0.82 | 0.778 | ||||
| 1,C | 0.015 | −0.82 | 0.222 | ||||
| (K) | rs726887 | 2,G | 0.636 | 0.85 | 0.06 | 70239298 | 0.955 |
| 2,T | 0.004 | −0.85 | 0.045 | ||||
| 1,G | 0.319 | −0.85 | 0.955 | ||||
| 1,T | 0.041 | 0.85 | 0.045 | ||||
| (L) | rs212165 | 2,A | 0.535 | −0.82 | 0.05 | 70356964 | 0.889 |
| 2,G | 0.104 | 0.82 | 0.111 | ||||
| 1,A | 0.354 | 0.82 | 0.889 | ||||
| 1,G | 0.007 | −0.82 | 0.111 |
Allele Age
Table 6 shows age estimates computed for the HP CNV and for the 12 SNPs with high LD with the HP CNV. These neutral allele age estimates were based on a constant population size (Slatkin and Rannala, 2000). The HP CNV showed the oldest age. And 10 out of the 12 SNPs showed ages greater than 100,000 years, while two of them showed ages of 58,760 and 81,046 years, respectively. Considering that the out-of-Africa migration took place at around 50,000–100,000 years ago (Tishkoff and Verrelli, 2003), our results support the hypothesis that the SNPs associated with the HP CNV originated before the out-of-Africa migration. This assumes neutrality. However, allele ages for neutral alleles provide conservative upper bound for alleles which are under selection (Slatkin and Rannala, 2000). Taken together, these SNP data suggest the rapid emergence of the Hp2 allele under 100,000 years ago and possibly more recently. This picture would be consistent with observations for other genotypes positively selected by malaria, and it contrasts with the picture of EHH and other features observed for lactase persistence, a “survival” genotype which has emerged in North Europe within the past 5,000–10,000 years (Bersaglieri et al., 2004).
Table 6.
Age estimates of the HP CNV and 12 SNPs in high LD (D′ > 0.79) with HP genotype
| SNP code | SNP allele | Min allele frequency (q) | Allele age estimates | ||||
|---|---|---|---|---|---|---|---|
| Scaled time1 | Generations2 | Age (years)3 | |||||
| (A) | rs17665900 | A | 0.122 | 0.58 | 5844 | 116,875 | |
| (B) | rs1424241 | T | 0.176 | 0.74 | 7417 | 148,332 | |
| (C) | rs2000999 | A | 0.214 | 0.84 | 8388 | 167,761 | |
| (D) | rs152837 | G | 0.071 | 0.41 | 4052 | 81,046 | |
| (E) | rs152828 | A | 0.099 | 0.51 | 5069 | 101,386 | |
| (F) | rs217180 | A | 0.110 | 0.54 | 5443 | 108,850 | |
| (G) | rs12926250 | T | 0.116 | 0.57 | 5668 | 113,354 | |
| (H) | rs12928056 | A | 0.118 | 0.57 | 5712 | 114,241 | |
| (I) | rs11646048 | G | 0.207 | 0.82 | 8219 | 164,380 | |
| (J) | rs9940976 | C | 0.222 | 0.86 | 8587 | 171,748 | |
| (K) | rs726887 | T | 0.045 | 0.29 | 2938 | 58,760 | |
| (L) | rs212165 | G | 0.111 | 0.55 | 5488 | 109,760 | |
| (M) | HP CNV | 1 | 0.362 | 1.15 | 11,531 | 230,616 | |
Scaled estimate based on formula by Slatkin and Rannala (Slatkin and Rannala, 2000).
Based on the minimum populations size before recent modern human growth (N= 10,000).
Assuming a generation span of 20 years.
Discussion
In summary, our results from four different population and molecular approaches enable inferences about natural selection acting in the HP CNV region. We did not find strong evidence for natural selection on the HP CNV region, although both the reduction of heterozygosity in the HP CNV region and the FST values observed between populations across continents are in accordance with non-neutrality between populations. Our EHH results are in accordance with positive selection acting on the HP CNV region. However, this seems to be not completely explained by the HP CNV itself.
Our FST results showed a relatively constant frequency of the HP CNV in Europe compared with other continents. This suggests little selection in Europe, despite the reported existence of marsh fever (malaria) in marsh areas of Europe from the sixteenth to the nineteenth century (Dobson, 1994; Reiter, 2000). Marsh fever produced high levels of mortality, but the population attributable effect was small.
The absence of a tagging SNP for the HP CNV has implications for the interpretation of association studies. It might explain why Genome-wide Association studies that have been performed to date have not identified HP as a potential candidate gene.
The Hp2 allele is newer than Hp1 de facto, according to the molecular evolution of this CNV. This is despite its higher frequency in populations, which would suggest that this allele is very old. Our new approach based on LD shows molecular evidence supporting the existence of a non-random effect consistent with natural selection. In particular, we have shown that there is a significant over-representation of rare SNP alleles associated with Hp2. This could be the result of a “hitchhiking” effect with increasing allele frequency of the neutral SNPs close to the HP gene, which would result in a stronger association of rare SNP alleles with Hp2 than with Hp1. This hitchhiking effect would have occurred before the migration into Europe when there was plausible selective pressure on Hp2. This is supported by our estimates of SNP allele ages that date back to before the migration into Europe. Comparison of our EHH results with published literature also gives an indication of a possible time span when selection took place. The lactase persistence allele, which emerged in North Europe within the past 5,000–10,000 years (Bersaglieri et al., 2004), shows a stronger and wider LD pattern than the one we observed for the HP region. Our age estimates, which assumed neutrality, for 12 SNPs suggest ∼100,000 years. Therefore, a more conservative estimate for HP selection would range between 5,000 and 100,000 years.
The weak evidence for natural selection found in this work is more likely to reflect residual levels of an older selection phenomenon that is being diluted rather than being an active process of natural selection. This would be consistent with the relatively rare extended haplotype showing significant signatures of natural selection by the EHH test. The effect of malaria is negligible in modern European populations, although historically there may have been some selective pressure (Dobson, 1994; Reiter, 2000). In addition, if Hp2 does provide protection from chronic diseases and influence health in European populations, the effects should be pre-reproductive. It is more likely that all selection acting on the Hp CNV region occurred in Africa due to selection acting on malaria, and that current levels of selection in Europeans (as captured in our ALSPAC sample) are a “snapshot” of the genomic landscape originated by the out-of-Africa migration. Our findings are also consistent with positive selection due to malaria previously found for various blood protein genes (Kwiatkowski, 2005).
Acknowledgments
We acknowledge Mark Beaumont for his comments on a final version of the manuscript. We are extremely grateful to all the families who took part in this study, the midwives for their help in recruiting them, and the whole ALSPAC team, which includes interviewers, computer and laboratory technicians, clerical workers, research scientists, volunteers, managers, receptionists and nurses. The UK Medical Research Council (Grant ref: 74882) the Wellcome Trust (Grant ref: 076467) and the University of Bristol provide core support for ALSPAC. DW is funded by a Wellcome Trust 4-year PhD studentship in molecular, genetic and life course epidemiology (WT083431MA).
Conflict of Interest Statement
All the authors declare that they have no conflicts of interest.
Supporting Information
Additional supporting information may be found in the online version of this article:
ARCS assay for HP duplicon junction CNV.
LD statistics for all pairwise comparisonsinvolving the HP CNV and neighbouring SNPs in a 2 Mbinterval centred on the HP CNV.
Pairwise FST observed between ALSPAC and worldwide populations with HP CNV allelic frequencies described by Carter and Worwood (2007).
Interallelic LD and descriptives for allpairwise comparisons involving the HP CNV and SNPs ∼2Mb apartcentred on the HP CNV.
Reference
- Akey JM, Zhang G, Zhang K, Jin L, Shriver MD. Interrogating a high-density SNP map for signatures of natural selection. Genome Res. 2002;12:1805–1814. doi: 10.1101/gr.631202. [DOI] [PMC free article] [PubMed] [Google Scholar]
- Asleh R, Levy AP. In vivo and in vitro studies establishing haptoglobin as a major susceptibility gene for diabetic vascular disease. Vasc Health Risk Manag. 2005;1:19–28. doi: 10.2147/vhrm.1.1.19.58930. [DOI] [PMC free article] [PubMed] [Google Scholar]
- Atkinson SH, Mwangi TW, Uyoga SM, Ogada E, Macharia AW, Marsh K, Prentice AM, Williams TN. The haptoglobin 2–2 genotype is associated with a reduced incidence of Plasmodium falciparum malaria in children on the coast of Kenya. Clin Infect Diseases. 2007;44:802–809. doi: 10.1086/511868. [DOI] [PMC free article] [PubMed] [Google Scholar]
- Aucan C, Walley AJ, Greenwood BM, Hill AVS. Haptoglobin genotypes are not associated with resistance to severe malaria in The Gambia. Trans R Soc Trop Med Hyg. 2002;96:327–328. doi: 10.1016/s0035-9203(02)90114-8. [DOI] [PubMed] [Google Scholar]
- Barrett JC, Fry B, Maller J, Daly MJ. Haploview: Analysis and visualization of LD and haplotype maps. Bioinformatics. 2005;21:263–265. doi: 10.1093/bioinformatics/bth457. [DOI] [PubMed] [Google Scholar]
- Bersaglieri T, Sabeti PC, Patterson N, Vanderploeg T, Schaffner SF, Drake JA, Rhodes M, Reich DE, Hirschhorn JN. Genetic signatures of strong recent positive selection at the lactase gene. Am J Hum Genet. 2004;74:1111–1120. doi: 10.1086/421051. [DOI] [PMC free article] [PubMed] [Google Scholar]
- Bienzle U, Eggelte TA, Adjei LA, Dietz E, Ehrhardt S, Cramer JP, Otchwemah RN, Mockenhaupt FP. Short Communication: Limited influence of haptoglobin genotypes on severe malaria in Ghanaian children. Trop Med Int Health. 2005;10:668–671. doi: 10.1111/j.1365-3156.2005.01444.x. [DOI] [PubMed] [Google Scholar]
- Biswas S, Akey JM. Genomic insights into positive selection. Trends Genet. 2006;22:437–446. doi: 10.1016/j.tig.2006.06.005. [DOI] [PubMed] [Google Scholar]
- Carter K, Worwood M. Haptoglobin: A review of the major allele frequencies worldwide and their association with diseases. Int J Lab Hematol. 2007;29:92–110. doi: 10.1111/j.1751-553X.2007.00898.x. [DOI] [PubMed] [Google Scholar]
- Dobson MJ. Malaria in England: A geographical and historical perspective. Parassitologia. 1994;36:35–60. [PubMed] [Google Scholar]
- Elagib AA, Kider AO, Akerstrom B, Elbashir MI. Association of the haptoglobin phenotype (1–1) with falciparum malaria in Sudan. Trans R Soc Trop Med Hyg. 1998;92:309–311. doi: 10.1016/s0035-9203(98)91025-2. [DOI] [PubMed] [Google Scholar]
- Gabriel SB, Schaffner SF, Nguyen H, Moore JM, Roy J, Blumenstiel B, Higgins J, DeFelice M, Lochner A, Faggart M, Liu-Cordero SN, Rotimi C, Adeyemo A, Cooper R, Ward R, Lander ES, Daly MJ, Altshuler D. The structure of haplotype blocks in the human genome. Science. 2002;296:2225–2229. doi: 10.1126/science.1069424. [DOI] [PubMed] [Google Scholar]
- Garby L, Noyes WD. Studies on hemoglobin metabolism.1. Kinetic properties of the plasma hemoglobin pool in normal man. J Clin Invest. 1959;38:1479–1483. doi: 10.1172/JCI103925. [DOI] [PMC free article] [PubMed] [Google Scholar]
- Gaunt TR, Rodriguez S, Zapata C, Day INM. MIDAS: Software for analysis and visualisation of interallelic disequilibrium between multiallelic markers. BMC Bioinform. 2006;7:1–11. doi: 10.1186/1471-2105-7-227. [DOI] [PMC free article] [PubMed] [Google Scholar]
- Golding J, Pembrey M, Jones R The Alspac Study Team. ALSPAC-The avon longitudinal study of parents and children. Paediatric Perinatal Epidemiol. 2001;15:74–87. doi: 10.1046/j.1365-3016.2001.00325.x. [DOI] [PubMed] [Google Scholar]
- Guthrie PA, Gaunt TR, Abdollahi MR, Rodriguez S, Lawlor DA, Smith GD, Day IN. Amplification ratio control system for copy number variation genotyping. Nucleic Acids Res. 2011;39:1–12. doi: 10.1093/nar/gkr046. [DOI] [PMC free article] [PubMed] [Google Scholar]
- Imrie H, Ferguson DJP, Day KP. Human serum haptoglobin is toxic to Plasmodium falciparum in vitro. Mol Biochem Parasitol. 2004;133:93–98. doi: 10.1016/j.molbiopara.2003.07.007. [DOI] [PubMed] [Google Scholar]
- Kehrer-Sawatzki H. What a difference copy number variation makes. Bioessays. 2007;29:311–313. doi: 10.1002/bies.20554. [DOI] [PubMed] [Google Scholar]
- Kristiansen M, Graversen JH, Jacobsen C, Sonne O, Hoffman HJ, Law SKA, Moestrup SK. Identification of the haemoglobin scavenger receptor. Nature. 2001;409:198–201. doi: 10.1038/35051594. [DOI] [PubMed] [Google Scholar]
- Kwiatkowski DP. How malaria has affected the human genome and what human genetics can teach us about malaria. Am J Hum Genet. 2005;77:171–192. doi: 10.1086/432519. [DOI] [PMC free article] [PubMed] [Google Scholar]
- Langlois MR, Delanghe JR. Biological and clinical significance of haptoglobin polymorphism in humans. Clin Chem. 1996;42:1589–1600. [PubMed] [Google Scholar]
- Levy AP, Hochberg I, Jablonski K, Resnick HE, Lee ET, Best L, Howard BV. Haptoglobin phenotype is an independent risk factor for cardiovascular disease in individuals with diabetes: The strong heart study. J Am College Cardiol. 2002;40:1984–1990. doi: 10.1016/s0735-1097(02)02534-2. [DOI] [PubMed] [Google Scholar]
- Levy AP, Levy JE, Kalet-Litman S, Miller-Lotan R, Levy NS, Asaf R, Guetta J, Yang C, Purushothaman KR, Fuster V, Moreno PR. Haptoglobin genotype is a determinant of iron, lipid peroxidation, and macrophage accumulation in the atherosclerotic plaque. Arterioscler Thromb Vasc Biol. 2007;27:134–140. doi: 10.1161/01.ATV.0000251020.24399.a2. [DOI] [PubMed] [Google Scholar]
- Maeda N, Yang FM, Barnett DR, Bowman BH, Smithies O. Duplication within the haptoglobin Hp2 gene. Nature. 1984;309:131–135. doi: 10.1038/309131a0. [DOI] [PubMed] [Google Scholar]
- McDermid JM, Prentice AM. Iron and infection: Effects of host iron status and the iron-regulatory genes haptoglobin and NRAMP1 (SLC11A1) on host-pathogen interactions in tuberculosis and HIV. Clin Sci. 2006;110:503–524. doi: 10.1042/CS20050273. [DOI] [PubMed] [Google Scholar]
- Okazaki T, Yanagisawa Y, Nagai T. Analysis of the affinity of each haptoglobin polymer for hemoglobin by two-dimensional affinity electrophoresis. Clin Chim Acta. 1997;258:137–144. doi: 10.1016/s0009-8981(96)06468-6. [DOI] [PubMed] [Google Scholar]
- Reiter P. From Shakespeare to Defoe: Malaria in England in the little ice age. Emerg Infect Dis. 2000;6:1–11. doi: 10.3201/eid0601.000101. [DOI] [PMC free article] [PubMed] [Google Scholar]
- Rodriguez S, Gaunt TR, Day IN. Hardy-Weinberg equilibrium testing of biological ascertainment for Mendelian randomization studies. Am J Epidemiol. 2009;169:505–514. doi: 10.1093/aje/kwn359. [DOI] [PMC free article] [PubMed] [Google Scholar]
- Sabeti PC, Reich DE, Higgins JM, Levine HZ, Richter DJ, Schaffner SF, Gabriel SB, Platko JV, Patterson NJ, McDonald GJ, Ackerman HC, Campbell SJ, Altshuler D, Cooper R, Kwiatkowski D, Ward R, Lander ES. Detecting recent positive selection in the human genome from haplotype structure. Nature. 2002;419:832–837. doi: 10.1038/nature01140. [DOI] [PubMed] [Google Scholar]
- Slatkin M, Rannala B. Estimating allele age. Annu Rev Genomics Hum Genet. 2000;1:225–249. doi: 10.1146/annurev.genom.1.1.225. [DOI] [PubMed] [Google Scholar]
- Stephens M, Donnelly P. A comparison of Bayesian methods for haplotype reconstruction from population genotype data. Am J Hum Genet. 2003;73:1162–1169. doi: 10.1086/379378. [DOI] [PMC free article] [PubMed] [Google Scholar]
- Tian C, Kosoy R, Nassir R, Lee A, Villoslada P, Klareskog L, Hammarstrom L, Garchon HJ, Pulver AE, Ransom M, Gregersen PK, Seldin MF. European population genetic substructure: Further definition of ancestry informative markers for distinguishing among diverse European ethnic groups. Mol Med. 2009;15:371–383. doi: 10.2119/molmed.2009.00094. [DOI] [PMC free article] [PubMed] [Google Scholar]
- Timpson NJ, Tobias JH, Richards JB, Soranzo N, Duncan EL, Sims AM, Whittaker P, Kumanduri V, Zhai G, Glaser B, Eisman J, Jones G, Nicholson G, Prince R, Seeman E, Spector TD, Brown MA, Peltonen L, Smith GD, Deloukas P, Evans DM. Common variants in the region around Osterix are associated with bone mineral density and growth in childhood. Hum Mol Genet. 2009;18:1510–1517. doi: 10.1093/hmg/ddp052. [DOI] [PMC free article] [PubMed] [Google Scholar]
- Tishkoff SA, Verrelli BC. Patterns of human genetic diversity: Implications for human evolutionary history and disease. Annu Rev Genomics Hum Genet. 2003;4:293–340. doi: 10.1146/annurev.genom.4.070802.110226. [DOI] [PubMed] [Google Scholar]
- Weir BS, Cockerham CC. Estimating F-statistics for the analysis of population structure. Evolution. 1984;38:1358–1370. doi: 10.1111/j.1558-5646.1984.tb05657.x. [DOI] [PubMed] [Google Scholar]
- Yang FM, Brune JL, Baldwin WD, Barnett DR, Bowman BH. Identification and characterization of human haptoglobin Cdna. Proc Natl Acad Sci USA-Biol Sci. 1983;80:5875–5879. doi: 10.1073/pnas.80.19.5875. [DOI] [PMC free article] [PubMed] [Google Scholar]
- Zapata C, Rodríguez S, Visedo G, Sacristán F. Spectrum of nonrandom associations between microsatellite loci on human chromosome 11p15. Genetics. 2001;158:1235–1251. doi: 10.1093/genetics/158.3.1235. [DOI] [PMC free article] [PubMed] [Google Scholar]
- Zaykin DV, Westfall PH, Young SS, Karnoub MA, Wagner MJ, Ehm MG. Testing association of statistically inferred haplotypes with discrete and continuous traits in samples of unrelated individuals. Human Heredity. 2002;53:79–91. doi: 10.1159/000057986. [DOI] [PubMed] [Google Scholar]
Associated Data
This section collects any data citations, data availability statements, or supplementary materials included in this article.
Supplementary Materials
ARCS assay for HP duplicon junction CNV.
LD statistics for all pairwise comparisonsinvolving the HP CNV and neighbouring SNPs in a 2 Mbinterval centred on the HP CNV.
Pairwise FST observed between ALSPAC and worldwide populations with HP CNV allelic frequencies described by Carter and Worwood (2007).
Interallelic LD and descriptives for allpairwise comparisons involving the HP CNV and SNPs ∼2Mb apartcentred on the HP CNV.