

Abstract
Understanding mechanisms that lead to selective motor neuron degeneration requires visualization and cellular identification of vulnerable neurons. Here we report generation and characterization of UCHL1-eGFP and hSOD1G93A-UeGFP mice, novel reporter lines for cortical and spinal motor neurons. Corticospinal motor neurons (CSMN) and a subset of spinal motor neurons (SMN) are genetically labeled in UCHL1-eGFP mice, which express eGFP under the UCHL1 promoter. eGFP expression is stable and continues through P800 in vivo. Retrograde labeling, molecular marker expression, electrophysiological analysis, and cortical circuit mapping confirmed CSMN identity of eGFP+ neurons in the motor cortex. Anatomy, molecular marker expression, and electrophysiological analysis revealed that the eGFP expression is restricted to a subset of small-size SMN that are slow-twitch α and γ motor neurons. Crossbreeding of UCHL1-eGFP and hSOD1G93A lines generated hSOD1G93A-UeGFP mice, which displayed the disease phenotype observed in a hSOD1G93A mouse model of ALS. eGFP+ SMN showed resistance to degeneration in hSOD1G93A-UeGFP mice, and their slow-twitch α and γ motor neuron identity was confirmed. In contrast, eGFP+ neurons in the motor cortex of hSOD1G93A-UeGFP mice recapitulated previously reported progressive CSMN loss and apical dendrite degeneration. Our findings using these two novel reporter lines revealed accumulation of autophagosomes along the apical dendrites of vulnerable CSMN at P60, early symptomatic stage, suggesting autophagy as a potential intrinsic mechanism for CSMN apical dendrite degeneration.
Introduction
Selective in vivo labeling of neuron populations that degenerate in diseases is a primary step toward understanding mechanisms responsible for their vulnerability. Indeed, the complexity and cellular heterogeneity of the CNS limit cell-type specific analysis of neuron populations of interest, which may seem insignificant in numbers and are dispersed in different areas of the CNS.
Introduction of the GFP gene as a nontoxic, heritable genetic trait in reporter mouse lines has been revolutionary (Chalfie et al., 1994). Spectral variants of GFP (XFP) under the control of the Thy1 promoter (Feng et al., 2000) are widely used to label, characterize, and study distinct populations of cortical neurons (Oray et al., 2004; Bareyre et al., 2005; Fukuda et al., 2006; Sugino et al., 2006; Yu et al., 2008). Crossbreeding of Thy1-YFP lines with the ALS mouse model (Gurney et al., 1994; Özdinler et al., 2011), which carries the SOD1G93A mutation identified in ALS patients (Rosen et al., 1993), revealed early neuromuscular junction (NMJ) defects (Frey et al., 2000; Schaefer et al., 2005) and progressive corticospinal tract (CST) degeneration (Özdinler et al., 2011). However, currently available reporter lines are not ideally suited to study the cellular/molecular mechanisms involved in motor neuron degeneration because of labeling of mixed neuron populations in the motor cortex, developmental variability, and instability of expression (Miles et al., 2004; Yu et al., 2008; Porrero et al., 2010).
In an effort to visualize and differentiate the components of the motor neuron circuitry that are vulnerable in ALS, we took advantage of long-term and stable ubiquitin carboxy-terminal hydrolase L1 (UCHL1) expression. UCHL1 is a deubiquitinating enzyme with hydrolase and ligase activities (Liu et al., 2002), and its expression is mostly restricted to large pyramidal neurons in layer 5 of the cerebral cortex (Lein et al., 2007). In addition, patients with mutations in the UCHL1 gene display movement disorders, with upper motor neuron involvement (Bilguvar et al., 2013), and UCHL1 function is important for corticospinal motor neuron (CSMN) health and stability (Özdinler lab, unpublished data). Therefore, we generated UCHL1-eGFP mice, which express eGFP under the UCHL1 promoter.
Here we report generation and characterization of two novel reporter lines as a tool to study precise aspects of selective motor neuron vulnerability. eGFP expression is stable through P800 in the UCHL1-eGFP mice and is restricted to CSMN in the motor cortex. Interestingly, only a subset of spinal motor neurons (SMN) is genetically labeled. The hSOD1G93A-UeGFP line, generated by crossbreeding UCHL1-eGFP with hSOD1G93A mice, displayed previously reported ALS-like phenotype (Gurney et al., 1994; Özdinler et al., 2011), showed vacuolated CSMN apical dendrites (Jara et al., 2012), and confirmed that genetic labeling is restricted to a subset of slow-twitch α and γ motor neurons resistant to degeneration in ALS. Similar to previous findings that report contribution of autophagy in SMN degeneration in ALS mouse models and patients (Morimoto et al., 2007; Li et al., 2008; Sasaki, 2011), we find autophagosome accumulation within the apical dendrites of vulnerable CSMN, suggesting autophagy as an intrinsic mechanism for CSMN apical dendrite degeneration.
Materials and Methods
Mice
All animal procedures were approved by the Northwestern University Animal Care and Use committee and comply with the standards of the National Institutes of Health. In this study, WT, Hb9-eGFP, and hSOD1G93A mice (The Jackson Laboratory), and UCHL1-eGFP reporter mice of either sex (generated at Northwestern Targeted Mutagenesis Core facility) were used. All mice were on C57BL/6 background.
Generation of UCHL1-eGFP reporter mice
A BAC clone encoding the UCHL1-eGFP (see Fig. 1A) was generated at GENSAT Project (www.gensat.org) and purchased from CHORI (Bx637(22223)). Endonuclease-free large-scale DNA isolation was performed by double acetate precipitation and CsCl gradient separation. After the DNA quality and concentration were checked on pulse-field gel, the BAC DNA construct (1 ng/μl) was directly injected into ∼200 pronuclei of fertilized oocytes of C57BL/6 mice (Northwestern University, Targeted Mutagenesis Core facility). Newborn pups postnatal day (P) 0–P3 were initially screened with green fluorescent protein light (BlueStar GFP, NightSea) for eGFP expression in the spinal cord and prefrontal cortex. Tail DNA was analyzed to detect eGFP by PCR using forward 5′-CCTACGGCGTGCAGTGCTTCAGC-3′ and reverse 5′-CGGCGAGCTGCACGCTGCCGTCCTC-3′ primers. Expression profile was further determined by detailed histological analysis. Nine lines (G1, G2, G3, G4, G5, G6, G7, G8, and G9) were positive for eGFP as detected by PCR. The eGFP expression profile was investigated by sectioning entire cortex in pups (P4-P21) for >6 consecutive generations. G3, G4, and G6 lines were positive for eGFP by PCR but did not generate progeny that expressed eGFP and were discarded. G2 and G8 lines had ectopic eGFP expression that showed variation in expression level from litter to litter and were discarded. The G9 line had relatively weak layer 5-specific expression and was cryopreserved. G1, G5, and G7 lines showed strong eGFP expression that was evident with consistent pattern and intensity of expression from litter to litter for >8 generations and were chosen for further analysis. One of the founders was analyzed at P800 to investigate the stability of gene expression in a mouse that is >2 years old.
Figure 1.
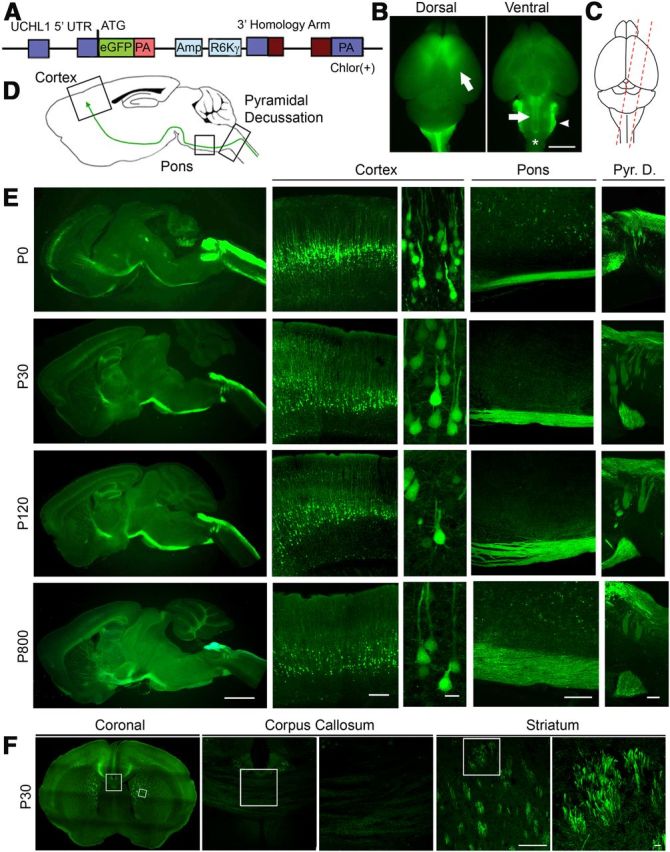
Cellular and anatomical labeling of large layer 5 pyramidal neurons in UCHL1-eGFP transgenic mice. A, Drawing of BAC construct used to generate UCHL1-eGFP reporter mice. UCHL1 promoter, 5′ UTR; Amp, ampicillin; R6Kγ, origin of replication; PA, poly-adenylated tail; eGFP, enhanced green fluorescent protein; Chlor (+), chloramphenicol; UTR, untranslated region. B, Dorsal view shows eGFP expression restricted mainly to prefrontal cortex, including motor cortex (left). Ventral view shows axon bundles of subcerebral projection neurons (SCPN; arrow and star), and brainstem trigeminal ganglion tract (right; arrowhead). C, Sagittal sections are taken with a 15° angle to include motor cortex, pons, and cervical spinal cord in one plane (right). D, Drawing of a sagittal section. Boxed areas represent motor cortex, pons, and pyramidal decussation (Pyr. D.). E, Images of sagittal sections isolated from P0, P30, P120, and P800 brains. D, Confocal images of boxed areas (motor cortex, pons, and Pyr. D.) are enlarged to the right. F, Image of a coronal section at P30. Corpus callosum and striatum are enlarged to the right. eGFP+ axon fibers are detected in the striatum, but not corpus callosum. Images represent intrinsic eGFP expression without immunocytochemical enhancement. Scale bars: B, 3 mm; E (left to right), 2 mm, 250 μm, 20 μm, 200 μm, 200 μm; F, 200 μm, 20 μm.
Generation of hSOD1G93A-UeGFP mice
Transgenic hemizygous males expressing high copy number of human SOD1 gene with the G93A mutation (B6SJL-Tg(SOD1*G93A)1Gur/J; The Jackson Laboratory) were bred to hemizygous UCHL1-eGFP females (lines G5 and G7) to generate hSOD1G93A-UeGFP and WT-UeGFP (control) mice. Transgenic mice were identified by PCR amplification of DNA extracted from tail as previously described (Rosen et al., 1993). Mice at P30 (presymptomatic), P60 (early symptomatic), P90 (symptomatic), and P120 (end-stage) were used for analysis.
Histology
Neonatal and adult mice were deeply anesthetized using ketamine (90 mg/kg) with xylazine (10 mg/kg), and transcardially perfused with 4% PFA in PBS. The brains and spinal cords were removed intact and postfixed (4% PFA, overnight) and stored in PBS with sodium azide (0.01%) at 4°C. Sections were cut in sagittal (100 and/or 50 μm) or coronal (50 μm) planes using a vibratome (Leica) and collected in 12-well plates. Sections were either used directly for imaging or were processed for immunocytochemical analysis. For NMJ analysis, gastrocnemius muscle was isolated, cryoprotected, embedded in OCT (Sakura Finetek), and 10 μm parallel sections were collected in series using a CM 3050S cryostat (Leica).
Immunocytochemistry and cellular staining
The antibodies were purchased from Millipore unless otherwise stated. Antibodies used are as follows: anti-calbindin (1:1000), anti-calretinin (1:1000), anti-ChAT (1:500), anti-Crym (1:500; Sigma), anti-Ctip2 (1:500, Abcam), anti-Err3 (1:500, R&D Systems), anti-GFP (1:1000, Invitrogen; or 1:1000, Abcam), anti-LC3B (1:1000, Invitrogen), anti-Satb2 (1:1000), and anti-UCHL1 (1:1000). Antigen retrieval was performed for anti-Ctip2 and anti-Err3 immunocytochemistry (Zhao et al., 2007). Briefly, sections were treated with 5 mm dithiothreitol and 0.1% SDS in Tris-buffered saline for 30 min followed by washes with PBS and incubation in 0.01 m sodium citrate, pH 9.0, at 75°C water bath for 3 h before application of blocking solution (PBS, 0.05% BSA, 2% FBS, 1% Triton X-100, and 0.1% saponin) and incubation with primary antibody solution overnight at 4°C. Appropriate secondary fluorescent antibodies (1:1000, AlexaFluor-488-conjugated, Invitrogen; FITC-conjugated, Invitrogen; or Cy3-conjugated) were added to blocking solution at room temperature for 2 h in the dark. AlexaFluor-555-conjugated α-bungarotoxin (1:500; Invitrogen) was included in the primary antibody solution to label NMJ when appropriate.
Retrograde labeling surgeries
All retrograde labeling surgeries were performed at P21, in WT and UCHL1-eGFP mice. After surgery, mice were allowed to recover and were perfused at P30. Brains and spinal cords were isolated as described above.
CSMN labeling.
CSMN were retrogradely labeled by injection of either red fluorescent microspheres (LumaFluor) or Fluoro-Gold (FG; Fluorochrome) into the CST that lies within the dorsal funiculus of the cervical spinal cord, as previously described (Özdinler et al., 2011). Briefly, mice were deeply anesthetized with isoflurane and placed into a stereotaxic apparatus. A small laminectomy at the cervical spinal cord (C2-C3) level was performed to expose the vertebrae and the spinal cord. Using pulled and beveled glass micropipettes, an ∼0.3-mm-deep single pressure microinjection of red fluorescent microspheres (276 nl) or FG (96 nl) into the dorsal funiculus of the spinal cord was performed using a nanojector (Nanoject II, Drummond Scientific) at a speed of 46 nl/s.
Callosal projection neuron (CPN) labeling.
CPN were retrogradely labeled by direct injection of red fluorescent microspheres into the contralateral hemisphere. Briefly, mice deeply anesthetized with isoflurane were placed into a stereotaxic platform, and a ∼5 mm2 craniotomy targeting the motor cortex of the left hemisphere was performed using a microdrill (Fine Science Tools; coordinates 0.5 mm anterior from bregma, 1.5 mm lateral from the midline). To label all layers of motor cortex, red fluorescent microspheres (32 nl) were injected at 0.75 mm and 0.5 mm depth. Twelve injections were performed on the left hemisphere to achieve an even labeling of CPN in the right hemisphere. For double labeling, CSMN surgeries were performed the same day after CPN surgery.
Data collection and imaging
Low-magnification images were acquired using an Eclipse TE2000-E (Nikon) for qualitative analysis of GFP expression pattern at different ages. An Axioplan 2 microscope (Carl Zeiss) was used to image and collect Z-stack images of motor cortex, striatum, pons, and pyramidal decussation at P0, P30, P120, and P800. Z-stacks were processed using ImageJ (National Institutes of Health) to generate maximum intensity projections. In addition, a 510 Meta confocal microscope (Carl Zeiss) and a TCS SP5 confocal microscope (Leica) were used for high-magnification images and immunocytochemical colocalization analyses.
Electrophysiological recordings of CSMN
Slice preparation.
Brain slices were prepared at P21 as previously described (Anderson et al., 2010). Coronal slices (tilted rostrally 10–15° angle, 300 μm thick) containing primary motor cortex were prepared by vibratome-sectioning of the brain (HM 650 V, Microm) in chilled cutting solution (110 mm choline chloride, 25 mm NaHCO3, 25 mm d-glucose, 11.6 mm sodium ascorbate, 7 mm MgSO4, 3.1 mm sodium pyruvate, 2.5 mm KCl, 1.25 mm NaH2PO4, and 0.5 mm CaCl2). Slices were transferred to artificial CSF (ACSF, 127 mm NaCl, 25 mm NaHCO3, 25 mm d-glucose, 2.5 mm KCl, 1 mm MgCl2, 2 mm CaCl2, and 1.25 mm NaH2PO4, aerated with 95% O2/5% CO2) at 34°C-35°C for 30 min. Slices were subsequently incubated in ACSF at 22°C for least 1 h before electrophysiological recordings.
Electrophysiology.
Slices were transferred to the recording chamber of an upright microscope (BX51, Olympus) and held in place with short pieces of flattened gold wire. Fluorescently labeled neurons were visualized using epifluorescence optics. Whole-cell recordings were performed using pipettes fabricated from borosilicate capillaries with filaments (Warner Instruments), filled with intracellular solution (128 mm KMeSO3, 10 mm HEPES, 1 mm EGTA, 4 mm MgCl2, 4 mm ATP, and 0.4 mm GTP, 10 mm phosphocreatine, 3 mm ascorbate, and 0.05 mm Alexa-594, or 488 mm hydrazide, pH 7.3). Recordings of intrinsic properties were performed at 34°C in ACSF with 10 μm NBQX, 10 μm GABAzine, and 5 μm CPP added to block synaptic transmission. Neurons 50–100 μm deep in the slice were targeted for whole-cell current-clamp recordings. If necessary, current was injected to maintain the membrane potential near −70 mV during stimulus protocols. Recordings were filtered at 4 kHz and digitized at 10 kHz. Voltage sag was measured from −70 mV averaging from 2 hyperpolarizing current steps (−100 and −50 pA, 500 ms) in all cells. Percentage voltage sag was calculated as 100 × (Vpeak − Vsteady-state)/(Vpeak).
Laser-scanning photostimulation (LSPS).
Details of the laser scanning microscopy system used for glutamate uncaging have been published (Weiler et al., 2008; Shepherd, 2012). Ephus software was used for hardware control and data acquisition (http://www.ephus.org) (Suter et al., 2010). For LSPS mapping, after establishing a whole-cell recording on a neuron in a brain slice, a low-magnification image of the slice was captured and a stimulus grid (16 × 16, 100 μm spacing) was aligned vertically to the pia and horizontally to the soma. Caged glutamate (MNI-glutamate, Tocris Bioscience) was added to the bath solution (0.2 mm), which contained elevated concentrations of divalent cations (4 mm Ca2+ and 4 mm Mg2+) and an NMDA receptor antagonist (5 μm CPP; Tocris Bioscience) to dampen neuronal excitability; no other synaptic blockers were added. Recordings were performed at 21°C. The power of the ultraviolet laser was set to 20 mW in the specimen plane. During mapping, stimulus sites were visited at 2.5 Hz in a nonraster pattern that avoided the vicinity of recently stimulated sites (Shepherd et al., 2003). Recordings were monitored for series resistance (inclusion criterion, <40 mΩ; mean, ∼25 mΩ). Responses were recorded in voltage-clamp at a holding potential of −70 mV and analyzed off-line to determine the mean depolarization over a 0.05 s poststimulus window. Synaptic input map analysis was performed offline using MatLab routines (Mathworks).
Electrophysiological recordings of SMN
P6-P8 mice were anesthetized with isoflurane, decapitated, and eviscerated. The lumbar spinal cord was quickly removed and embedded in 2.5% w/v agar. Transverse slices (350 μm) were made using the 1000 vibratome (Leica) as described previously (Quinlan et al., 2011). Whole-cell patch-clamp was performed at room temperature on neurons in the lumbar cord using 2–4 mΩ glass electrodes containing (in mm) as follows: 150 Texas red dextran (3000 MW), 138 K-gluconate, 10 HEPES, 5 ATP-Mg, and 0.3 GTP-Li (all from Sigma). Whole-cell patch-clamp measurements were performed using the Multiclamp 700B amplifier (Molecular Devices). Recordings were performed in current and voltage-clamp modes as previously described (Quinlan et al., 2011). In current-clamp, neurons were subjected to depolarizing steps and ramps to test for the frequency–current relationship (Hz/nA) and measure properties of the action potentials (APs; height, threshold, and width at half-peak). Hyperpolarizing steps were also used for testing input resistance, IH (sag), and rebound potentials. The ventrolateral motor neuron pools could be easily visualized in the slice preparation using differential interference contrast optics, and electrodes were positioned above this area. Neurons expressing eGFP were targeted in Hb9-eGFP and UCHL1-eGFP mice, whereas in WT mice because of a lack of fluorescent labeling, only neurons with large soma diameter (>20-μm-long axis) were visually selected. Neurons maintaining a resting potential <−50 mV, an AP height crossing 0 mV and a series resistance of <25 mΩ were used. Neurons were eliminated from analysis if series resistance or resting potential varied >10 mΩ or 10 mV, respectively, throughout the recording period. Data were collected on Winfluor software (University of Strathclyde, Glasgow, Scotland) and analyzed using Spike2 software (Cambridge Electronic Design). Z-stacks were collected using a multiphoton microscope interfaced with a titanium:sapphire infrared pulsed laser (Bio-Rad) set at 820 nm. Emission was collected externally using two multialkali photomultiplier tubes set at optimal voltage-gain-offset. Z-stacks were obtained at 512 × 512 pixels and 1 μm steps. Image analysis was performed using ImageJ and MatLab software (Mathworks).
Quantification
Cortices and spinal cords collected from hSOD1G93A-UeGFP, and littermate control mice (WT-UeGFP) were used for the following quantifications: (1) percentage of retrogradely labeled eGFP+ neurons in the motor cortex of UCHL1-eGFP mice at P30; (2) percentage of eGFP+ neurons expressing specific molecular markers in the motor cortex of UCHL1-eGFP mice at P30; (3) average number of eGFP+ neurons in the motor and somatosensory cortices for each genotype at P30, P60, P90, and P120; (4) percentage of eGFP+ CSMN containing autophagosomes in their apical dendrites in hSOD1G93A-UeGFP and WT-UeGFP mice at P30, P60, P90, and P120; (5) average number of eGFP+ neurons in the spinal cord for each genotype at P30, P60, P90, and P120; (6) percent colocalization of eGFP and ChAT expression in the lumbar and cervical spinal cords of hSOD1G93A-UeGFP and WT-UeGFP mice at P30, P60, P90, and P120; (7) size distribution of SMN in the spinal cords of hSOD1G93A-UeGFP and WT-UeGFP mice at P30, P60, P90, and P120; and (8) percentage of eGFP+ γ motor neurons in the lumbar and cervical spinal cords of hSOD1G93A-UeGFP and WT-UeGFP mice at P30 and P120.
Retrograde labeling and molecular marker colocalization.
Cells containing red fluorescent microspheres, FG, or immunopositive for specific molecular markers were quantified while blinded to eGFP expression in three anatomically matching coronal or sagittal sections from P30 UCHL1-eGFP mice (50 μm thick, n = 3). Total numbers of cells in three separate areas corresponding to a 0.75 mm × 0.75 mm area in the 20× objective field within the motor cortex were counted per section. Data represented total number of neurons and percent colocalization with eGFP expression.
CSMN and subcerebral projection neurons (SCPN) quantification.
In three matching sagittal cerebral cortex sections (50 μm thick, at least ∼600 μm apart), a comparable 1.5 mm × 1.5 mm area in the 10× objective field corresponding to the motor and somatosensory cortices was determined (Paxinos and Franklin, 2001). Total numbers of eGFP+ neurons were counted in one field/section in a total of 3 sections (n = 3 mice). Neurons were counted only if both soma and apical dendrite were visible in the same plane. Data represented average number of neurons ± SEM.
eGFP and LC3B co-immunocytochemistry was performed on three matching sagittal sections spanning the motor cortex (50 μm thick, 600 μm apart) from WT-UeGFP and hSOD1G93A-UeGFP mice (n = 3; P30, P60, P90, and P120). Five areas per section corresponding to a 0.75 mm × 0.75 mm area in the 20× objective were imaged and analyzed. Total numbers of CSMN that contain autophagosomes in the apical dendrites were counted, and results were presented as average percentage of CSMN co-expressing LC3B ± SEM.
SMN quantification.
eGFP+ neurons were quantified in serial sections that span cervical (C1-C7; n = 20 sections) and lumbar (L1-L6; n = 20 sections) spinal cord (50 μm thick sections, each 150 μm apart) of the hSOD1G93A-UeGFP and WT-UeGFP mice at P30 (n = 4), P60 (n = 3), P90 (n = 3), and P120 (n = 6). eGFP+ SMN were counted if the entire cell body and its primary processes were visualized in a single Z-stack projection. Data represent the mean percentage of eGFP+ neurons per section ± SEM.
eGFP/ChAT co-localization.
Twenty serial sections (50 μm thick, 150 μm apart) were used from hSOD1G93A-UeGFP and WT-UeGFP mice at P30 (n = 5), P60 (n = 3), P90 (n = 3), and P120 (n = 6). After eGFP and ChAT immunocytochemistry, all immunopositive neurons located in left and right ventral horns of cervical and lumbar spinal cords were imaged and counted. Results were represented as average percent co-localization ± SEM.
SMN size distribution.
ChAT and eGFP immunocytochemistry was performed on three cervical and three lumbar serial sections selected from hSOD1G93A-UeGFP and WT-UeGFP mice (n = 3) at P30, P60, P90, and P120. A minimum of 150 neurons per each condition were individually traced in Z-stack projection images using ImageJ, and their areas were measured (ImageJ). Total numbers of cells per area were determined (100 μm2 increments). Data were plotted as average percent of cells/area range ± SEM.
Err3/eGFP co-localization.
eGFP and Err3 immunocytochemistry was performed on 10 serial sections from cervical and lumbar spinal cords (50 μm thick, separated by 300 μm) of P30 WT-UeGFP and P120 WT-UeGFP and hSOD1G93A-UeGFP mice (n = 3). Total numbers of eGFP+ and Err3+ cells were counted. Data represent average percent co-localization ± SEM.
Statistical analysis
Analyses were performed using Prism software (GraphPad Software). D'Agostino and Pearson normality test was performed on all datasets. Statistical differences between two groups were determined using either a parametric (Student's t test) or a nonparametric test (Mann–Whitney t test) when appropriate. Statistical differences between more than two groups were determined by one-way ANOVA followed by Tukey's post hoc multiple-comparison test. Statistically significant differences were taken at p < 0.05.
Results
eGFP expression under UCHL1 promoter labels distinct neuron populations
UCHL1-eGFP transgenic mouse lines were generated using a BAC clone constructed at GENSAT (Fig. 1A), and the presence of the eGFP gene was confirmed by PCR. UCHL1 is highly expressed in the peripheral nervous system, which facilitated studies of skin and visceral organ innervation by dorsal root ganglia (DRG) and trigeminal ganglia (TG) axons (Wilson et al., 1988; Schofield et al., 1995). The eGFP expression profile was consistent with previous reports of UCHL1 in TG and DRG confirming the specificity of the transgene expression (data not shown). The dorsal view of the cerebral cortex indicated eGFP expression within the motor cortex (Fig. 1B, arrow), and the ventral view revealed the presence of eGFP+ axon projections. Dorsal trigeminal tract entering the brainstem was labeled with eGFP (arrowhead), as expected. Subcerebral projections from the cortex to the spinal cord contained eGFP expression (arrow; CST), and pyramidal decussation (*) was visible.
We investigated temporal and spatial distribution of eGFP expression in the cortex of UCHL1-eGFP mice, using oblique cortical sections (∼15° angle, Fig. 1C) to visualize motor cortex, pons, and pyramidal decussation in the same plane (Fig. 1D). The location and axonal projection paths of eGFP+ neurons were investigated at P0 (n = 10), P30 (n = 80), P120 (n = 15), and P800 (n = 1; Fig. 1E). eGFP expression was restricted mainly to large pyramidal neurons in the cerebral cortex. CSMN, a subset of SCPN, are located in layer 5 of the motor cortex, whereas SCPN, which carry cognitive, associative, and integrative information, are mainly located in the somatosensory cortex. eGFP+ neurons had large pyramidal soma, a prominent apical dendrite, subcortical axonal projections that passed through the striatum and pons, and entered spinal cord via the pyramidal decussation, similar to CSMN (Fig. 1E). CPN are biologically and developmentally related to CSMN but send axonal projections to the contralateral hemisphere via corpus callosum and do not show initial vulnerability in ALS. To investigate whether CPN express eGFP, in a subset of experiments we analyzed the presence of eGFP+ axons in the corpus callosum (n = 10; Fig. 1F, boxed areas are enlarged to the side). The absence of eGFP+ axons in the corpus callosum, but their presence in the striatum, suggested that in the cerebral cortex of UCHL1-eGFP mice, eGFP is expressed in large pyramidal projection neurons with potential CSMN/SCPN, but not CPN, identity.
Retrograde labeling studies suggest CSMN identity for eGFP+ neurons in motor cortex
To examine the identity of eGFP+ neurons in the motor cortex, we performed a series of retrograde labeling experiments. Injection of red fluorescent microspheres or FG, into the CST that lies within the dorsal funiculus of the cervical spinal cord retrogradely labels CSMN (Fig. 2A–C,E), whereas direct injection of fluorescent microspheres into the cerebral cortex retrogradely labels CPN located on the contralateral hemisphere (Fig. 2D,E). Retrograde labeling of CSMN with red fluorescent microspheres demonstrated complete colocalization of neurons that contain red microspheres with eGFP expression in layer 5 of the motor cortex (100%, n = 95 neurons; Fig. 2B,C,E). However, not all eGFP+ neurons contained red fluorescent microspheres (5%, n = 126 neurons). Because this could be the result of either partial retrograde labeling or a difference in neuron identity, we examined whether retrogradely labeled CPN express eGFP. Direct injection of red fluorescent microspheres into the cerebral cortex retrogradely labeled CPN in UCHL1-eGFP mice; and out of all eGFP+ neurons investigated (n = 264), only one contained red fluorescent microspheres (0.3%; Fig. 2D). Dual retrograde labeling studies further confirmed the absence of red fluorescent microspheres in eGFP+ neurons, which included FG (Fig. 2E). Therefore, our results suggest that eGFP expression is restricted to CSMN and not to CPN in the motor cortex.
Figure 2.

Retrograde labeling studies suggest CSMN identity for eGFP+ neurons in motor cortex. A, Drawing of experimental design. CSMN were retrogradely labeled by red fluorescent microsphere injection into the CST (red arrow, left). CPN were retrogradely labeled by red fluorescent microsphere injection into the contralateral hemisphere (red arrow, middle). CSMN (FG; purple arrow) and CPN (red fluorescent microspheres; red arrow, right) were labeled with two retrograde labeling surgeries. All mice were analyzed at P30. Coronal (B) and sagittal (C) sections are imaged to show colocalization of eGFP+ neurons with red fluorescent microspheres after retrograde labeling from CST. Boxed areas are enlarged to the right. D, eGFP+ neurons located in layer 5 of motor cortex do not contain red fluorescent microspheres after retrograde CPN labeling from the contralateral hemisphere. Boxed areas are enlarged to the right. E, eGFP+ neurons located in layer 5 of motor cortex contain FG, but not red fluorescent microspheres after dual retrograde labeling of CSMN (FG) and CPN (red fluorescent microspheres). Boxed areas are enlarged to the right. Images represent intrinsic eGFP expression without immunocytochemical enhancement. Scale bars (left to right), 1 mm, 250 μm, 50 μm, 50 μm, 50 μm, 20 μm.
Molecular marker expression analysis establishes CSMN/SCPN identity for eGFP+ neurons
To investigate whether eGFP+ neurons share CSMN/SCPN molecular identity, we performed a series of immunocytochemical analyses using molecular markers that are selectively expressed by CSMN in layer 5 of the motor cortex, and more broadly by SCPN outside of the motor cortex, such as Ctip2 and Crym (Arlotta et al., 2005; Molyneaux et al., 2007; Leone et al., 2008). In UCHL1-eGFP mice, 92% of eGFP+ neurons co-expressed UCHL1 (n = 254 neurons; Fig. 3A), and UCHL1 expression was present and stable up to P800. Neurons expressing UCHL1 co-localized with eGFP+ expression, even at this age (Fig. 3B). A total of 94% of eGFP+ neurons in the motor cortex expressed Ctip2 (n = 98 neurons; Fig. 3C), and 90% expressed Crym (n = 93 neurons; Fig. 3D). In striking contrast, expression of Satb2, a molecular marker specific to CPN and excluded from CSMN (Molyneaux et al., 2007), was not detected in eGFP+ neurons (0%, n = 216 neurons; Fig. 3E). These findings further support CSMN identity of eGFP+ neurons in the motor cortex and suggest SCPN identity outside of the motor cortex.
Figure 3.
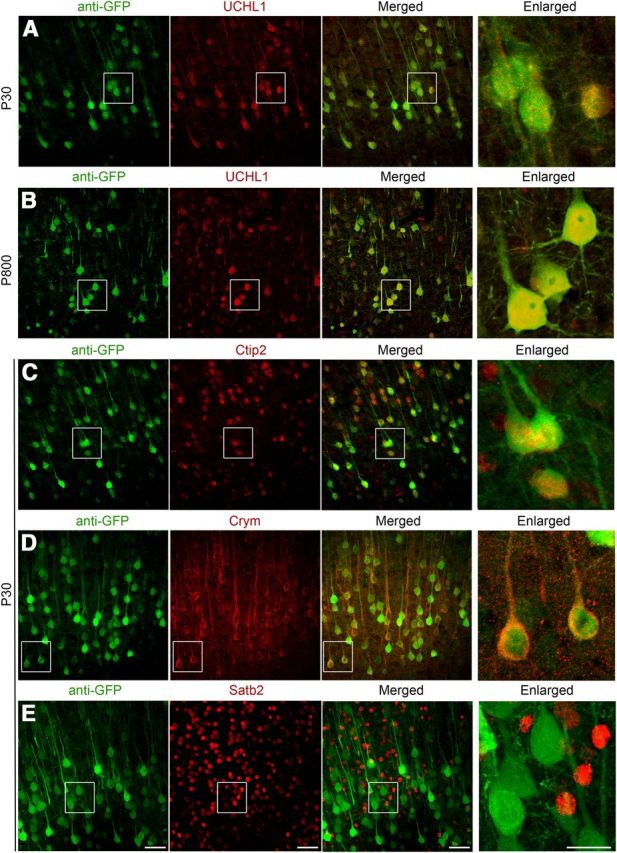
eGFP+ neurons in the motor cortex of UCHL1-eGFP mouse express markers specific to CSMN/SCPN and exclude markers that are expressed by CPN. A–E, eGFP+ neurons located in the motor cortex of UCHL1-eGFP transgenic mouse express UCHL1 at P30 (A), P800 (B), and molecular markers restricted to CSMN/SCPN, such as Ctip2 (C) and Crym (D), but do not express CPN molecular markers, such as Satb2 (E). Boxed areas are enlarged to the right. Confocal images are taken from coronal sections of P30 brain after immunocytochemical labeling. Scale bars, 50 μm; enlarged panel, 20 μm.
Electrophysiological characteristics and mapping of synaptic input consistent with CSMN identity of eGFP+ neurons in motor cortex
Electrophysiological properties of CSMN and their local circuitry have been described recently (Anderson et al., 2010; Sheets et al., 2011; Suter et al., 2012). To investigate whether eGFP+ neurons share neuronal properties and cortical connectivity characteristics of CSMN, we performed a series of electrophysiological recordings from three different neuron populations located in layer 5B of the motor cortex (Fig. 4A,B; n = 9 mice): (1) eGFP+ neurons in the motor cortex of UCHL1-eGFP reporter mice (blue, n = 13 neurons); (2) eGFP+ neurons in UCHL1-eGFP mice, retrogradely labeled with red fluorescent microspheres via CST injection (gray, n = 6 neurons); and (3) CSMN in WT mice, retrogradely labeled with red fluorescent microsphere (red, n = 7 neurons). These three neuron populations did not reveal differences in their subthreshold electrophysiological properties, including input resistance, resting membrane potential (RMP), sag, and rebound (one-way ANOVA followed by a Student's t test; Fig. 4C,D). Similarly, no differences were found in suprathreshold properties, including AP, threshold, slopes of frequency-current (f-I) relationships, AP height, and AP width (one-way ANOVA followed by a Student's t test; Fig. 4E,F).
Figure 4.

eGFP+ neurons in motor cortex display electrophysiological and synaptic circuit properties of CSMN. A, Photomicrographs showing the location of eGFP neurons (green triangle) and CSMN retrogradely labeled with red fluorescent microspheres (triangle with red dots) within layer 5B of motor cortex. B, Drawing of experimental design: UCHL1-eGFP neurons (top, green triangle); retrogradely labeled CSMN in UCHL1-eGFP mouse (middle, green triangle with red dots); retrogradely labeled WT CSMN (bottom, triangle with red dots). C, Representative traces showing subthreshold responses to steps of injected current. D, Quantification of sag, rebound, RMP, and input resistance for eGFP+ neurons (blue), CSMN in UCHL1-eGFP mouse (gray), and WT CSMN (red). E, Representative traces of suprathreshold responses. F, Quantification of AP threshold, Hz/nA, AP height, and AP width in the three types of neurons. G, LSPS mapping of excitatory synaptic inputs. Postsynaptic responses were recorded while stimulating (by glutamate uncaging and LSPS) at multiple presynaptic locations. Traces below correspond to excitatory synaptic inputs from the layer 2/3 region of interest in the upper image (yellow brackets). Layer 2/3 inputs were stronger to eGFP+ neurons (blue traces) than to eGFP− neurons (red traces). H, Average synaptic input maps for eGFP+ (left) and eGFP− (right) neurons. I, J, Quantification of the strength of layer 2/3 input. K, Examples showing differences in subthreshold responses of eGPP+ and eGFP− neurons recorded during LSPS mapping experiments. Quantification of sag (L) and input resistance (M) showing differences between the labeled and unlabeled neurons. *p < 0.05 (Student's t test). Error bars indicate SEM. Scale bars: A, 150 μm; G, 500 μm.
The presence of normal intrinsic properties does not rule out the possibility that synaptic properties are altered. Because in a number of disease models intrinsic properties are preserved despite the presence of large abnormalities in synaptic function (Dani et al., 2005; Qiu et al., 2011), we examined the synaptic circuits of eGFP+ neurons in the motor cortex of UCHL1-eGFP mice. If eGFP+ neurons share properties of CSMN, then they should receive strong excitatory synaptic inputs from neurons located in layer 2/3 as previously documented (Anderson et al., 2010). Glutamate uncaging and LSPS were used to map synaptic inputs to eGFP+ neurons, and neighboring pyramidal neurons that do not express eGFP (eGFP−) (Fig. 4G,H; n = 3 mice). These studies showed that eGFP+ neurons (n = 7 neurons) receive significantly more input from neurons located in layer 2/3 compared with eGFP− neurons (p < 0.05, Student's t test; Fig. 4H,I). All except one eGFP− neuron received less excitatory input from neurons located in layer 2/3 when normalized to its corresponding eGFP+ neuron (Fig. 4J). Subthreshold intrinsic properties (recorded during the mapping experiments) were also significantly different between eGFP+ and eGFP− neurons (p < 0.05, Student's t test; Fig. 4K). Large sag potentials, characteristic of CSMN (Sheets et al., 2011), were present only in eGFP+ neurons (sag percentage 35 ± 5%, n = 7 neurons); however, sag was significantly smaller in eGFP− neurons (8 ± 2%, n = 7 neurons, p < 0.05, Student's t test; Fig. 4L). eGFP+ neurons also displayed significantly smaller input resistance (109 ± 6 mΩ, n = 7 neurons) compared with eGFP− neurons (247 ± 26 mΩ, n = 7 neurons, p < 0.05, Student's t test; Fig. 4M).
These electrophysiological analyses of eGFP+ neurons located in layer 5B of the motor cortex in UCHL1-eGFP mice indicate that their subthreshold and suprathreshold intrinsic properties and their local-circuit excitatory connectivity are in agreement with prior characterizations of CSMN. These data allow us to conclude that eGFP+ neurons in the motor cortex of UCHL1-eGFP mice share CSMN identity.
eGFP expression is restricted to a subset of SMN in the spinal cord
Low-magnification image of the spinal cord revealed the presence of eGFP+ DRG afferents in the dorsal spinal cord (Fig. 5A), as expected. Detailed analysis of cervical and lumbar spinal cords at different stages of development and adulthood (P0, P30, P120, and P800) also revealed the presence of eGFP+ neurons located in the ventral horn (Fig. 5B, boxed area; Fig. 5C, boxed area enlarged to the side). All eGFP+ neurons displayed cellular morphology of SMN and expressed ChAT, a neuronal marker for SMN (Phelps et al., 1990) at all ages investigated (Fig. 5D,E; 100%, n = 3930 neurons; n = 15 mice). However, eGFP+ neurons did not express calbindin (Fig. 5F; 0%, n = 307 neurons) or calretinin (Fig. 5G; 0%, n = 201 neurons), markers for interneurons in the spinal cord (Ren and Ruda, 1994). At P6, ChAT+ neurons expressed eGFP (Fig. 5D). However, eGFP expression became restricted to a subset of SMN by P30 (Fig. 5C).
Figure 5.
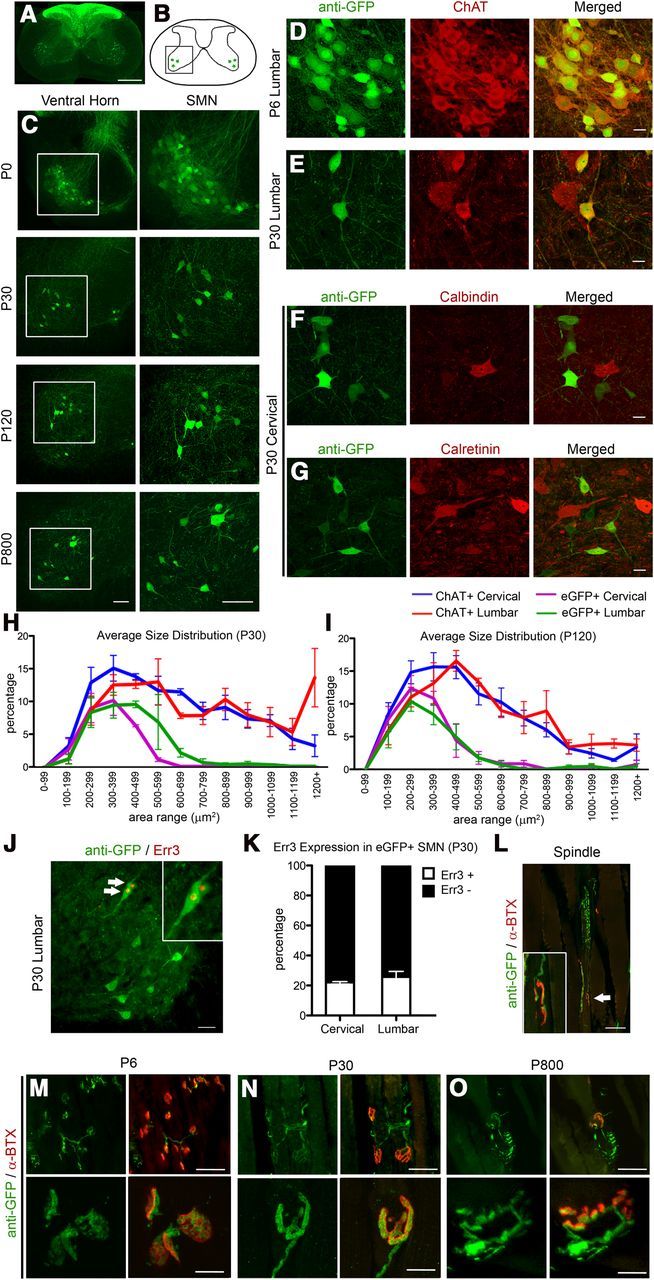
eGFP+ neurons in the spinal cord of UCHL1-eGFP mouse display cellular and molecular characteristics of SMN. A, Axial spinal cord section showing eGFP+ DRG afferents in the dorsal horns and eGFP+ cells in the ventral horns. B, Drawing of spinal cord. Boxed area represents the ventral horn. C, Images of ventral horn at P0, P30, P120, and P800. Boxed areas enlarged to the right. D, E, eGFP+ neurons express ChAT at P6 (D) and at P30 (E). F, G, eGFP+ do not express interneuron markers, such as calbindin (F) and calretinin (G). H, I, Average size distribution of eGFP+ and ChAT+ SMN in cervical and lumbar spinal cord of UCHL1-eGFP mice at P30 (H) and at P120 (I). J, Subset of eGFP+ neurons expresses γ motor neuron marker Err3 (arrows, enlarged in inset). K, Bar graph representation of percentage Err3 expression in eGFP+ SMN at P30. L, Image of a representative eGFP+ γ motor neuron axon (arrow, enlarged in inset) innervating the intrafusal muscle fiber NMJ identified by postsynaptic marker α-bungarotoxin (α-BTX). M–O, Low-magnification (top) and high-magnification (bottom) images of gastrocnemius muscle showing eGFP+ axons innervating extrafusal NMJ at P6 (M), P30 (N), and P800 (O). Scale bars: A, 500 μm; C, 100 μm; D–G, 20 μm; J, L, 50 μm; M–O, 50 μm (top) and 10 μm (bottom).
To determine the percentage of SMN that are genetically labeled with eGFP expression, we performed eGFP and ChAT co-labeling studies in UCHL1-eGFP mice at P30, P60, P90, and P120. A total of 13–16% of SMN expressed eGFP, and there were no differences among percentage distributions of eGFP+ neurons with age (P30, 16 ± 4%, n = 5; P60, 13 ± 4%, n = 3; P90, 13 ± 2%, n = 3; P120, 14 ± 2%, n = 6; one-way ANOVA followed by Tukey's post hoc test).
SMN vary in size, and this helps determine their identity (Kanning et al., 2010). For example, α motor neurons, which innervate extrafusal muscle fibers, are classified as follows: (1) large fast-twitch fatigable (FF); (2) medium fast-twitch fatigue resistant (FR); and (3) small slow-twitch (S). γ motor neurons, which innervate intrafusal muscle fibers in muscle spindles, are the smallest in size. As expected, ChAT+ neurons showed a broad range of size distribution at all ages investigated (P30, Fig. 5H; P120, Fig. 5I; P60 and P90, data not shown), and both cervical and lumbar SMN were similar in their distribution (Fig. 5H,I; blue and red traces).
In contrast, size distribution analyses revealed that eGFP+ SMN were small in size. Large SMN did not express eGFP. Only 0.2–3.2% of eGFP+ neurons were >600 μm2 (Fig. 5 H,I; purple and green traces), suggesting that eGFP+ neurons are not FF-type α motor neurons. Therefore, eGFP+ SMN could be S-type α, γ, or a combination of both. To distinguish between these possibilities, we assayed Err3 expression, a molecular marker expressed by γ, but not α motor neurons (Friese et al., 2009). eGFP+ SMN expressed Err3 (Figure 5J,K, arrows): 22 ± 2% of cervical (n = 309 neurons; n = 3 mice); and 26 ± 5% of lumbar (n = 257 neurons; n = 3 mice), suggesting that eGFP+ SMN were γ and small size α motor neurons.
Additionally, we investigated the presence of eGFP+ axons at the NMJ both in the muscle spindles (intrafusal γ motor neurons; Fig. 5L, area indicated by arrow enlarged in the inset) and at the extrafusal muscle (α motor neurons; P6, Fig. 5M; P30, Fig. 5N; P800 Fig. 5O). The presence of eGFP+ axons innervating both intrafusal (Fig. 5L) and the extrafusal (Fig. 5M–O) NMJ further supported the mixed γ and small size α motor neuron identity of eGFP+ SMN.
eGFP+ neurons display electrophysiological properties of SMN
To investigate whether these eGFP+ neurons show electrophysiological properties of SMN, we performed a series of detailed electrophysiological studies at P6-P8, using parameters previously characterized and optimized for SMN (Quinlan et al., 2011). Electrophysiological properties of individual neurons located in the ventral horn of the lumbar spinal cord in three different mouse lines were studied (n = 19 mice): (1) eGFP+ neurons in UCHL1-eGFP mice (blue, n = 9 neurons); (2) eGFP+ neurons in Hb9-eGFP mice (gray, n = 9 neurons) (Miles et al., 2004); and (3) visually identified SMN, selected based on size in nontransgenic WT mice (red, n = 12 neurons; Fig. 6A,B). Electrophysiological recordings were used to compare established characteristics of SMN in the subthreshold (Fig. 6C,D) and suprathreshold range (Fig. 6E,F) in three groups of neurons. The properties analyzed included input resistances, RMP, sag and rebound currents, f-I relationships (Hz/nA), and AP characteristics (height, duration, and threshold voltage). Hb9-eGFP and UCHL1-eGFP neurons showed equivalent properties in all categories (one-way ANOVA followed by a Student's t test). WT SMN showed comparable results with the exception of a slight difference in the f-I relationship (p = 0.008, one-way ANOVA followed by a Student's t test; Fig. 6F). However, there were no differences in the f-I relationship in SMN of Hb9-eGFP and UCHL1-eGFP mice. These electrophysiological properties confirmed SMN identity of UCHL1-eGFP+ neurons in the spinal cord.
Figure 6.

eGFP+ neurons in the spinal cord of UCHL1-eGFP mouse display electrophysiological characteristics of SMN. A, Lumbar spinal cord showing the location of eGFP+ neurons that are patch-clamped (top panel), targeted for recording (second panel) and filled with Texas Red dextran (third and bottom panel). B, eGFP+ neurons of UCHL1-eGFP mice (blue), eGFP+ neurons in ventral horn in the HB9-eGFP mice (gray), and WT motor neurons identified based on location and size (red) are used for recording. C, Representative traces showing subthreshold properties. D, Sag, current, RMP, rebound current (as percentage of steady state), and whole-cell input resistance. E, Representative traces showing suprathreshold firing properties. F, Voltage threshold, FI slope, AP height, and width show comparable properties between Hb9-eGFP and UCHL1-eGFP neurons, whereas a small difference is observed with WT neurons in FI slope measurements. One-way ANOVA followed Student's t test: *p < 0.001. Error bars indicate SEM. Scale bars (from top to bottom): A, 250 μm, 100 μm.
eGFP+ SMN are more resistant to degeneration in hSOD1G93A-UeGFP mice
hSOD1G93A mice, one of the best characterized ALS mouse models, show progressive cortical and spinal motor neuron degeneration and mimic many aspects of human ALS (Rosen et al., 1993; Gurney et al., 1994; Özdinler et al., 2011). To validate the use of UCHL1-eGFP mouse with respect to motor neuron diseases and to investigate motor neuron biology in mouse models of ALS, we generated hSOD1G93A-UeGFP mice by crossbreeding UCHL1-eGFP with hSOD1G93A lines (Fig. 7A). hSOD1G93A-UeGFP mice develop motor function defects as documented in hSOD1G93A transgenic mice (Hegedus et al., 2007); progressive hindlimb paralysis was observed with disease onset at P40, and reaching end-stage P120. The littermate control mice (named WT-UeGFP) were comparable to WT and UCHL1-eGFP mice; viable with a normal life span, and without any motor function defects.
Figure 7.

eGFP+ neurons are more resistant to degeneration in the spinal cord of hSOD1G93A-UeGFP mice. A, hSOD1G93A transgenic males were mated with UCHL1-eGFP females to generate hSOD1pG93A-UeGFP mice and WT-UeGFP littermate controls. B–I, Representative images of lumbar ventral horns of age-matched WT-UeGFP (B,D,F,G) and hSOD1G93A-UeGFP (C,E,G,I) mice at P30 (B,C), P60 (D,E), P90 (F,G), and P120 (H,I). Boxed areas are enlarged to the right. J, Images of eGFP+ neurons in the ventral horn of lumbar spinal cord expressing ChAT at P30 and P120 in age-matched WT-UeGFP and hSOD1G93A-UeGFP mice. K, Bar graph representation of the average number of eGFP+ SMN in the lumbar spinal cord. L, Bar graph representation of the average eGFP+/ChAT+ co-localization in lumbar spinal cord. M, N, Average size distribution of eGFP+ and ChAT+ SMN in cervical and lumbar spinal cord of age-matched WT-UeGFP and hSOD1G93A-UeGFP mice at P30 (M), and at P120 (N). O, Bar graph representation of percentage Err3 expression in eGFP+ SMN in age-matched WT-UeGFP and hSOD1G93A-UeGFP mice at P120. One-way ANOVA followed by Tukey's post hoc multiple-comparison test and Student's t test: *p < 0.05. Error bars indicate SEM. Scale bars: B–J, 100 μm.
Detailed analysis of the ventral horn of the spinal cord (Fig. 7B–I, boxed areas are enlarged to the right) revealed the presence of eGFP+ SMN in both WT-UeGFP and hSOD1G93A-UeGFP mice. The average numbers of eGFP+ SMN were similar and comparable between WT-UeGFP mice at all ages investigated (P30, P60, P90, and P120; Fig. 7B–I, one-way ANOVA with post hoc Tukey's multiple-comparison test). One of the major characteristics of the hSOD1G93A mice is the loss of SMN with age (Gurney et al., 1994; Azzouz et al., 1999). To investigate whether SMN of hSOD1G93A-UeGFP mice undergo similar progressive cellular degeneration, we analyzed co-localization of ChAT and eGFP expression in both lumbar and cervical spinal cords of WT-UeGFP and hSOD1G93A-UeGFP mice at different ages (P30, P60, P90, and P120). ChAT+ neurons showed progressive degeneration only in hSOD1G93A-UeGFP mice, and the difference between the average numbers of ChAT+ SMN in WT-eGFP and hSOD1G93A-UeGFP mice became significant by P90 (44 ± 5% reduction, n = 1112 neurons; p < 0.05; Student's t test). Close examination of ventral horns revealed selective loss of large SMN in the hSOD1G93A-UeGFP mice, especially at P120 (Fig. 7J). In contrast, eGFP+ neurons did not show significant cell loss (Fig. 7J). Average numbers of eGFP+ neurons were similar between WT-eGFP and hSOD1G93A-UeGFP mice at P30, P60, P90, and P120 (Fig. 7K; one-way ANOVA with post hoc Tukey's multiple-comparison test). Additionally, the average percentage of eGFP+ neurons within ChAT+ SMN increased with age, reaching a significant difference by P120 (32 ± 6%, n = 1424, p < 0.05; Student's t test; Fig. 7L).
Size distribution analyses also confirmed that eGFP+ SMN (Fig. 7 M,N; green trace) were resistant to degeneration and that mainly large SMN (Fig. 7M,N; red trace) showed selective loss in hSOD1G93A mice. The size distribution pattern of ChAT+ neurons in WT-UeGFP mice remained unaffected (Fig. 7M,N; blue trace). However, selective loss of large SMN shifted the size distribution curve toward smaller SMN. In contrast, the size distribution of eGFP+ neurons did not change with disease progression; and regardless of age and disease stage, eGFP+ neurons were small (100–500 μm2; Fig. 7M,N; green and purple trace) and resistant to degeneration in the hSOD1G93A-UeGFP mice. Previous studies report that not all SMN are equally vulnerable to degeneration in ALS: large-size FF α motor neurons degenerate first, followed by FR, and S-type small α motor neurons together with γ motor neurons are most resistant to degeneration (Kawamura et al., 1981; Sobue et al., 1981; Kanning et al., 2010). This further supports our finding that eGFP+ SMN are S-type small-size α motor neurons and γ motor neurons.
To investigate whether distribution of Err3 expressing γ motor neurons and α motor neurons that lack Err3 expression changes in hSOD1G93A-UeGFP mice, we quantified the percentage of Err3+ neurons within eGFP+ SMN in both cervical and lumbar spinal cord at P120. The percentage of Err3+ neurons did not show any difference between genotypes, and between cervical (P120 WT-UeGFP mice, 29 ± 1%, n = 190; P120 hSOD1G93A-UeGFP mice, 24 ± 3%, n = 285) and lumbar (26 ± 2%, n = 199; P120 hSOD1G93A-UeGFP mice, 27 ± 4%, n = 346; Fig. 7O) spinal cord. The lack of difference between the distribution of Err3+ and Err3− SMN at P30 (Fig. 5K) and P120 (Fig. 7O) suggests that eGFP+ SMN retain their motor neuron identity and that neither γ nor small size α motor neurons are enriched among the eGFP+ SMN population. Our results confirmed that eGFP+ SMN are α and γ motor neuron subset of SMN that are small in size and are more resistant to degeneration.
CSMN and SCPN show progressive degeneration in hSOD1G93A-UeGFP mice
In hSOD1G93A mice, both the CSMN and SCPN show progressive degeneration (Özdinler et al., 2011). To further investigate whether hSOD1G93A-UeGFP mice recapitulate CSMN/SCPN degeneration, we investigated both motor cortex and somatosensory cortex of WT-UeGFP and hSOD1G93A-UeGFP mice at different stages of disease (P30, P60, P90, and P120; Fig. 8). eGFP+ neurons located in layer 5 of somatosensory cortex express Ctip2, a molecular marker for SCPN outside of the motor cortex (Fig. 8B) (Arlotta et al., 2005). In the motor cortex, the average number of eGFP+ neurons of WT-UeGFP mice did not change with age (P30, n = 330 neurons; P60, n = 315 neurons; P90, n = 369 neurons; P120, n = 290 neurons; one-way ANOVA with post hoc Tukey's multiple-comparison test; Fig. 8C,E,G,I). At P30, eGFP+ neurons of hSOD1G93A-UeGFP (n = 321 neurons) and WT-UeGFP (n = 330 neurons) mice were comparable (n = 3 mice; Student's t test; Fig. 8C,D). However, there was 39 ± 5% reduction at P90 (n = 225, p = 0.0194, Student's t test) and a 58 ± 4% reduction by P120 (n = 122, p = 0.0072, Student's t test, Fig. 8F,H,J,K). These findings were in line with previous reports of progressive CSMN degeneration in the hSOD1G93A transgenic ALS mice (Özdinler et al., 2011), further confirming CSMN identity of eGFP+ neurons in the motor cortex of UCHL1-eGFP mice.
Figure 8.

Progressive degeneration of eGFP neurons in the motor and somatosensory cortex of hSOD1G93A-UeGFP mice. A, Drawing of a sagittal section of WT-UeGFP and hSOD1G93A-UeGFP mice. Boxed areas represent the location of the motor and somatosensory cortices used for quantification and are enlarged in left panels below and to the right. B, eGFP+ neurons located in the somatosensory cortex of UCHL1-eGFP transgenic mouse express Ctip2. C–J, Representative images of eGFP+ neurons in the motor cortex of WT-UeGFP (C,E,G,I) and hSOD1G93A-UeGFP (D,F,H,J) mice. K, Bar graph representation of the average number of eGFP+ neurons in the motor cortex of WT-eGFP and hSOD1G93A-UeGFP mice at P30, P60, P90, and P120. L–S, Representative images of eGFP+ neurons in the somatosensory cortex of WT-UeGFP (L,N,P,R) and hSOD1G93A-UeGFP (M,O,Q,S) mice. T, Bar graph representation of the average number of eGFP+ neurons in the somatosensory cortex of WT-eGFP and hSOD1G93A-UeGFP mice at P30, P60, P90, and P120. One-way ANOVA followed by Tukey's post hoc multiple-comparison test and Student's t test: *p < 0.05; **p < 0.001. Error bars indicate SEM. Scale bars (from left to right): B, 100 μm, 50 μm; C–J, L–S, 100 μm.
SCPN degeneration was reported in hSOD1G93A transgenic mice, especially during disease end-stage, but their progressive degeneration was not studied in detail (Özdinler et al., 2011). The average number of eGFP+ neurons located in somatosensory cortex of WT-UeGFP mice did not change with age (P30, n = 345 neurons; P60, n = 353 neurons; P90, n = 370 neurons; P120, n = 330 neurons, one-way ANOVA with post hoc Tukey's multiple-comparison test; Fig. 8L,N,P,R). In contrast, there was a progressive reduction in eGFP+ neurons in the somatosensory cortex of hSOD1G93A-UeGFP mice. The average number of eGFP+ neurons is reduced by 45 ± 8% by P120 (n = 182 neurons, p = 0.02, Student's t test; Fig. 8S,T). This progressive reduction of average SCPN numbers together with CSMN in the motor cortex strongly suggests SCPN identity of eGFP+ neurons that are located outside of the motor cortex in the UCHL1-eGFP mice.
CSMN apical dendrite degeneration correlates with increased autophagy
CSMN are large projection neurons in the cerebral cortex, with a prominent apical dendrite that extends toward pia. Details of CSMN cytoarchitecture were partially revealed by eGFP immunocytochemistry in both WT-UeGFP and hSOD1G93A-UeGFP mice (Fig. 9A,C). This allowed visualization of vacuolated apical dendrites in CSMN of hSOD1G93A-UeGFP mice, a finding previously reported using AAV-mediated gene delivery approaches in hSOD1G93A mice (Jara et al., 2012). In an effort to gain a mechanistic insight for CSMN apical dendrite degeneration, we investigated expression of LC3B in both WT-UeGFP and hSOD1G93A-UeGFP mice at P30, P60, P90, and P120. LC3B plays a critical role in formation of autophagosomes and is used as a general marker for autophagic membranes (Kirisako et al., 1999). WT-UeGFP CSMN expressed low levels of LC3B (Fig. 9A), and autophagosomes were mainly located within the soma (Fig. 9B). However, LC3B expression was increased in diseased CSMN (Fig. 9D). Vulnerable CSMN expressed high levels of LC3B, especially along apical dendrites, and the percentage of CSMN containing autophagosomes in their apical dendrites increased with age and reached significant levels as early as P60 in the hSOD1G93A-UeGFP mice (48 ± 3% increase between P30, n = 367 neurons and P60; n = 380 neurons; n = 3 mice; p = 0.03; Student's t test; Fig. 9E), and the difference between genotypes remained significant after P60 (P60 WT-UeGFP, 18 ± 6%, n = 753 neurons; P60 hSOD1G93A-UeGFP, 59 ± 2%; n = 380 neurons; p = 0.01; P90 WT-UeGFP, 26 ± 3%, n = 354 neurons; P90 hSOD1G93A-UeGFP, 64 ± 2%; p = 0.0004; P120 WT-UeGFP, 19 ± 2%, n = 375 neurons; P120 hSOD1G93A-UeGFP, 72 ± 2%, n = 488 neurons; p < 0.0001).
Figure 9.

Autophagosome accumulation in the apical dendrites of vulnerable CSMN. A, Representative image of eGFP+ CSMN in the motor cortex of WT-UeGFP mice at P120. B, Autophagosomes are visualized by LC3B expression. C, Representative image of eGFP+ CSMN in the motor cortex of hSOD1G93A-UeGFP mice at P120. The vacuolated apical dendrites of vulnerable CSMN are observed. D, Anti-LC3B immunocytochemistry reveal the presence of autophagosomes, especially along the apical dendrites of eGFP+ CSMN in the motor cortex of hSOD1G93A-UeGFP mice. E, Bar graph representation of average percentage CSMN containing autophagosomes along apical dendrites in WT-eGFP and hSOD1G93A-UeGFP mice at P30, P60, P90, and P120. One-way ANOVA followed by Tukey's post hoc multiple-comparison test and Student's t test: #p < 0.05; *p < 0.05; ***p < 0.0001. Error bars indicate SEM. Scale bar, 20 μm.
Discussion
Here we report generation and characterization of UCHL1-eGFP mouse, a novel reporter line that allows visualization and cellular analysis of CSMN with respect to health and disease. Our findings, based on anatomy, retrograde labeling, molecular marker expression, electrophysiology, and circuit mapping confirm CSMN identity of eGFP+ neurons in the motor cortex. In addition, molecular marker expression, size distribution analysis together with anatomy, and presence of eGFP+ axons in the extrafusal and intrafusal NMJ confirm S-type α and γ motor neuron identity of eGFP+ neurons in the spinal cord. Crossbreeding of UCHL1-eGFP and hSOD1G93A mice, one of the most established mouse models of ALS, generated hSOD1G93A-UeGFP mice. Interestingly, all vulnerable CSMN were genetically labeled, but eGFP expression becomes restricted only to a subset of degeneration-resistant SMN. Therefore, this reporter line would not be suitable for cellular analysis of SMN that undergo progressive degeneration in ALS. However, genetic labeling of CSMN and a subset of degeneration-resistant SMN offer unique advantages for studies investigating the cellular and molecular mechanisms that underlie selective motor neuron vulnerability in ALS and related motor neuron diseases.
The cellular architecture of the cerebral cortex is heterogeneous, and it is difficult to distinguish a specific neuron population from hundreds of different neuronal subtypes. It is critical to achieve a clear identification of neurons that show selective vulnerability in diseases for their precise experimental manipulation and detailed cellular analysis. Well-characterized reporter mouse lines are excellent tools to study cell type-specific vulnerability. Numerous reporter lines have been generated to visualize and study different neuron populations (Feng et al., 2000; Chattopadhyaya et al., 2004; Miles et al., 2004; Jacobs et al., 2007) and have been crossed with various mouse models of diseases in an effort to bring a mechanistic insight into disease initiation and progression. This approach has permitted visualization of interneurons and cortical projection neurons (Sugino et al., 2006) and early developmental stages of corticofugal projection neurons (Jacobs et al., 2007). Careful selection of the promoter to drive reporter gene expression is increasing specificity in cellular labeling and analysis. GENSAT project identified distinct neuronal subtypes in the cortex and spinal cord by systematic expression of GFP under CNS relevant promoters (Gong et al., 2003; Doyle et al., 2008; Schmidt et al., 2012). Currently, glial cells (Nolte et al., 2001), cortical interneurons (Chattopadhyaya et al., 2004), retinal ganglion cells, DRG, and large pyramidal neurons in layer 5 (Feng et al., 2000) are selectively labeled in various reporter lines.
The novel UCHL1-eGFP reporter line generated and characterized in this manuscript is distinct from previously described reporter lines, such as Thy1-XFP (Feng et al., 2000; Miles et al., 2004; Jacobs et al., 2007) in three key features: (1) eGFP expression is persistent and is detected from birth (P0) until late adulthood (P800); (2) eGFP expression is specific to CSMN in the motor cortex as confirmed by multilevel analyses; and (3) small-size S-type α and γ motor neurons that are resistant to degeneration are labeled in the adult spinal cord. These important characteristics set this novel reporter line apart from other lines and provide a unique advantage to study the molecular, genetic, and cellular basis of CSMN vulnerability as well as S-type α and γ motor neuron resistance to degeneration in ALS.
Low levels of endogenous eGFP in axons and dendritic arbors of SMN and CSMN in the UCHL1-eGFP mouse limit detailed NMJ, CST, and dendritic spine analysis in vivo. In contrast, XFP labeling under the Thy1 promoter is well suited for high-level resolution of neuronal cytoarchitecture in vivo (Feng et al., 2000). Dendritic remodeling, dynamics of spine motility and synaptic loss, and electrophysiological properties of genetically labeled neurons have been studied in Thy1-XFP mice (Miles et al., 2004; Oray et al., 2004; Yu et al., 2008). Genetic labeling of CST has allowed visualization of axon collaterals and their monosynaptic contacts with SMN (Bareyre et al., 2005). Crossbreeding of hSOD1G93A and Thy1-YFP mice revealed the timing of CST degeneration in the hSOD1G93A transgenic ALS mice (Özdinler et al., 2011) and reported NMJ defect as an early event in ALS (Schaefer et al., 2005). However, current reporter lines are less suitable to study cellular mechanisms of CSMN degeneration in mouse models of ALS. Genetic labeling in Thy1-YFP mice is present in a subset of CSMN and a small population of CPN, resulting in a mixed population of neurons in the motor cortex. The onset of expression also shows variation among cortical neurons (Yu et al., 2008; Porrero et al., 2010). SMNs and a small population of interneurons are labeled in Hb9-eGFP reporter line, and eGFP expression is downregulated with increasing age (Miles et al., 2004). The variability of XFP expression among different lines limits their use for investigating the precise aspects of motor neuron cell biology in health and disease, especially in the late-onset neurodegenerative diseases.
Stable and long-term expression of UCHL1 in WT motor neurons and in UCHL1-eGFP reporter line suggests involvement of UCHL1 in motor neuron health and function (Özdinler lab, unpublished data). Reports have linked the mutation in UCHL1 gene to motor function defects (Leroy et al., 1998; Bilguvar et al., 2013). UCHL1-eGFP is the first reporter line for CSMN and for a select subset of SMN. CSMN/SCPN degeneration in the hSOD1G93A-UeGFP mouse model recapitulates the reported motor neuron loss in the hSOD1G93A mice (Özdinler et al., 2011). Interestingly, eGFP expression becomes restricted to a distinct subpopulation of SMN at P30 that are small in size and more resistant to degeneration in the hSOD1G93A-UeGFP mice. Not all SMN show a similar level of vulnerability in motor neuron diseases, and large neurons are more susceptible to degeneration. In ALS, large FF-type α motor neurons degenerate first, followed by FR-type α motor neurons and S-type α motor neurons. The most resistant are the γ motor neurons, which innervate the intrafusal fibers of the muscle spindles (Kawamura et al., 1981; Sobue et al., 1981). Based on size distribution and exclusion of Err3 expression, our results indicate the identity of eGFP+ SMN to be ∼25% γ motor neurons and ∼75% S-type α motor neurons. This novel reporter line offers many advantages in studying degeneration-resistant SMN subtypes.
The UCHL1-eGFP and hSOD1G93A-UeGFP mice not only allowed visualization of upper motor neurons but also helped bring a mechanistic insight into their selective vulnerability. Activation of autophagy and accumulation of autophagosomes were previously linked to ALS pathology in the SMN of hSODG93A mice (Morimoto et al., 2007; Li et al., 2008) and patients with sporadic ALS (Sasaki, 2011). Using WT-UeGFP and hSOD1G93A-UeGFP mice, we now show accumulation of autophagosomes along apical dendrites of vulnerable CSMN as early as P60, at a time when approximately half of the CSMN apical dendrites show fragmentation and vacuolation (Jara et al., 2012). Our results, together with previous reports (Morimoto et al., 2007; Li et al., 2008), suggest involvement of autophagy as a common mechanism for both CSMN and SMN vulnerability in ALS.
Our findings characterize UCHL1-eGFP and hSOD1G93A-UeGFP mice, two novel reporter lines that are well suited for cellular analysis of vulnerable CSMN and a subpopulation of degeneration-resistant SMN. Genetic labeling of distinct motor neuron populations will enable their detailed cellular and molecular analysis and will bring an understanding to the mechanisms responsible for variations in their vulnerability and/or selective resistance to degeneration. Such studies are imperative to develop effective and long-term treatment strategies in ALS and other related motor neuron diseases.
Footnotes
This work was supported by the Les Turner ALS Foundation, Wenske Foundation, and Brain Research Foundation (P.H.O.); NIH/ NINDS Grants NS050162 and P30 NS054850–01A1 (C.J.H.); NIH/NINDS Grant NS061963 and Brain Research Foundation (G.M.G.S.); NIH Grant F32 NS063535 (K.A.Q.), NRSA Grant NS066675 (P.L.S.), and NIH MAD Training Grants 5T32AG020506–09 (B.G.) and 5T32AG020506–10 (M.V.Y.); and ALSA Safenowitz postdoctoral fellowship (J.H.J.). We thank Northwestern Targeted Mutagenesis Core facility for generating UCHL1-eGFP transgenic mouse; M. Bohn, J. Kessler, P. Penzes, and L. Binder for generous sharing of their laboratory resources; B. Goossens and D.P. Srivastava for assistance with confocal microscopy; and W. Weber, M.W. Tu, and N.O. Yang for assistance with histology.
The authors declare no competing financial interests.
References
- Anderson CT, Sheets PL, Kiritani T, Shepherd GM. Sublayer-specific microcircuits of corticospinal and corticostriatal neurons in motor cortex. Nat Neurosci. 2010;13:739–744. doi: 10.1038/nn.2538. [DOI] [PMC free article] [PubMed] [Google Scholar]
- Arlotta P, Molyneaux BJ, Chen J, Inoue J, Kominami R, Macklis JD. Neuronal subtype-specific genes that control corticospinal motor neuron development in vivo. Neuron. 2005;45:207–221. doi: 10.1016/j.neuron.2004.12.036. [DOI] [PubMed] [Google Scholar]
- Azzouz M, Krezel W, Dolle P, Vodouhe C, Warter JM, Poindron P, Borg J. Compensatory mechanism of motor defect in SOD1 transgenic mice by overactivation of striatal cholinergic neurons. Neuroreport. 1999;10:1013–1018. doi: 10.1097/00001756-199904060-00022. [DOI] [PubMed] [Google Scholar]
- Bareyre FM, Kerschensteiner M, Misgeld T, Sanes JR. Transgenic labeling of the corticospinal tract for monitoring axonal responses to spinal cord injury. Nat Med. 2005;11:1355–1360. doi: 10.1038/nm1331. [DOI] [PubMed] [Google Scholar]
- Bilguvar K, Tyagi NK, Ozkara C, Tuysuz B, Bakircioglu M, Choi M, Delil S, Caglayan AO, Baranoski JF, Erturk O, Yalcinkaya C, Karacorlu M, Dincer A, Johnson MH, Mane S, Chandra SS, Louvi A, Boggon TJ, Lifton RP, Horwich AL, et al. Recessive loss of function of the neuronal ubiquitin hydrolase UCHL1 leads to early-onset progressive neurodegeneration. Proc Natl Acad Sci U S A. 2013;110:3489–3494. doi: 10.1073/pnas.1222732110. [DOI] [PMC free article] [PubMed] [Google Scholar]
- Chalfie M, Tu Y, Euskirchen G, Ward WW, Prasher DC. Green fluorescent protein as a marker for gene expression. Science. 1994;263:802–805. doi: 10.1126/science.8303295. [DOI] [PubMed] [Google Scholar]
- Chattopadhyaya B, Di Cristo G, Higashiyama H, Knott GW, Kuhlman SJ, Welker E, Huang ZJ. Experience and activity-dependent maturation of perisomatic GABAergic innervation in primary visual cortex during a postnatal critical period. J Neurosci. 2004;24:9598–9611. doi: 10.1523/JNEUROSCI.1851-04.2004. [DOI] [PMC free article] [PubMed] [Google Scholar]
- Dani VS, Chang Q, Maffei A, Turrigiano GG, Jaenisch R, Nelson SB. Reduced cortical activity due to a shift in the balance between excitation and inhibition in a mouse model of Rett syndrome. Proc Natl Acad Sci U S A. 2005;102:12560–12565. doi: 10.1073/pnas.0506071102. [DOI] [PMC free article] [PubMed] [Google Scholar]
- Doyle JP, Dougherty JD, Heiman M, Schmidt EF, Stevens TR, Ma G, Bupp S, Shrestha P, Shah RD, Doughty ML, Gong S, Greengard P, Heintz N. Application of a translational profiling approach for the comparative analysis of central nervous system cell types. Cell. 2008;135:749–762. doi: 10.1016/j.cell.2008.10.029. [DOI] [PMC free article] [PubMed] [Google Scholar]
- Feng G, Mellor RH, Bernstein M, Keller-Peck C, Nguyen QT, Wallace M, Nerbonne JM, Lichtman JW, Sanes JR. Imaging neuronal subsets in transgenic mice expressing multiple spectral variants of GFP. Neuron. 2000;28:41–51. doi: 10.1016/S0896-6273(00)00084-2. [DOI] [PubMed] [Google Scholar]
- Frey D, Schneider C, Xu L, Borg J, Spooren W, Caroni P. Early and selective loss of neuromuscular synapse subtypes with low sprouting competence in motoneuron diseases. J Neurosci. 2000;20:2534–2542. doi: 10.1523/JNEUROSCI.20-07-02534.2000. [DOI] [PMC free article] [PubMed] [Google Scholar]
- Friese A, Kaltschmidt JA, Ladle DR, Sigrist M, Jessell TM, Arber S. γ and α motor neurons distinguished by expression of transcription factor Err3. Proc Natl Acad Sci U S A. 2009;106:13588–13593. doi: 10.1073/pnas.0906809106. [DOI] [PMC free article] [PubMed] [Google Scholar]
- Fukuda Y, Kawano Y, Tanikawa Y, Oba M, Koyama M, Takagi H, Matsumoto M, Nagayama K, Setou M. In vivo imaging of the dendritic arbors of layer V pyramidal cells in the cerebral cortex using a laser scanning microscope with a stick-type objective lens. Neurosci Lett. 2006;400:53–57. doi: 10.1016/j.neulet.2006.02.051. [DOI] [PubMed] [Google Scholar]
- Gong S, Zheng C, Doughty ML, Losos K, Didkovsky N, Schambra UB, Nowak NJ, Joyner A, Leblanc G, Hatten ME, Heintz N. A gene expression atlas of the based on bacterial artificial chromosomes. Nature. 2003;425:917–925. doi: 10.1038/nature02033. [DOI] [PubMed] [Google Scholar]
- Gurney ME, Pu H, Chiu AY, Dal Canto MC, Polchow CY, Alexander DD, Caliendo J, Hentati A, Kwon YW, Deng HX, Chen W, Zhai P, Sufit RL, Siddique T. Motor neuron degeneration in mice that express a human Cu,Zn superoxide dismutase mutation. Science. 1994;264:1772–1775. doi: 10.1126/science.8209258. [DOI] [PubMed] [Google Scholar]
- Hegedus J, Putman CT, Gordon T. Time course of preferential motor unit loss in the SOD1 G93A mouse model of amyotrophic lateral sclerosis. Neurobiol Dis. 2007;28:154–164. doi: 10.1016/j.nbd.2007.07.003. [DOI] [PubMed] [Google Scholar]
- Jacobs EC, Campagnoni C, Kampf K, Reyes SD, Kalra V, Handley V, Xie YY, Hong-Hu Y, Spreur V, Fisher RS, Campagnoni AT. Visualization of corticofugal projections during early cortical development in a tau-GFP-transgenic mouse. Eur J Neurosci. 2007;25:17–30. doi: 10.1111/j.1460-9568.2006.05258.x. [DOI] [PubMed] [Google Scholar]
- Jara JH, Villa SR, Khan NA, Bohn MC, Özdinler PH. AAV2 mediated retrograde transduction of corticospinal motor neurons reveals initial and selective apical dendrite degeneration in ALS. Neurobiol Dis. 2012;47:174–183. doi: 10.1016/j.nbd.2012.03.036. [DOI] [PMC free article] [PubMed] [Google Scholar]
- Kanning KC, Kaplan A, Henderson CE. Motor neuron diversity in development and disease. Annu Rev Neurosci. 2010;33:409–440. doi: 10.1146/annurev.neuro.051508.135722. [DOI] [PubMed] [Google Scholar]
- Kawamura Y, Dyck PJ, Shimono M, Okazaki H, Tateishi J, Doi H. Morphometric comparison of the vulnerability of peripheral motor and sensory neurons in amyotrophic lateral sclerosis. J Neuropathol Exp Neurol. 1981;40:667–675. doi: 10.1097/00005072-198111000-00008. [DOI] [PubMed] [Google Scholar]
- Kirisako T, Baba M, Ishihara N, Miyazawa K, Ohsumi M, Yoshimori T, Noda T, Ohsumi Y. Formation process of autophagosome is traced with Apg8/Aut7p in yeast. J Cell Biol. 1999;147:435–446. doi: 10.1083/jcb.147.2.435. [DOI] [PMC free article] [PubMed] [Google Scholar]
- Lein ES, Hawrylycz MJ, Ao N, Ayres M, Bensinger A, Bernard A, Boe AF, Boguski MS, Brockway KS, Byrnes EJ, Chen L, Chen L, Chen TM, Chin MC, Chong J, Crook BE, Czaplinska A, Dang CN, Datta S, Dee NR, et al. Genome-wide atlas of gene expression in the adult mouse brain. Nature. 2007;445:168–176. doi: 10.1038/nature05453. [DOI] [PubMed] [Google Scholar]
- Leone DP, Srinivasan K, Chen B, Alcamo E, McConnell SK. The determination of projection neuron identity in the developing cerebral cortex. Curr Opin Neurobiol. 2008;18:28–35. doi: 10.1016/j.conb.2008.05.006. [DOI] [PMC free article] [PubMed] [Google Scholar]
- Leroy E, Boyer R, Auburger G, Leube B, Ulm G, Mezey E, Harta G, Brownstein MJ, Jonnalagada S, Chernova T, Dehejia A, Lavedan C, Gasser T, Steinbach PJ, Wilkinson KD, Polymeropoulos MH. The ubiquitin pathway in Parkinson's disease. Nature. 1998;395:451–452. doi: 10.1038/26652. [DOI] [PubMed] [Google Scholar]
- Li L, Zhang X, Le W. Altered macroautophagy in the spinal cord of SOD1 mutant mice. Autophagy. 2008;4:290–293. doi: 10.4161/auto.5524. [DOI] [PubMed] [Google Scholar]
- Liu Y, Fallon L, Lashuel HA, Liu Z, Lansbury PT., Jr The UCH-L1 gene encodes two opposing enzymatic activities that affect α-synuclein degradation and Parkinson's disease susceptibility. Cell. 2002;111:209–218. doi: 10.1016/S0092-8674(02)01012-7. [DOI] [PubMed] [Google Scholar]
- Miles GB, Yohn DC, Wichterle H, Jessell TM, Rafuse VF, Brownstone RM. Functional properties of motoneurons derived from mouse embryonic stem cells. J Neurosci. 2004;24:7848–7858. doi: 10.1523/JNEUROSCI.1972-04.2004. [DOI] [PMC free article] [PubMed] [Google Scholar]
- Molyneaux BJ, Arlotta P, Menezes JR, Macklis JD. Neuronal subtype specification in the cerebral cortex. Nat Rev Neurosci. 2007;8:427–437. doi: 10.1038/nrn2151. [DOI] [PubMed] [Google Scholar]
- Morimoto N, Nagai M, Ohta Y, Miyazaki K, Kurata T, Morimoto M, Murakami T, Takehisa Y, Ikeda Y, Kamiya T, Abe K. Increased autophagy in transgenic mice with a G93A mutant SOD1 gene. Brain Res. 2007;1167:112–117. doi: 10.1016/j.brainres.2007.06.045. [DOI] [PubMed] [Google Scholar]
- Nolte C, Matyash M, Pivneva T, Schipke CG, Ohlemeyer C, Hanisch UK, Kirchhoff F, Kettenmann H. GFAP promoter-controlled EGFP-expressing transgenic mice: a tool to visualize astrocytes and astrogliosis in living brain tissue. Glia. 2001;33:72–86. doi: 10.1002/1098-1136(20010101)33:1<72::AID-GLIA1007>3.0.CO;2-A. [DOI] [PubMed] [Google Scholar]
- Oray S, Majewska A, Sur M. Dendritic spine dynamics are regulated by monocular deprivation and extracellular matrix degradation. Neuron. 2004;44:1021–1030. doi: 10.1016/j.neuron.2004.12.001. [DOI] [PubMed] [Google Scholar]
- Özdinler PH, Benn S, Yamamoto TH, Güzel M, Brown RH, Jr, Macklis JD. Corticospinal motor neurons and related subcerebral projection neurons undergo early and specific neurodegeneration in hSOD1G93A transgenic ALS mice. J Neurosci. 2011;31:4166–4177. doi: 10.1523/JNEUROSCI.4184-10.2011. [DOI] [PMC free article] [PubMed] [Google Scholar]
- Paxinos G, Franklin KBJ. The mouse brain in stereotaxic coordinates. Ed 2. San Diego: Academic; 2001. [Google Scholar]
- Phelps PE, Barber RP, Brennan LA, Maines VM, Salvaterra PM, Vaughn JE. Embryonic development of four different subsets of cholinergic neurons in rat cervical spinal cord. J Comp Neurol. 1990;291:9–26. doi: 10.1002/cne.902910103. [DOI] [PubMed] [Google Scholar]
- Porrero C, Rubio-Garrido P, Avendaño C, Clascá F. Mapping of fluorescent protein-expressing neurons and axon pathways in adult and developing Thy1-eYFP-H transgenic mice. Brain Res. 2010;1345:59–72. doi: 10.1016/j.brainres.2010.05.061. [DOI] [PubMed] [Google Scholar]
- Qiu S, Anderson CT, Levitt P, Shepherd GM. Circuit-specific intracortical hyperconnectivity in mice with deletion of the autism-associated Met receptor tyrosine kinase. J Neurosci. 2011;31:5855–5864. doi: 10.1523/JNEUROSCI.6569-10.2011. [DOI] [PMC free article] [PubMed] [Google Scholar]
- Quinlan KA, Schuster JE, Fu R, Siddique T, Heckman CJ. Altered postnatal maturation of electrical properties in spinal motoneurons in a mouse model of amyotrophic lateral sclerosis. J Physiol. 2011;589:2245–2260. doi: 10.1113/jphysiol.2010.200659. [DOI] [PMC free article] [PubMed] [Google Scholar]
- Ren K, Ruda MA. A comparative study of the calcium-binding proteins calbindin-D28K, calretinin, calmodulin and parvalbumin in the rat spinal cord. Brain Res Brain Res Rev. 1994;19:163–179. doi: 10.1016/0165-0173(94)90010-8. [DOI] [PubMed] [Google Scholar]
- Rosen DR, Siddique T, Patterson D, Figlewicz DA, Sapp P, Hentati A, Donaldson D, Goto J, O'Regan JP, Deng HX. Mutations in Cu/Zn superoxide dismutase gene are associated with familial amyotrophic lateral sclerosis. Nature. 1993;362:59–62. doi: 10.1038/362059a0. [DOI] [PubMed] [Google Scholar]
- Sasaki S. Autophagy in spinal cord motor neurons in sporadic amyotrophic lateral sclerosis. J Neuropathol Exp Neurol. 2011;70:349–359. doi: 10.1097/NEN.0b013e3182160690. [DOI] [PubMed] [Google Scholar]
- Schaefer AM, Sanes JR, Lichtman JW. A compensatory subpopulation of motor neurons in a mouse model of amyotrophic lateral sclerosis. J Comp Neurol. 2005;490:209–219. doi: 10.1002/cne.20620. [DOI] [PubMed] [Google Scholar]
- Schmidt EF, Warner-Schmidt JL, Otopalik BG, Pickett SB, Greengard P, Heintz N. Identification of the cortical neurons that mediate antidepressant responses. Cell. 2012;149:1152–1163. doi: 10.1016/j.cell.2012.03.038. [DOI] [PMC free article] [PubMed] [Google Scholar]
- Schofield JN, Day IN, Thompson RJ, Edwards YH. PGP9.5, a ubiquitin C-terminal hydrolase; pattern of mRNA and protein expression during neural development in the mouse. Brain Res Dev Brain Res. 1995;85:229–238. doi: 10.1016/0165-3806(94)00217-N. [DOI] [PubMed] [Google Scholar]
- Sheets PL, Suter BA, Kiritani T, Chan CS, Surmeier DJ, Shepherd GM. Corticospinal-specific HCN expression in mouse motor cortex: I(h)-dependent synaptic integration as a candidate microcircuit mechanism involved in motor control. J Neurophysiol. 2011;106:2216–2231. doi: 10.1152/jn.00232.2011. [DOI] [PMC free article] [PubMed] [Google Scholar]
- Shepherd GM. Circuit mapping by ultraviolet uncaging of glutamate. Cold Spring Harb Protoc. 2012;2012:998–1004. doi: 10.1101/pdb.prot070664. [DOI] [PMC free article] [PubMed] [Google Scholar]
- Shepherd GM, Pologruto TA, Svoboda K. Circuit analysis of experience-dependent plasticity in the developing rat barrel cortex. Neuron. 2003;38:277–289. doi: 10.1016/S0896-6273(03)00152-1. [DOI] [PubMed] [Google Scholar]
- Sobue G, Matsuoka Y, Mukai E, Takayanagi T, Sobue I. Pathology of myelinated fibers in cervical and lumbar ventral spinal roots in amyotrophic lateral sclerosis. J Neurol Sci. 1981;50:413–421. doi: 10.1016/0022-510X(81)90153-2. [DOI] [PubMed] [Google Scholar]
- Sugino K, Hempel CM, Miller MN, Hattox AM, Shapiro P, Wu C, Huang ZJ, Nelson SB. Molecular taxonomy of major neuronal classes in the adult mouse forebrain. Nat Neurosci. 2006;9:99–107. doi: 10.1038/nn1618. [DOI] [PubMed] [Google Scholar]
- Suter BA, O'Connor T, Iyer V, Petreanu LT, Hooks BM, Kiritani T, Svoboda K, Shepherd GM. Ephus: multipurpose data acquisition software for neuroscience experiments. Front Neural Circuits. 2010;4:100. doi: 10.3389/fncir.2010.00100. [DOI] [PMC free article] [PubMed] [Google Scholar]
- Suter BA, Migliore M, Shepherd GM. Intrinsic electrophysiology of mouse corticospinal neurons: a class-specific triad of spike-related properties. Cereb Cortex. 2012 doi: 10.1093/cercor/bhs184. doi: 10.1093/cercor/bhs184. Advance online publication. Retrieved July 3, 2012. [DOI] [PMC free article] [PubMed] [Google Scholar]
- Weiler N, Wood L, Yu J, Solla SA, Shepherd GM. Top-down laminar organization of the excitatory network in motor cortex. Nat Neurosci. 2008;11:360–366. doi: 10.1038/nn2049. [DOI] [PMC free article] [PubMed] [Google Scholar]
- Wilson PO, Barber PC, Hamid QA, Power BF, Dhillon AP, Rode J, Day IN, Thompson RJ, Polak JM. The immunolocalization of protein gene product 9.5 using rabbit polyclonal and mouse monoclonal antibodies. Br J Exp Pathol. 1988;69:91–104. [PMC free article] [PubMed] [Google Scholar]
- Yu J, Anderson CT, Kiritani T, Sheets PL, Wokosin DL, Wood L, Shepherd GM. Local-circuit phenotypes of layer 5 neurons in motor-frontal cortex of YFP-H mice. Front Neural Circuits. 2008;2:6. doi: 10.3389/neuro.04.006.2008. [DOI] [PMC free article] [PubMed] [Google Scholar]
- Zhao J, Fu Y, Yasvoina M, Shao P, Hitt B, O'Connor T, Logan S, Maus E, Citron M, Berry R, Binder L, Vassar R. β-site amyloid precursor protein cleaving enzyme 1 levels become elevated in neurons around amyloid plaques: implications for Alzheimer's disease pathogenesis. J Neurosci. 2007;27:3639–3649. doi: 10.1523/JNEUROSCI.4396-06.2007. [DOI] [PMC free article] [PubMed] [Google Scholar]