
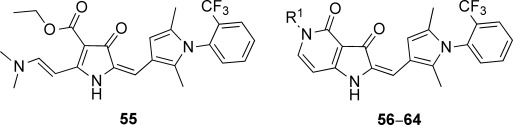
Table 2.
Activity data for C-ring variants against Plasmodium falciparum.
 | ||||||
|---|---|---|---|---|---|---|
| Compd[a] | R1 | EC50[b] [μm] | cLog D[c] | Solubility [μm] | CLint[d] | |
| P. falc. | L6 cells | (pH 7.4) | water | [μL min mg−1 protein] | ||
| 55 | – | 0.061 | 56 | 2.8 | >125 | n.d. |
| 56 | H | 0.047 | 54 | 4.0 | >125 | 69 |
| 57 | CH3- | 0.014 | 29 | 4.2 | >125 | 286 |
| 58 | CH3CH2 | 0.021 | 36 | 4.5 | >125 | 381 |
| 59 | CH3CH2CH2 | 0.15 | 34 | 4.7 | n.d. | n.d. |
| 60 |  |
0.23 | 65 | 2.8 | n.d. | n.d. |
| 61 | (CH3)2NCH2CH2- | 0.25 | 35 | 2.4 | n.d. | n.d. |
| 62 |  |
0.23 | 43 | 5.5 | n.d. | n.d. |
| 63 |  |
0.046 | 54 | 5.9 | 89 | n.d. |
| 64 |  |
0.077 | 38 | 4.5 | >125 | n.d. |
[a]
Overall yields: 50–90 %; reference compounds: chloroquine, EC50=0.019–0.066 μm (P. falciparum K1); podophyllotoxin, EC50=0.012 μm (L6 cells).
[b]
The EC50 values are the mean of two independent assays, which varied less than ±50 %; n.d=not determined.
[c]
Calculated using StarDrop (http://www.optibrium.com).
[d]
Intrinsic clearance determined in vitro using mouse liver microsomes at the University of Dundee (UK).