Abstract
Frequency domain optical spectroscopy in the diffusive regime is currently being investigated for biomedical applications including tumor detection, therapy monitoring, exercise metabolism, and others. Analog homodyne or heterodyne detection of sinusoidally modulated signals have been the predominant method for measuring phase and amplitude of photon density waves that have traversed through tissue. Here we demonstrate the feasibility of utilizing direct digital sampling of modulated signals using a 3.6 Gigasample/second 12 bit Analog to Digital Converter. Digitally synthesized modulated signals between 50MHz and 400MHz were measured on tissue simulating phantoms at six near-infrared wavelengths. An amplitude and phase precision of 1% and 0.6 degrees were achieved during drift tests. Amplitude, phase, scattering and absorption values were compared with a well-characterized network analyzer based diffuse optical device. Measured optical properties measured with both systems were within 3.6% for absorption and 2.8% for scattering over a range of biologically relevant values. Direct digital sampling represents a viable method for frequency domain diffuse optical spectroscopy and has the potential to reduce system complexity, size, and cost.
Keywords: frequency domain, photon migration, diffuse optics, digital sampling, spectroscopy
Introduction
Diffuse optical frequency domain instruments have been utilized for a number of biological applications including breast cancer detection [1, 2], chemotherapy monitoring [3–6], cerebral hemodynamic monitoring [7], and others. Typically, the intensity of nearinfrared light is sinusoidally modulated in the MHz or GHz range and injected into biological tissue. As these photon density waves (PDW) propagate through the tissue, they become attenuated in amplitude and delayed in phase. Amplitude and phase measurements depend on the absorption and scattering properties of the tissue, as well as the distance between source and detector. When the mean photon absorption length is sufficiently longer than the mean scattering length (typically µs(1-g)/µa must be greater than 10), and detection occurs sufficiently far from the source, PDWs lose their directional flux and the photon propagation can be modeled using the frequency-domain diffusion equation [8]. µa and µs can then be determined by an iterative minimization algorithm which matches measured amplitude and phase data to amplitude and phase calculated from a forward model of light propagation [9, 10].
The methods employed to determine amplitude and phase information from measured frequency domain signals generally fall into the categories of either heterodyne detection or homodyne detection [11]. Heterodyne detection mixes the sample signal with a reference signal that is offset in frequency to produce a lower intermediate frequency (IF). The IF retains the phase and amplitude information and allows extraction of these values using digitization or analog detection chips. Several groups that have developed clinical or preclinical frequency domain diffuse optical instruments employ heterodyne techniques [2, 10, 12–16]. Several of these systems utilize commercially available heterodyne (vector) network analyzers to determine phase and amplitude. Homodyne detection measures amplitude and phase without mixing and most groups accomplish this with an IQ demodulator [7, 12, 17, 18]. Some groups have utilized homodyne detection with CCD imaging by modulating an image intensifier with a reference signal to produce phase sensitive images [19, 20]. For all of these methods, one or more modulation frequencies can be used depending on the specifics of the instrumentation and several groups scan through a range of modulation frequencies in attempts to improve fitting and increase signal-to-noise [10].
Analog methods for determining phase and amplitude for diffuse optical measurements require either significant capital expense (entry level commercial vector network analyzers are typically more than $15,000) or, if custom instrumentation is used, require design and fabrication of complex RF circuits. In this manuscript we report the construction of a relatively simple and cost-effective all-digital frequency domain system. The RF source signal is generated using direct digital synthesis (DDS), while detection is accomplished without frequency mixing using high speed digital sampling. The raw digitization method is made possible by recent technological advances in fast analog-to-digital conversion. Here the reference and sample time-domain signals are directly digitized and amplitude and phase information is computed during post processing using standard Fast Fourier Transforms (FFTs). We demonstrate that this method can be used to accurately determine amplitude and phase measurements of PDWs in diffuse media. Extracted optical properties match those determined with a vector network analyzer based frequency-domain system.
Methods
Experimental Design
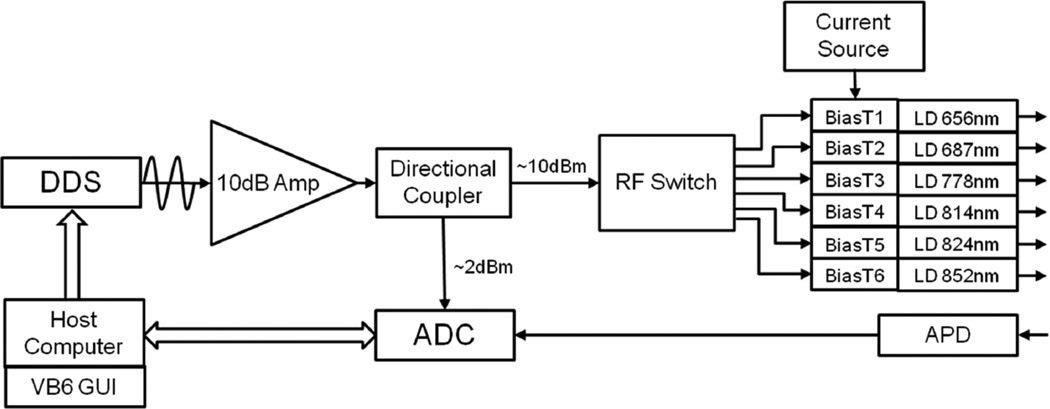
A schematic of system is shown in figure 1. The National Semiconductor ADC12D1800 Analog to Digital Converter (ADC) integrated circuit (IC) was utilized for direct sampling of RF signals. This is a 12-bit, dual-channel ADC capable of 3.6 gigasample per second (GSPS) sampling in a single-input mode or 1.8 GSPS sampling per channel in interleaved mode. In this work, one channel was used to measure a reference signal while the other channel was used to measure the output of the optical detector. The full scale voltage of this ADC is 800mV (2dBm) with an impedance of 50 ohms. For all experiments, 4096 samples were collected at each modulation frequency. Because the channels are interleaved, 2048 samples were collected from each channel. Data was transferred to a controlling laptop through a USB interface and a custom dynamic linked library (dll).
Figure 1.
Layout of digital system.
The RF source used for all measurements was the Analog Devices AD9910 DDS IC. This is a 1 GSPS, 14-bit Digital to Analog converter capable of outputting sinusoidally modulated signals up to 400MHz when a 1GHz reference clock is used. Manufacturer specifications detail a 0.23Hz frequency resolution and the evaluation board used in these experiments outputs 1.4dBm of RF power at 50MHz at the gain setting used here. The RF power drops to −1.77dBm at 400MHz for the same gain setting. The modulation frequency of the DDS is controlled through a USB interface.
The RF output of the DDS was amplified by a 10dB amplifier (Mini-Circuits ZHL-1010+) and then split with a 10.4dB directional coupler (Mini-Circuits ZFDC-10– 128) so that approximately 2dBm is directed to the reference channel of the ADC and 10dBm is directed to a SP6T RF switch. The RF switch directs the RF power to one of six bias tees which are connected to six different near infrared laser diodes. DC power is supplied to the Bias tees by a DC current source (LDC 3900, ILX Lightwave, Bozeman, MT). Laser diodes are 656nm, 687nm, 778nm, 814nm, 824nm, and 852nm. For all the diodes the DC current level is balanced with the RF power set so that there is no clipping of the modulated light signal. Typical light output delivered to the sample is 20mW.
The laser diodes are each fiber coupled to 400µM fibers that combine to a six-inone configuration at the distal end. These fibers allow contact to either a solid silicone or immersion in a liquid phantom. A 3.0mm (solid core) fiber is used to collect reflected light at specific source-detector fiber separations. The detection fiber is coupled to a 3mm active-area Avalanche Photodiode (APD) (Hamamatsu, Model S6045-05) with a custom biasing circuit and amplifier. The gain of the APD is approximately 60 and the additional gain supplied by the module is approximately 40dB. The voltage modulated APD output is then sent to the sample channel of the ADC (1.8 GSPS per channel). A 400MHz low-pass anti-aliasing RF filter was used before both the reference and sample channels of the ADC (there is less than a 1dB loss in the DC-400MHz pass-band of the filter, mini-circuits part #VLF-400+).
Controlling software was designed using Visual Basic 6 (Microsoft, Redmond, WA) which iteratively selected the tuning frequency of the DDS and called the dll to collect samples from the ADC. Frequency sweeps between 50MHz and 400MHz in 1MHz steps were collected for drift experiments, sweeps between 100MHz and 298MHz with steps of 2MHz were used for accuracy and optical property comparisons to the network analyzer based system.
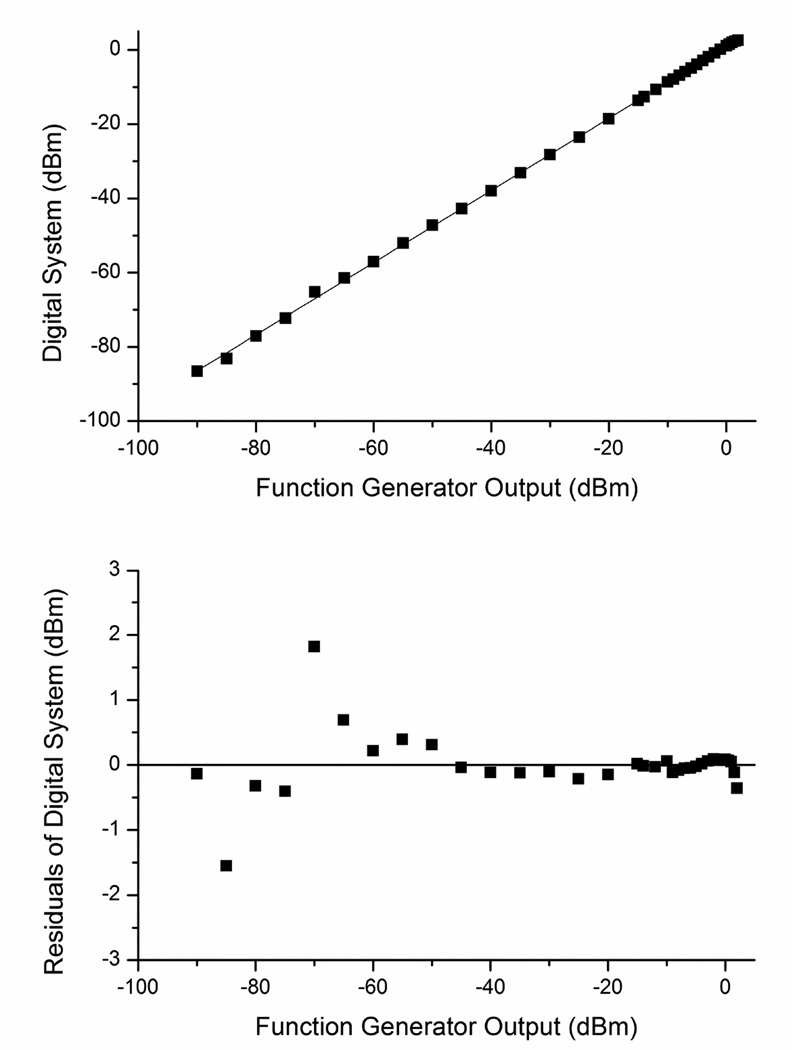
The linearity of the ADC was tested over a broad range of RF powers (−90dBm to 2dBm) at 50, 150, 250, and 350MHz using the output of a function generator (Rhodes- Schwarz SMIQ03B).
Measurements from the digital system described above were compared with those taken from a well characterized network-analyzer based system which has been used for more than 10 years to collect clinical data from breast cancer patients [10]. The same RF switch, bias tees, laser diodes, dc current source, source and detector fibers, APD and APD module were used for both the digital system and the network-analyzer based system.
For experiments evaluating the equivalence of extracted optical properties between the digital system and the network analyzer based system, liquid phantoms were created using whole milk and the absorbing dye nigrosin combined in different proportions. The tips of the fiber probes were placed approximately 1 cm below the surface of the liquid at various source-detector separations.
Data Analysis
All processing of raw data was done in Matlab (Mathworks Inc., Natick, MA). A Fast Fourier Transform (FFT) with a rectangular window function was performed on 2048 samples collected from the ADC from both the reference and the sample channels at each modulation frequency. The amplitude and phase was determined at each modulation frequency for each channel and the ratio of sample-to-reference and the difference between the sample and reference phase were computed. These referenced measurements were used for analyses of the noise floor, drift, accuracy, and determination of optical property experiments. An analytical model of the diffusion equation in the frequency-domain with infinite boundary conditions was used to determine absorption and scattering coefficients from amplitude and phase measurements at all measured modulation frequencies using multiple source-detector separations [9].
Results
Linearity
The system was linear through a high dynamic range. Figure 2 shows the linearity between RF power output from the function generator and RF power measured by the ADC at 50MHz. Fit residuals above 1dBm were measured below −65dBm.
Figure 2.
Linearity.
Noise Floor and Dynamic Range
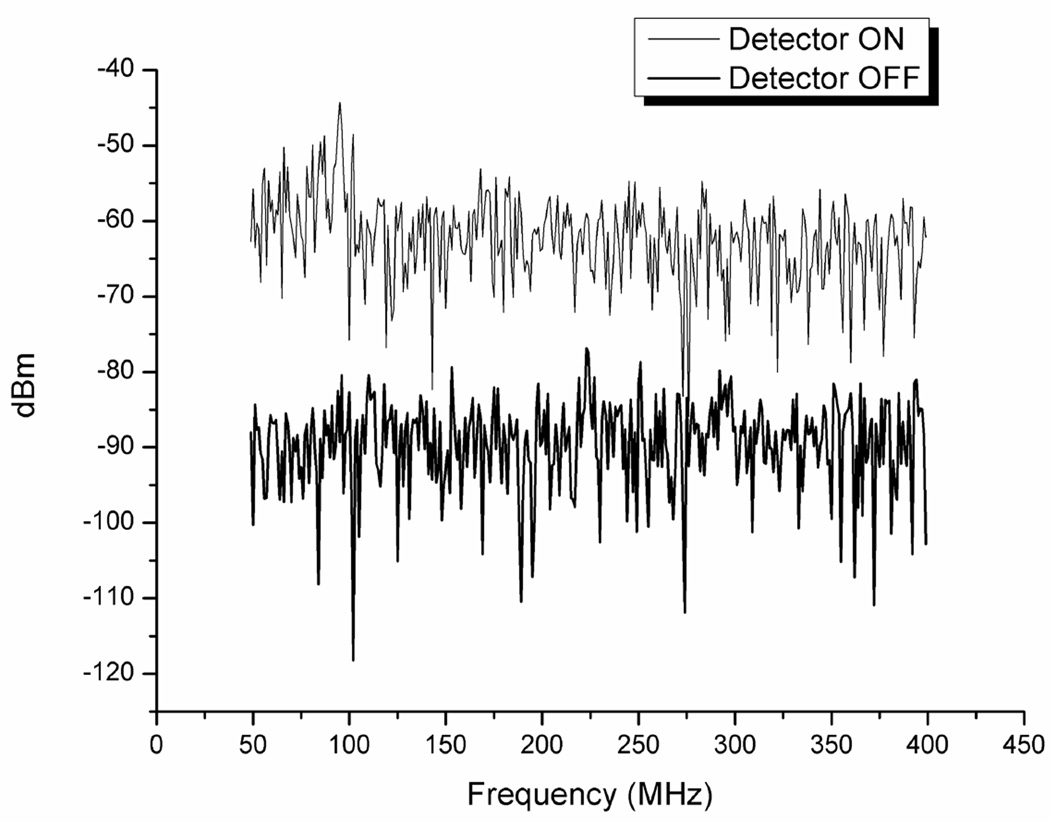
The theoretical ideal noise floor of the ADC assuming a full-scale signal and taking into account the FFT process gain (in this case a DFT of length 2048) is −102.1dBm [21]. The experimentally measured noise floor of the ADC with the detector off, DDS off, and laser diode sources off was −89.6dBm. The full scale voltage value for the ADC is 800mV peak to peak which corresponds to a power of 2.0dBm in a 50 ohm system. The dynamic range of the ADC is therefore 91.6dB. This compares to a dynamic range of 120dB for the network analyzer system. The noise floor of the system averaged over all modulation frequencies between 50 and 400 MHz with the detector on, laser diodes on, DDS on, and laser diode driver on but without source fibers connected was −62.9dBm. Example noise floor measurements for the 814nm diode are shown in figure 3. The noise floor for the network analyzer laser system with the same detector was approximately –70dBm.
Figure 3.
Noise floor.
Amplitude and Phase Resolution, Precision, and Accuracy
Amplitude and phase resolution for the digital system is dependent on a multitude of factors including the bit depth of the ADC, the signal strength (i.e. the percent of full scale), the parameters of the FFT (sample length, window type), and the signal-to-noise ratio. The maximum (i.e. best) theoretical amplitude resolution of the digital system when only quantization of the ADC is considered, is the full scale voltage range EFSR (800mV in this case) divided by the number of discrete values available to the ADC:
| (1) |
where n is the bit depth. This is 0.195mV for this 12-bit system and the corresponding maximum amplitude resolution is .024%. We define here the phase resolution to be the smallest change in an analog sine wave phase guaranteed to change the ADC output code at a single time point. The theoretical phase resolution for a sine wave is dependent on what part of the cycle the sine wave is sampled. For example, phase resolution will be poor if sampled only at the peaks and troughs due to the lower slope of the time-varying signal here (i.e. a large phase shift will be required to produce a change in the ADC output code). The phase resolution of a sine wave is then a mapping of the amplitude resolution into phase. The time dependent voltage signal V(t) is given by:
| (2) |
The phase resolution φr is then given by the amplitude resolution (equation 1) divided by the slope of V(t), multiplied by the change in phase of the signal per unit time given by 360° f. After cancelling terms:
| (3) |
The maximum phase resolution φr,max obtained when the cosine function is equal to 1, is given by
| (4) |
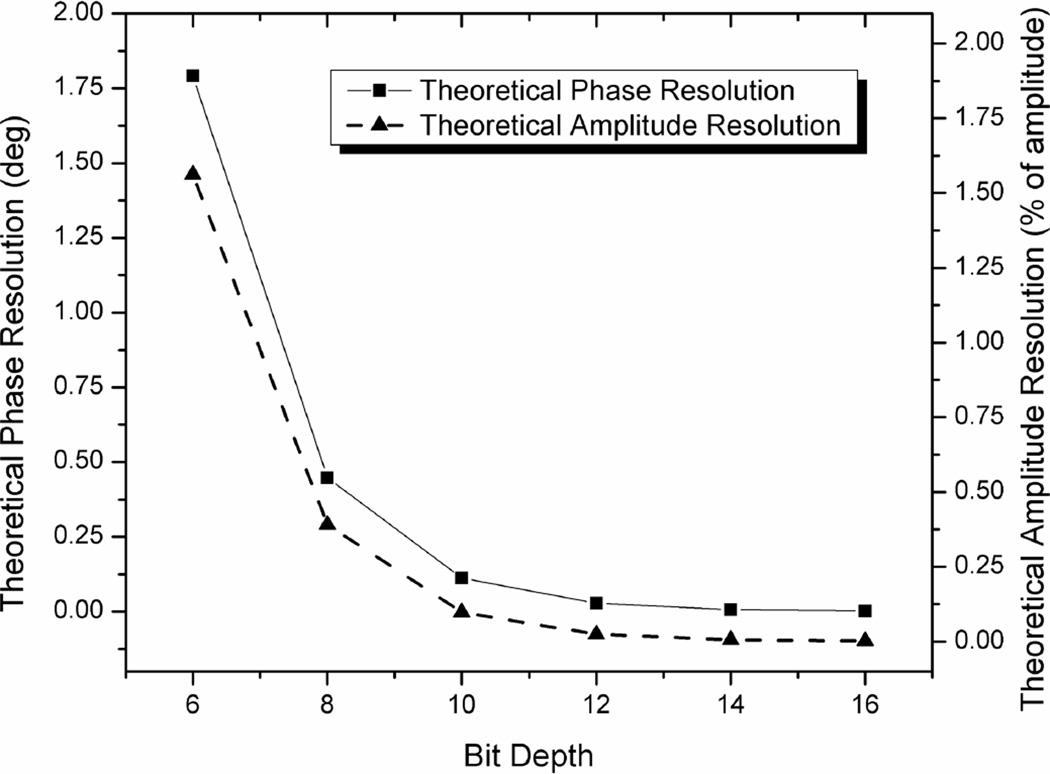
The maximum phase resolution for this system, for a full-scale signal, is 0.028°. Amplitude and phase resolution drop precipitously with decreasing signal levels or bit depth and this relationship is shown in figure 4.
Figure 4.
Theoretical phase and amplitude resolution for ADCs of different bit depths.
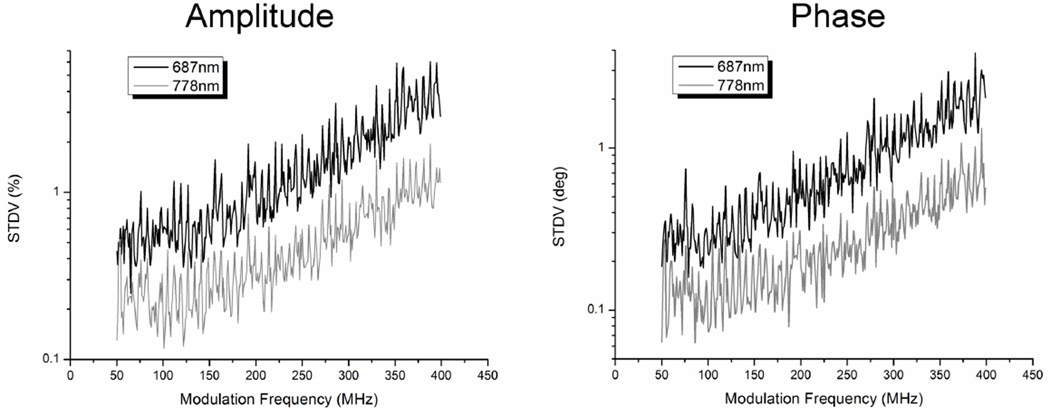
Amplitude and phase precision for the digital system were measured by a 20 minute drift test with 20 repeat measurements on a breast-like silicon optical phantom. A 10mm source-detector separation was used with fiber-coupled sources and detectors as described in the methods section. Amplitude precision is defined per laser diode wavelength and per modulation frequency as the standard deviation (represented as a percentage of the mean) of the measured amplitude over the duration of the drift test. Phase precision is the standard deviation (represented in degrees) of the measured phase. Note that the amplitude referred to for these calculations is the ratio of the amplitude measured in the sample channel over the amplitude measured in the reference channel. The phase referred to is the difference in phase between the sample and reference channels.
Figure 5 shows example drift results from two laser diodes, the 687nm and the 778nm diodes. Note that the amplitude and phase precision both decrease with increasing modulation frequency. This effect can be attributed in large part to the fact that the amplitude of the measured signal decreased with modulation frequency due to the reduced RF power output characteristics of the DDS at higher frequencies, the lower response of the detector at higher frequencies, the reduced modulation depth of the laser diodes at higher frequencies due to internal capacitance, and the tendency of diffuse media to act as a low pass filter. For example, the measured signal in the sample channel for the 778nm diode occupied 75% of full scale at 50MHz but only 6.6% at 400MHz. When the signal occupies a smaller portion of the ADC’s full scale, the amplitude and phase resolution decreases leading to larger variations over repeated measures. Finally, the Total Harmonic Distortion (THD) of the ADC increases and signal-to-noise (SNR) decreases with increasing frequency reducing the effective number of bits (ENOB) which also contributes to larger errors at higher frequencies.
Figure 5.
Experimentally determined phase and amplitude precision at 687nm and 778nm.
The amplitude precision averaged over all laser diode wavelengths and modulation frequencies (50 to 400MHz in 1MHz steps) was 1.02%. The phase precision was 0.59°. These errors translated into a precision of 1.5% in the measured absorption coefficient and 0.5% in scattering. The same drift experiment was conducted using the network analyzer-based system with an average amplitude precision of 0.30% and a phase precision of 0.13° resulting in a precision of 0.68% for absorption and 0.29% for scattering.
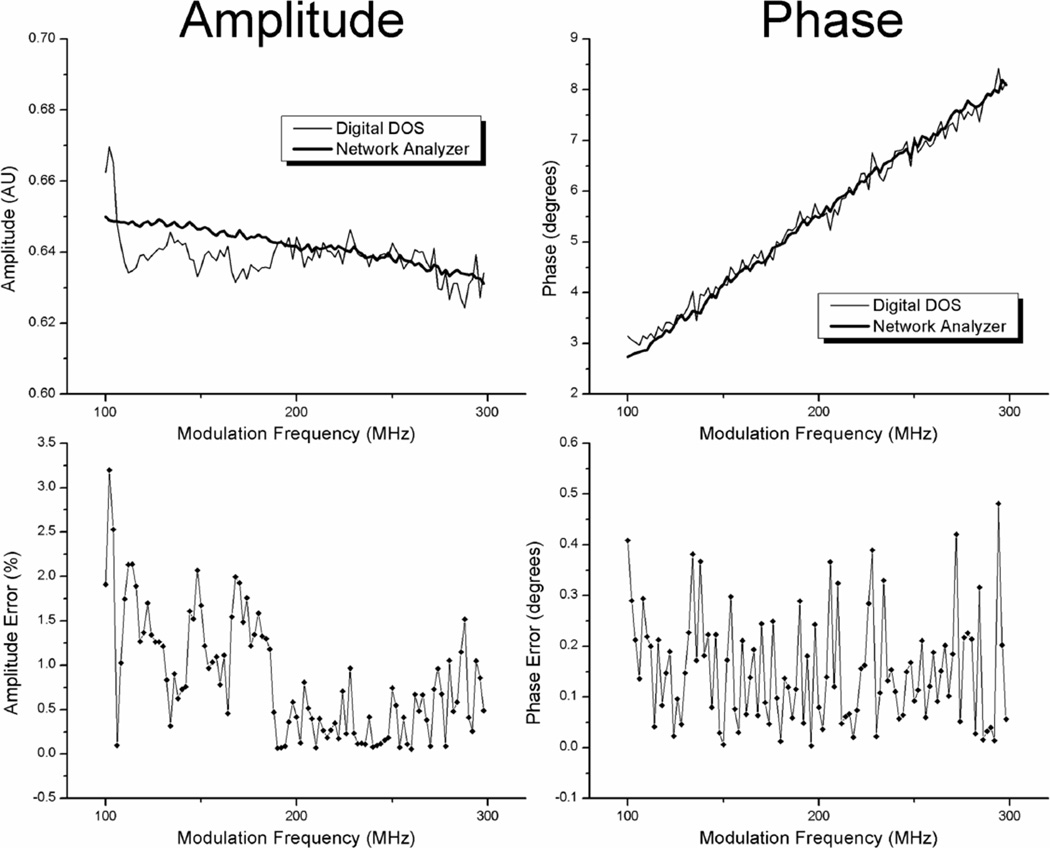
Amplitude and phase accuracy were determined by comparing measurements taken with the digital system and the network analyzer system on the liquid phantom ph3. The amplitude ratio and phase difference between 10mm and 8mm source-detector separation measurements were used to compare the two devices. Amplitude accuracy is defined here at the absolute % difference between the digital system and network analyzer system measurements per modulation frequency. The phase accuracy is defined as the absolute difference, in degrees, between the digital system and network analyzer system measurements per modulation frequency. Because the digital system and the network analyzer based system collected measurements at slightly different modulation frequencies (the digital system every 2MHz and the network analyzer system every 0.75MHz), linear interpolation was used to obtain phase and amplitude measurements from the network analyzer system at equivalent frequencies to the digital system.
Figure 6 shows amplitude and phase measurements from both devices at 778nm along with amplitude and phase errors. In this example, and for all other laser diodes tested, there was no identifiable frequency dependence on phase or amplitude accuracy. The amplitude accuracy averaged over all laser diode wavelengths and modulation frequencies (100 to 298MHz in 2MHz steps) was 1.44% and the phase accuracy was 0.32°. Accuracy averaged over only lower frequencies (100–126MHz) was 1.61% and 0.30° for amplitude and phase respectively. Accuracy averaged over only higher frequencies (272–298MHz) was 1.58% and 0.51°. Noise levels were likely sufficiently high to mask the frequency dependence on accuracy.
Figure 6.
Accuracy of digital system. Amplitude and phase measurements are shown for both the digital and the network analyzer system for the 778nm laser diode.
Determination of Optical Properties
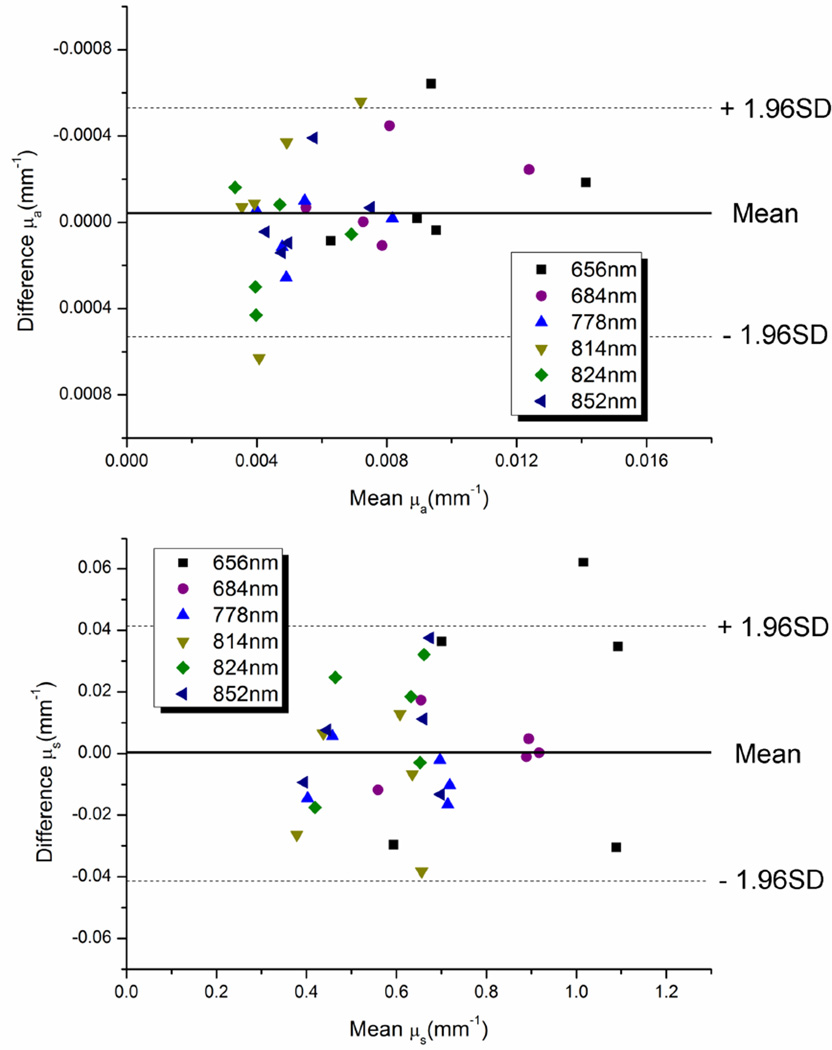
In order to determine the ability of the digital system to extract optical properties from biologically-relevant diffuse media, a series of liquid optical phantoms were measured with both the digital system and the network-analyzer based system and results were compared using Bland-Altman analysis [22]. Five optical phantoms were created with a range of absorption and scattering values shown in table 1. Phantoms were measured with 4 different source detector separations (8, 10, 12, 14mm). Optical properties were calculated for both systems using a multi-distance version of the diffusion-based processing code. The average difference between recovered optical properties was 3.6% (SD 3.8%) for µa and 2.8% (SD 2.0%) for µs. Figure 7 shows Bland-Altman plots of recovered optical properties for all phantoms at the six different laser diode wavelengths. All but three measurements for absorption (90% of measurements) and one measurement for scattering (97% of measurements) were within 1.96SD of the mean difference indicating a close correspondence between measurements. Based on this data, we can expect absorption values measured with the digital system to be up to 0.0006 mm−1 below or 0.0005 mm−1 above values obtained using the network analyzer system. Scattering from the digital system maybe be up to .04 mm−1 below or .04 mm−1 above values obtained from the network analyzer system. The mean differences between systems are uniformly close to zero, indicating that the digital system is not biased towards higher or lower values.
Table 1.
Optical properties of liquid phantoms.
| λ (nm) | µa (mm−1) |
µs (mm−1) |
||||||||
|---|---|---|---|---|---|---|---|---|---|---|
| ph1 | ph2 | ph3 | ph4 | ph5 | ph1 | ph2 | ph3 | ph4 | ph5 | |
| 656 | 0.0062 | 0.0142 | 0.0097 | 0.0089 | 0.0095 | 0.98 | 1.07 | 1.10 | 0.61 | 0.68 |
| 687 | 0.0055 | 0.0125 | 0.0083 | 0.0073 | 0.0078 | 0.89 | 0.89 | 0.92 | 0.57 | 0.65 |
| 778 | 0.0040 | 0.0082 | 0.0055 | 0.0047 | 0.0048 | 0.72 | 0.70 | 0.72 | 0.41 | 0.45 |
| 814 | 0.0036 | 0.0075 | 0.0051 | 0.0038 | 0.0040 | 0.64 | 0.60 | 0.68 | 0.39 | 0.43 |
| 824 | 0.0034 | 0.0069 | 0.0048 | 0.0038 | 0.0038 | 0.65 | 0.62 | 0.65 | 0.43 | 0.45 |
| 852 | 0.0043 | 0.0075 | 0.0059 | 0.0049 | 0.0047 | 0.66 | 0.65 | 0.71 | 0.40 | 0.44 |
Figure 7.
Bland-Altman plots of mean and difference of extracted µa and µs from the digital system and the network analyzer based system.
Discussion
Although direct comparisons with other published instruments are difficult due to differences in experimental setup, the amplitude and phase precision and accuracy for the digital system (1.02% and 0.59° precision, 1.44% and 0.32° accuracy) was comparable with other frequency domain optical systems used for biological applications in which these parameters were documented, most of which are approximately 1% for amplitude and 1° for phase [7, 18–20].
The agreement between the digital system and the analog network-analyzer based system in extraction of optical properties was within 4%. Additionally, the absorption and scattering precision measured during drift tests was approximately 1.5% and 0.5% respectively. These performance parameters should allow for a broad range of useful biomedical applications. In the field of breast cancer for example, average increases of approximately 60% (at 650nm) or more in absorption have been documented in tumor measurements compared to surrounding normal tissue [23]. As another example, during a typical arterial cuff occlusion taken with the cuff on the upper arm and diffuse optical measurements taken on the forearm, our group measures changes of 13% (785nm) to 75% (657nm) in absorption. These contrasts are significantly larger than the measurements uncertainty of the digital system.
The measured precision of the digital system decreased with increasing modulation frequency. Precision and accuracy are dependent on the amplitude of the detected signal in relation to full scale and for this system, the amplitude of the signal greatly decreased with increasing modulation frequency. The average amplitude and phase precision at 50MHz was 0.28% and 0.17° for example, but decreased to 2.4% and 1.5° at 400MHz. This relationship can also be seen in figure 4 which shows bit depth/signal strength versus theoretical resolution. Both amplitude and phase resolution, accuracy, and precision will be affected by nonlinearities and jitter in the ADC, the FFT transform length and windowing function, and external noise. Furthermore, imperfect quantization and distortion of the analog signal by the ADC reduces the effective number of bits (ENOB) collected by the system. For this ADC chip, the ENOB is specified by the manufacturer as approximately 9 at 100MHz in the specific mode of operation.
Amplitude and phase precision could potentially be improved by increasing the measured signal amplitude at higher modulation frequencies. This could be accomplished by increasing the RF input power at higher frequencies, using a detector with higher bandwidth (the 3dB rolloff for the 3mm APD used in the study was ~80MHz), or by amplifying the detected signal at higher frequencies. These solutions may introduce additional problems however. For example, there are limits to the extent that RF power to the laser diodes can be increased before clipping occurs. Higher bandwidth APD’s generally have smaller active areas which will limit the ability to detect low signal levels. Additional amplification on the detection side will introduce noise that may limit precision.
Interestingly, the measured accuracy did not have an observable frequency dependence. This is likely because system noise dominated over this relationship for the measured modulation frequencies.
Current limitations of the experimental setup include relatively slow measurement times and a relatively large instrument footprint. A single wavelength frequency sweep between 50 and 400MHz in 1MHz increments takes approximately 30 seconds due to communication and data transfer speeds using multiple USB port controls. The acquisition speed can be vastly improved by controlling the DDS and ADC closer to the hardware level instead of through several software layers and USB connections. For this feasibility study, evaluation boards, a benchtop current supply, and benchtop laser diode mounts were used. Significant reductions in instrument footprint will occur by integrating these components at the board-level. These improvements are underway.
The choice of ADC will significantly affect performance and capabilities of frequency-domain measurements. Currently, 12-bit direct digitizers are limited to several gigasamples/sec which allow measurements up to several hundred MHz while staying within the Nyquist sampling criteria. 10-bit digitizers are significantly faster allowing for sampling of GHz signals but phase and amplitude resolution will be lost due to the lower bit depth (see figure 4). We have demonstrated in this manuscript that a reduction in amplitude, especially at higher frequencies, greatly reduces phase and amplitude precision suggesting that 10-bit digitizers may be viable only if signal levels are maintained close to full-scale.
No other groups have demonstrated the direct digital sampling method presented here for diffuse optical frequency domain measurements, although digital techniques are increasingly being utilized in this arena. Colyer et al. have utilized a related digital frequency domain approach for florescence lifetime imaging (FLIM) microscopy [24]. Flexman et al. have utilized digital signal synthesis and detection for continuous-wave measurements using low-frequency (5 or 8 kHz) lock-in detection for noise rejection and simultaneous multi-wavelength illumination [25, 26]. Other groups use lower speed ADCs to sample the IF in heterodyne detection [12, 15].
We have demonstrated the use of direct digital sampling for frequency domain optical measurements. This digital system can be constructed using off-the-shelf components for a fraction of the cost of a network analyzer based system. The use of digital technologies should provide opportunities to reduce instrumentation costs, reduce instrument footprints, and improve wavelength multiplexing schemes.
Acknowledgements
This work was supported by National Institutes of Health Grants P41RR01192 and P41EB015890 (Laser Microbeam and Medical Program), U54-CA136400 (Network for Translational Research), R01-CA142989, the American College of Radiology Imaging Network (ACRIN) ACR-50185-6691, and NCI-2P30CA62203 (University of California, Irvine Cancer Center Support Grant). Beckman Laser Institute programmatic support from the Arnold and Mabel Beckman Foundation and is gratefully acknowledged. DMR acknowledges support from the DOD Era of Hope Fellowship Program (W81XWH-10-1-0972). DMR and TO acknowledge support from the UCI Cancer Research Institute Training grant (NCI-T32CA009054).
References
- 1.Zhu Q, Hegde PU, Ricci A, Kane M, Cronin EB, Ardeshirpour Y, Xu C, Aguirre A, Kurtzman SH, Deckers PJ, Tannenbaum SH. Early-Stage Invasive Breast Cancers : Potential Role of Optical Tomography with US Localization Methods. Radiology. 2010;256 doi: 10.1148/radiol.10091237. [DOI] [PMC free article] [PubMed] [Google Scholar]
- 2.Orlova AG, Turchin IV, Plehanov VI, Shakhova NM, Fiks II, Kleshnin MI, Konuchenko NY, Kamensky VA. Frequency-domain diffuse optical tomography with single source-detector pair for breast cancer detection. Laser Physics Letters. 2008;5(4):321–327. [Google Scholar]
- 3.Pakalniskis MG, Wells WA, Schwab MC, Froehlich HM, Jiang S, Li Z, Tosteson TD, Poplack SP, Kaufman PA, Pogue BW, Paulsen KD. Tumor angiogenesis change estimated by using diffuse optical spectroscopic tomography: demonstrated correlation in women undergoing neoadjuvant chemotherapy for invasive breast cancer? Radiology. 259(2):365–374. doi: 10.1148/radiol.11100699. [DOI] [PMC free article] [PubMed] [Google Scholar]
- 4.Zhu Q, Tannenbaum S, Hegde P, Kane M, Xu C, Kurtzman SH. Noninvasive monitoring of breast cancer during neoadjuvant chemotherapy using optical tomography with ultrasound localization. Neoplasia. 2008;10(10):1028–1040. doi: 10.1593/neo.08602. [DOI] [PMC free article] [PubMed] [Google Scholar]
- 5.Cerussi A, Hsiang D, Shah N, Mehta R, Durkin A, Butler J, Tromberg BJ. Predicting response to breast cancer neoadjuvant chemotherapy using diffuse optical spectroscopy. Proc Natl Acad Sci U S A. 2007;104(10):4014–4019. doi: 10.1073/pnas.0611058104. [DOI] [PMC free article] [PubMed] [Google Scholar]
- 6.Roblyer D, Ueda S, Cerussi A, Tanamai W, Durkin A, Mehta R, Hsiang D, Butler JA, McLaren C, Chen WP, Tromberg B. Optical imaging of breast cancer oxyhemoglobin flare correlates with neoadjuvant chemotherapy response one day after starting treatment. Proc Natl Acad Sci U S A. 108(35):14626–14631. doi: 10.1073/pnas.1013103108. [DOI] [PMC free article] [PubMed] [Google Scholar]
- 7.Yu G, Durduran T, Furuya D, Greenberg JH, Yodh AG. Frequency-domain multiplexing system for in vivo diffuse light measurements of rapid cerebral hemodynamics. Appl Opt. 2003;42(16):2931–2939. doi: 10.1364/ao.42.002931. [DOI] [PubMed] [Google Scholar]
- 8.Jacques SL, Pogue BW. Tutorial on diffuse light transport. J Biomed Opt. 2008;13(4):041302. doi: 10.1117/1.2967535. [DOI] [PubMed] [Google Scholar]
- 9.Haskell RC, Svaasand LO, Tsay TT, Feng TC, Mcadams MS. Boundary-Conditions for the Diffusion Equation in Radiative-Transfer. Journal of the Optical Society of America a-Optics Image Science and Vision. 1994;11(10):2727–2741. doi: 10.1364/josaa.11.002727. [DOI] [PubMed] [Google Scholar]
- 10.Pham TH, Coquoz O, Fishkin JB, Anderson E, Tromberg BJ. Broad bandwidth frequency domain instrument for quantitative tissue optical spectroscopy. Review of Scientific Instruments. 2000;71(6):2500–2513. [Google Scholar]
- 11.Chance B, Cope M, Gratton E, Ramanujam N, Tromberg B. Phase measurement of light absorption and scatter in human tissue. Review of Scientific Instruments. 1998;69(10):3457–3481. [Google Scholar]
- 12.McBride TO, Pogue BW, Jiang S, Osterberg UL, Paulsen KD. A parallel-detection frequency-domain near-infrared tomography system for hemoglobin imaging of the breast in vivo. Review of Scientific Instruments. 2001;72(3):1817–1824. [Google Scholar]
- 13.Pogue B, Testorf M, McBride T, Osterberg U, Paulsen K. Instrumentation and design of a frequency-domain diffuse optical tomography imager for breast cancer detection. Opt Express. 1997;1(13):391–403. doi: 10.1364/oe.1.000391. [DOI] [PubMed] [Google Scholar]
- 14.No KS, Kwong R, Chou PH, Cerussi A. Design and testing of a miniature broadband frequency domain photon migration instrument. J Biomed Opt. 2008;13(5):050509. doi: 10.1117/1.2998473. [DOI] [PMC free article] [PubMed] [Google Scholar]
- 15.Chen NG, Huang M, Xia H, Piao D, Cronin E, Zhu Q. Portable nearinfrared diffusive light imager for breast cancer detection. J Biomed Opt. 2004;9(3):504–510. doi: 10.1117/1.1695410. [DOI] [PMC free article] [PubMed] [Google Scholar]
- 16.Yu Y, Liu N, Sassaroli A, Fantini S. Near-infrared spectral imaging of the female breast for quantitative oximetry in optical mammography. Appl Opt. 2009;48(10):D225–D235. doi: 10.1364/ao.48.00d225. [DOI] [PubMed] [Google Scholar]
- 17.Culver JP, Choe R, Holboke MJ, Zubkov L, Durduran T, Slemp A, Ntziachristos V, Chance B, Yodh AG. Three-dimensional diffuse optical tomography in the parallel plane transmission geometry: evaluation of a hybrid frequency domain/continuous wave clinical system for breast imaging. Med Phys. 2003;30(2):235–247. doi: 10.1118/1.1534109. [DOI] [PubMed] [Google Scholar]
- 18.Yang YS, Liu HL, Li XD, Chance B. Low-cost frequency-domain photon migration instrument for tissue spectroscopy, oximetry, and imaging. Optical Engineering. 1997;36(5):1562–1569. [Google Scholar]
- 19.Netz UJ, Beuthan J, Hielscher AH. Multipixel system for gigahertz frequency-domain optical imaging of finger joints. Rev Sci Instrum. 2008;79(3):034301. doi: 10.1063/1.2840344. [DOI] [PubMed] [Google Scholar]
- 20.Thompson AB, Sevick-Muraca EM. Near-infrared fluorescence contrast-enhanced imaging with intensified charge-coupled device homodyne detection: measurement precision and accuracy. J Biomed Opt. 2003;8(1):111–120. doi: 10.1117/1.1528205. [DOI] [PubMed] [Google Scholar]
- 21.Kester W. MT-003 Tutorial; Understand SINAD, ENOB, SNR, THD, THD + N, and SFDR so You Don't Get Lost in the Noise Floor. 2009;Volume [Google Scholar]
- 22.Bland JM, Altman DG. Statistical methods for assessing agreement between two methods of clinical measurement. Lancet. 1986;1(8476):307–310. [PubMed] [Google Scholar]
- 23.Cerussi A, Shah N, Hsiang D, Durkin A, Butler J, Tromberg BJ. In vivo absorption, scattering, and physiologic properties of 58 malignant breast tumors determined by broadband diffuse optical spectroscopy. J Biomed Opt. 2006;11(4):044005. doi: 10.1117/1.2337546. [DOI] [PubMed] [Google Scholar]
- 24.Colyer RA, Lee C, Gratton E. A novel fluorescence lifetime imaging system that optimizes photon efficiency. Microscopy Research and Technique. 2008;71(3):201–213. doi: 10.1002/jemt.20540. [DOI] [PubMed] [Google Scholar]
- 25.Flexman ML, Li Y, Bur AM, Fong CJ, Masciotti JM, Al Abdi R, Barbour RL, Hielscher AH. The design and characterization of a digital optical breast cancer imaging system. Conf Proc IEEE Eng Med Biol Soc. 2008;2008:3735–3738. doi: 10.1109/IEMBS.2008.4650020. [DOI] [PubMed] [Google Scholar]
- 26.Flexman ML, Khalil MA, Al Abdi R, Kim HK, Fong CJ, Desperito E, Hershman DL, Barbour RL, Hielscher AH. Digital optical tomography system for dynamic breast imaging. J Biomed Opt. 16(7):076014. doi: 10.1117/1.3599955. [DOI] [PMC free article] [PubMed] [Google Scholar]


