Abstract
Background: Vitamin A deficiency is an important dietary deficiency in the world. Thus, the ne¬cessity of screening for deficient populations is obvious. This paper introduces a fast, cheap and relatively reliable method called “dried blood spot” (DBS) method in screening the deficient populations. The validity of this method for retinol measurement was investigated.
Method: The “precision” and “agreement” criteria of the DBS method were assessed. The preci¬sion was calculated and compared with those of plasma using F-test. The agreement was eva¬luated using Bland-Altman plot.
Results: The imprecision of retinol measurements in dried spots was not significantly different from those of the control (plasma). A good correlation coefficient (r2=0.78) was obtained for dried spots’ retinol measurements versus plasma’s retinol analysis (P < 0.01). Paired t-test showed no significant difference between the DBS and retinol methods on a group level. Imprecision of DBS measurement was acceptable, compared to that of the plasma method. The difference be¬tween these two methods was not statistically significant on a group level.
Conclusion: Application of DBS standard samples, in which a part of the plasma was replaced with the artificial plasma, was shown to be a reliable calibration mean for retinol measurements in DBS samples. Retinol in dried spots was stable for 90 days. Overall, the DBS method provided a precise measurement of retinol, showing results that were comparable with the measurement of retinol in plasma.
Keywords: Vitamin A, Retinol, Dried Blood Spot, HPLC, Nutrition
Introduction
In recent years, a general interest has turned to detect endemic micro nutrient deficiencies. The principal nutrients of interest are vitamin A, iron, zinc and iodine [1,2]. World wide, vitamin A deficiency is one of the most important dietary deficiencies. This deficiency often results in juvenile xerophthalmia, keratomalacia, Bitot’s spots and night blindness or total blindness [3]. Children and young women are even more vulnerable to this disease [3,4]. Vitamin A deficiency is responsible for more than 350,000 cases of blindness in children, each year all over the world. In total, more than 250 million children in 60 countries suffer from moderate to severe sub-clinical vitamin A deficiency, while only 5 million exhibit clinical symptoms [5]. Vitamin A supplementation can reduce the mortality of children by up to 50% [6].These facts shows the importance of screening for deficient or marginally deficient populations. Therefore, there is a necessity for an accurate, inexpensive, simple and rapid analytical method to identify and monitor vitamin A deficiency. The most frequently used method to measure vitamin A deficiency is the determination of serum/plasma retinol using high performance liquid chromatography (HPLC) which is recommended by both WHO and the United Nations Children’s Fund [7].
Nonetheless, the current HPLC method that uses plasma retinol is often impractical to apply in field situations. First, a relatively large amount (>500 ml) of venous blood is required. Moreover, the fear of needles and religious believes exclude many from participating. Second, electricity is necessary for centrifugation of the blood samples and freezing the plasma samples before subsequent analysis, which are limiting issues in filed situation. These requirements can probably be overcome by collecting blood on filter papers, known as dried blood spot (DBS) method. For decades, blood sample collection by means of DBS method has been used for the measurement of several substances in blood, e.g. screening of folate status [8], thyroglobulin to monitor thyroid status [9], and phenylalanine to screen for phenylketonuria [10]. DBS method requires only a few drops of blood, which can be obtained by a finger-prick or veni-puncture. The blood collection cards are easily labeled, transported and stored. The transportation of DBS to the analytical laboratories does not require minus temperatures, thus the costs and inconvenience are reduced. Several studies, have demonstrated the possibility of reliable measurements of retinol using DBS method [11-14]. However, these methods are limited due to the fact that sub-samples of matching plasma are required to measure retinol in DBS. In such studies [11-13], sub-samples were used for determination of an adjustment factor. The latter is considered to account the extraction efficiency and the reduction bias of retinol in DBS. The retinol amount in DBS decreases up to 20% during the first week followed by stability for 3 months [12,14]. Therefore, calculation of retinol in blood spots is considered to be a critical issue. The necessity of obtaining matching plasma samples for determination of the adjustment factor could be circumvented by use of a simple alternative. This alternative would be the use of DBS calibrators to calibrate the HPLC. These calibrators could be made from DBS samples of known retinol concentration to quantify the peak areas as used in the present study.
Although the possibility of reliable measurements of retinol in DBS has been shown by others [11-14], still more investigations are required to evaluate the validity of this technique with respect to the calibration, stability of retinol in the DBS, precision of this technique and agreement between this method with the conventional method. The agreement of the two assessments could be investigated by comparing the retinol measurements in DBS with plasma.
Therefore, the objective of this study was to assess the validity of DBS method to measure vitamin A status. To reach this objective, following steps are required: evaluation of the reliability of dried blood spots calibrators, assessment of the stability of retinol in the dried whole blood spots, comparison between the precision of the DBS measurements with that of the plasma measurements and evaluation the agreement between the DBS method and the conventional method.
If the use of the dried whole blood spots to assess vitamin A status could be validated, it would provide a possibility to compare and combine blood retinol concentration data obtained from DBS with historic measurements in serum/plasma.
Materials and Methods
Evacuated tubes containing lithium-heparin as anti-coagulant (from Terumo-Venoject Co., Belgium), filter papers, silica gels and Ziploc plastic bags (all from Schleicher-Schuell BioScience Co., Germany) were used in sample preparations. Sodium chloride, ascorbic acid, HPLC-grade isopropyl alcohol and ethanol (Merck, Germany), butylated hydroxytoluene (Sigma Chemical Co., USA), HPLC-grade acetonitrile and hexane (Lab-Scan Co., Ireland), HPLC-grade retinol (>99.0 %) and retinyl acetate (Fluka Co. Germany), tocol (Hoffmann La Roche, Switzerland) and nitrogen were also used as experimental materials.
Twenty four healthy volunteers with a mean age of 63 ± 4 y (80% male) were recruited among blood donors of a study in Wageningen University (the Netherlands) called Folic Acid and Carotid Intima-media Thickness (FACIT) study. The mean BMI of participants was 27 ± 2.7. Blood samples were drawn from a vein in the forearm into a syringe and transferred to an evacuated tube containing lithium-heparin as an anti-coagulant. The tube was then gently mixed and ca. 60 μl of whole blood was deposited on a filter paper and subsequently dried for 20 h in the dark at room temperature (ca. 23°C) and relative humidity of ca. 18%. The filter papers containing blood spots were placed in zip-lock plastic bags containing silica gels and kept in the dark at room temperature for 7 days followed by storage at -20 °C for 90 days. The reminder of blood was centrifuged (1200 g, max. 15 min in a Sigma 4K10 centrifuge) to collect plasma of comparison. Separated plasma was transferred to freezer-proof labeled tubes and stored at -80 ˚C before analysis.
The Medical Ethics Committee of Wageningen University approved the study and gave written informed consent.
Preparation of dried blood spot calibrators and control samples
To prepare the calibration curve of dried blood spots, an amount of 40 ml blood was taken form each subject. A part of the blood (5 ml) was used for extraction of plasma and measurement of retinol. Another part of the sample (5 ml) was used for measurement of Hematocrit (Hct). The rest of blood (30 ml) was used to prepare standard spots of whole blood. The spots were prepared in three concentrations by replacing 0, 40 and 80% of blood plasma with an artificial plasma (0.9% NaCl and Bovine albumin). The replacements were accomplished after a mild centrifugation (800 g for max.15 min). Standard DBS were kept at least 7 days before subsequent analysis. These spots were extracted in the same way as did the unknown samples and used directly as calibrants. The retinol values for 3 concentrations of standard DBS were calculated based on Hct value. These values were then assigned as retinol values of calibrants in HPLC.
The reliability of DBS calibrators were assessed using the average reliability of 11 DBS calibrators. A calibration plot was also constructed using a mean concentration ratio versus a mean area ratio in the calibration lines. The regression analysis was carried out. The intercept and coefficient of regression analysis were used to assess the reliability of the calibrator. Control samples of DBS were prepared in similar way as DBS calibrators prepared, only in a high concentration (without replacement).To draw DBS control charts, DBS retinol was measured in duplicate in 11 acceptable runs. A control sample was analyzed in duplicate in the same run similar to the samples, and control limits were used to evaluate and monitor analytical variability over the time.
Preparation of plasma and dried blood samples for HPLC analysis
To prepare plasma samples, after thawing the frozen plasma, ethanol containing 1 ml retinyl acetate (as an internal standard) was added in a proportion of 2:1. The resulting samples were extracted with 2 ml hexane. The tubes were then placed in a laboratory shaker (Edmund Buhler-SM 25; Germany) for 5 min followed by centrifugation (Sigma 4K10; Germany) at 3000 g for 2 min prior to HPLC analysis [14].
To prepare DBS samples for HPLC analysis, a whole blood spot with a diameter of (ca. 13 mm) was cut from the filter paper with a pair of scissor and transferred into a 1.5 ml micro-centrifuge tube. A blank sample was prepared with the same size from filter paper. DBS circles were extracted with 500 ml distilled water containing 10 g/l ascorbic acid, as an antioxidant. The samples were then incubated in a dark place at ambient temperature for 15 min followed by sonication for 5 min. Subsequently, 400 ml acetonitrile (containing 5 g/l BHT and 4 mmol/l tocol as internal standard) was added and the tubes were gently mixed. This step was followed by addition of 400 ml n-hexane (containing 5g/L BHT) and vigorous shaking of the tube for 2 min to extract retinol. The mixture was then centrifuged (8000 g for 1 min) and the supernatant phase was completely transferred to a tube [14]. The extraction stage was repeated as explained above for the same sample. An approximate amount of 300 ml supernatant was transferred to an auto sampler vial and injected into the HPLC.
HPLC analysis
A HPLC set up consisting a degasser (SCM1000), a standard HPLC pump (P4000), an auto sampler (AS3000) at 4 ºC with cooling option, a detector (UV 2000), a controller (SN4000) and a software (PC 1000 software version 3.0.3; operating system OS/2 Warp 3) was used to measure retinol concentration. The separation of retinol was achieved using a BDS HypersilCN 150-mm, 5-µm column in combination with a Javelin NH2guard column (Thermo Co. Germany)
For plasma samples an isocraticmobile phase consisting of hexane/isopropanol (98.5:1.5) wasused. The flow rate wasmaintained at 0.7 ml/min. The wavelength of the detector was set at 325 nm. Plasma retinol eluted at ca. 3.5 min and the internal standard retinyl acetate eluted at about 1.7 min. Fig. 1 illustrates a HPLC chromatogram of plasma sample. Peaks from retinol and retinyl acetate (internal standard) were baseline separated within an analysis time of 6 min. For DBS samples an isocraticmobile phase consisting of hexane/isopropanol (99:1) wasused. The flow rate wasmaintained at 0.7 ml/min. From 0 to 4.8 min the wavelength was 325 nm and then it changed to 300 nm until 7 min to getthe maximum absorbance of retinol and tocol. DBS retinol eluted at ca. 4 min and the internal standard tocol eluted at ca. 5 min. Fig. 2 shows the resulting chromatogram for a DBS sample. Both peaks of retinol and tocol (as an internal standard) were baseline separated within an analysis time of 6 min.
Fig. 1.
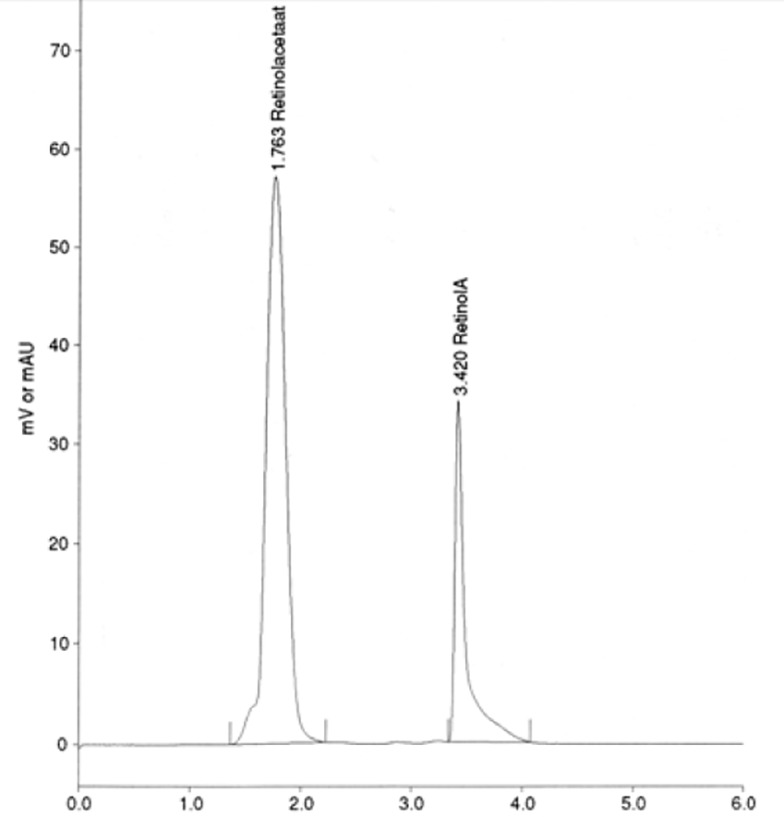
HPLC chromatogram of plasma retinol. The mobile phase was hexane/isopropanol (98.5:1.5) with a flow rate of 0.7 ml/min. Plasma retinol eluted at ca. 3.5 min and the internal standard retinyl acetate eluted at ca. 1.7 min
Fig. 2.

HPLC chromatogram of dried blood spots (DBS) retinol. The mobile phase was hexane/isopropanol (99:1) with a flow rate of 0.7 ml/min. DBS retinol eluted at ca. 4.2 min and the internal standard tocol eluted at ca. 5.0 min
Calculation of plasma volume in DBS
The retinol value of DBS obtained by HPLC is the retinol concentration of the whole blood. To obtain the retinol in plasma part of DBS samples, the plasma fraction of DBS samples has to be calculated. To do this, Hct value in each subject was determined. The plasma fraction of whole blood was calculated using the Hct value and the volume of blood in each circle of the DBS.
Assessment of the stability of retinol in DBS
Retinol concentrations in DBS were measured in triplicate on days 1-4, 7-8, 10-14, 16-18, 21, 30, 56, 58 and 90. Day 0 was the day on which the DBS samples were prepared. A regression analysis was carried out to assess the stability of retinol in DBS. The coefficient of regression line was used to evaluate the stability of retinol during these three months.
Statistical analysis
In order to validate the DBS method, precision of this method was determined and compared with the precision of plasma method. Furthermore, the agreement of the DBS method with the plasma method was evaluated. To assess the "within laboratory precision" of the DBS method, standard deviation (coefficient of variation) from the test results on control samples were calculated based on a single measurement of a sample. The intra-assay, inter-assay and total variation of DBS measurements were calculated and compared with those of plasma with F-test (α = 0.05).
To assess the agreement between the DBS retinol value with the plasma value, blood samples were taken from 21 healthy volunteers in both ways. Then the retinol amount was measured in both types of samples. The retinol concentration in DBS was reported based on whole blood. However the retinol concentration in plasma was reported based on plasma. To be able to compare two kinds of measurements, retinol in the whole DBS samples must be converted to retinol in the plasma fraction in the dried blood spots. The plasma volume in DBS was calculated using Hct values.
Agreement between the DBS and the plasma methods was assessed using the established approach outlined by Bland and Altman [15]. First, a plot was made to visualize the correlation between measurement of retinol in the DBS and the plasma. Second, a plot of the difference between two methods versus their means was constructed. Regression analysis was then carried out for the data points of Bland-Altman plot. If the slope was not significantly different from zero, it is concluded that there is no level dependent bias. The paired T-test could safely be used for the comparison of the two methods. This gives information about the difference between two methods on group level. To see the difference between two methods on individual level, another approach was used. A prediction interval was drawn around the line of mean difference of the two methods. This prediction interval was calculated based on the standard deviation of the difference between plasma measurements and plasma measurements under repeatability condition. If the most data points lie between the prediction intervals, one can conclude that the differences between two methods are within the acceptable interval with respect to the individual level.
Results
Reliability of the DBS calibrators
To assess the reliability of the dried blood spots calibrators, a calibration plot using mean concentration ratio and mean area ratio of 11 calibration lines was constructed. Fig. 3 illustrates a calibration plot based on mean area ratio versus mean concentration ratio values. For each data point a confidence interval of 95% has been shown. The intercept was not significantly different from zero (P=0.13). Correlation coefficient value was 0.99 and the reliability of the calibration line was 93.0 ± 2.60% with a range from 90.0 to 98.9.
Fig. 3.
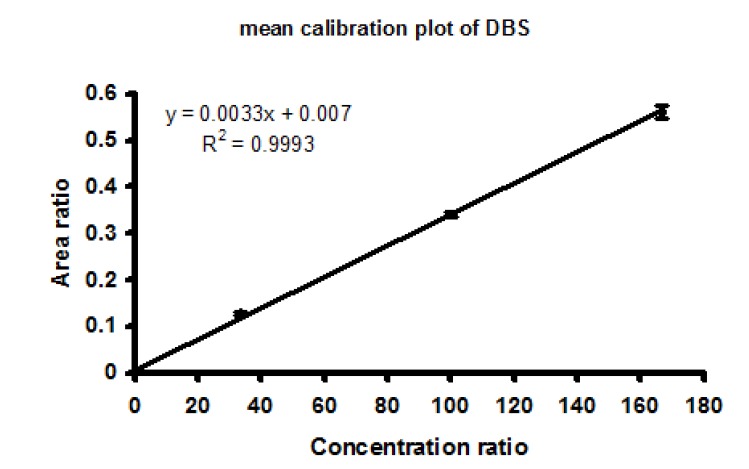
Calibration plot, which was constructed using a mean concentration ratio versus a mean area ratio from 11 calibration lines. A 95% confidence interval has been shown for each data points
Effect of storage time on the stability of retinol in DBS
Fig. 4 shows the stability of retinol in DBS during the first week of storage at room temperature.
Fig. 4.
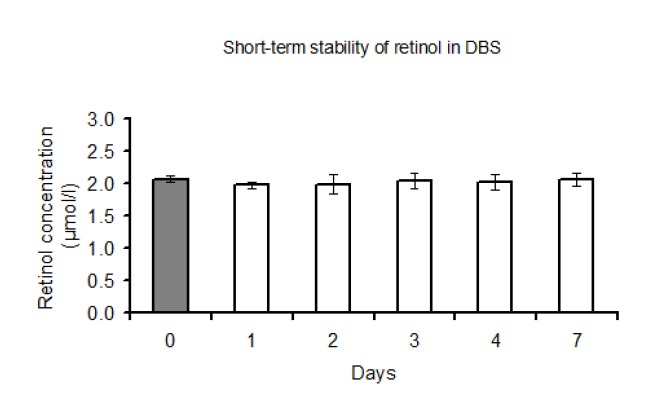
Stability of retinol in DBS during the first week of DBS storage at room temperature (ca. 23°c). The solid column corresponds with the amount of retinol in plasma from which the dried blood spots were prepared. The error bars indicate 95% confidence intervals
Retinol concentration was stable during this period. Long term storage at minus temperatures did not lead to decrease in the amount of retinol in DBS. As can be seen in Fig. 5, retinol concentration in DBS remained constant upon 90 days of storage. In this figure, the coefficient of the regression line was -0.0007 (P=0.64), indicating no significant changes in retinol concentration.
Fig. 5.
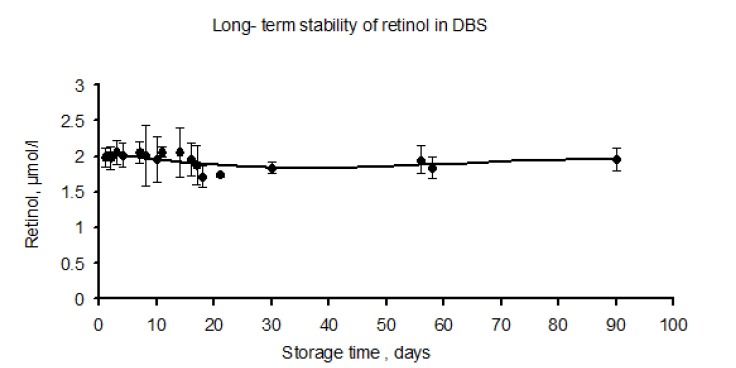
Effect of long-term storage time on the stability of retinol in the dried whole blood spots. In the first week DBS were stored at room temperature (ca. 23°c), followed by storage at –20 °C for three months. The error bars indicate 95% confidence intervals
Method validation
Precision (repeatability) of DBS method
Table 1 shows the intra-assay; inter-assay and total variation based on a single measurement for both DBS and plasma methods. Intra-assay variation of DBS was not significantly different from that of plasma (P=0.61).
Table 1. Intra-assay, inter-assay and total variation based on a single measurement for both the dried blood spot (DBS) and the plasma methods.
| Method | ||
| DBS | Plasma | |
| Retinol (mmol/l)(1) | 1.74±0.07 | 2.06±0.05 |
| Inter-assay (2) variation CV (%) | 2.57 a | 3.44 a |
| Intra-assay (3)variation CV (%) | 3.26 a | 0.97 b |
| Total variation(4)(%) | 4.15 a | 3.57 a |
(1) Mean±SD, The mean values for DBS and plasma are not comparable. Because the blood used for plasma measurements was different from the blood used for DBS measurements.
(2) n=2 for both methods
(3) n=11 for DBS and n=14 for plasma estimated during two weeks period
(4) Total variation(imprecision) based on single measurement of a sample
Inter-assay variation of the DBS however, was significantly larger than that of the plasma measurements (P=0.02). The total variation of DBS method was not significantly different from that of plasma method (P= 0.50).
Assessment of agreement between the DBS and the plasma method
The closeness of retinol values of DBS to those of plasma was assessed using correlation and Bland-Altman plots. Fig. 6 presents a plot of retinol in DBS versus retinol in plasma obtained from 21 subjects. The correlation coefficient between plasma retinol and DBS retinol showed a value of 0.78 (P =0.00003) with a R2= 0.59 (Table 2).
Fig. 6.
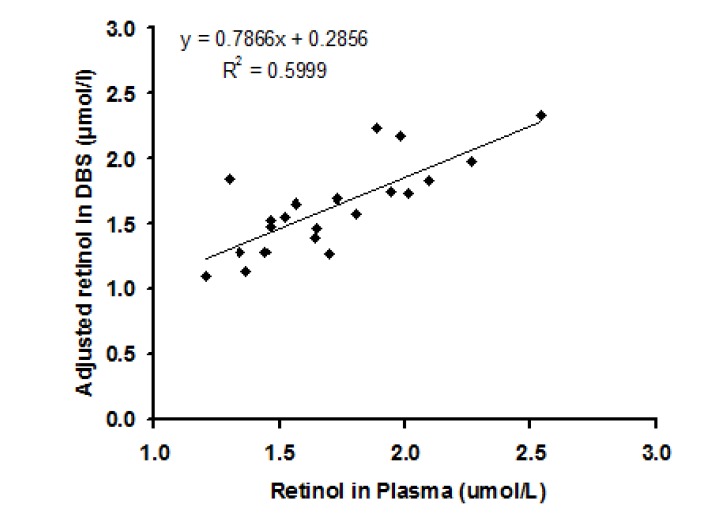
Correlation between retinol amount in plasma and in DBS obtained from 21 subjects
Table 2. The retinol amount measured in plasma versus its amount in DBS and the correlation coefficient between these two methods.
| Method | Retinol (mmol/l) | Correlation with plasma |
| Plasma (n=21) | 1.71±0.34 (1) | - |
| DBS (n=21) | 1.63±0.35 | 0.78 (2) |
(1)Mean ± SD
(2)P = 0.00003
In Fig. 7, the relation between the differences of DBS and plasma retinol against their mean values (Bland-Altman plot) is illustrated. A regression analysis was carried out to find out any regression of the difference between two methods on the mean of these methods. The coefficient of the regression line was –0.017 (P = 0.924), indicating that there is no significant level-dependent bias. Therefore, the difference between two methods is not dependent on the level of the retinol concentration. Plotting the data points of Bland-Altman chart showed that the data points are normally distributed. Therefore, it was possible to safely use the paired t-test for the comparison of the two methods. Using the paired t-test the difference between the two methods was not significantly different from zero (P= 0.2). This indicates that on a group level, plasma retinol measurements were not significantly different from dried blood spot retinol measurements.
Fig. 7.
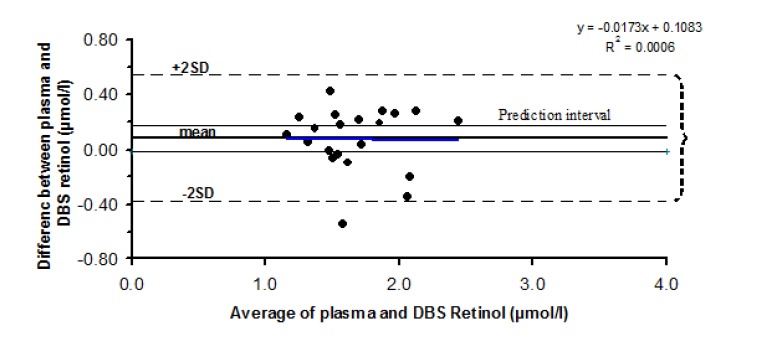
Relation between the difference of the DBS and plasma measurements against their mean. The regression line and prediction interval are shown in the figure
The prediction interval was constructed based on the standard deviation of the difference between plasma measurements, under repeatability condition. As shown in Fig. 7, the majority of data points lie outside the acceptable prediction interval, which shows that the difference between two methods is not within the acceptable limit with respect to the individuals. Furthermore, as can be seen in Fig. 7, the limits of agreement interval are far wider than the prediction interval.
Discussion
The measurement of plasma retinol in remote areas, lacking necessary laboratory facilities is a problematic issue. This can be overcome by taking only a few drops of blood on a filter paper, which is known as dried blood spot method. In the current study, the validity of DBS technique to assess vitamin A status was investigated. The validation procedure involved the evaluation of DBS calibrators, the assessment of retinol stability in DBS samples during the storage, evaluation of precision of this technique and agreement of DBS measurement compared to the conventional plasma measurement. The results showed that the DBS calibrators can reliably be used in measurement of retinol in DBS samples. Moreover, retinol was stable in the DBS samples for a period of 90 days under conditions described in this study. It was also concluded that the precision of the DBS method is comparable with the precision of the plasma method. The findings indicated the agreement of two methods only on group level not on individual level.
Reliability of the DBS calibrators
Application of standard DBS samples as calibrators for HPLC analysis resulted in a reliable calibration procedure for the DBS measurements. Thus, this calibrator can safely be used for the calibration purpose. Moreover, it was revealed that it is possible to make a reliable calibration line by replacing a part of plasma with artificial plasma. Using this procedure, one may not need to an adjustment factor to correct the reduction bias and extraction efficiency of retinol in DBS samples. Therefore, these calibrators eliminated the necessity of having sub-samples of matching plasma. These sub-samples were necessary to determine an adjustment factor. This is an improvement over previous studies, in which they used three concentrations of retinol solutions for calibration in determination of retinol in DBS [11,12,14].
Effect of storage time on the stability of retinol in DBS
To evaluate the effect of storage time on the stability of retinol, DBS samples were kept at ambient temperature (RH=18%) for 7 days. This period was proposed to get a stable retinol in DBS based on the results of other studies in which they observed a 20% reduction of retinol in DBS during first week of storage [12,14]. Moreover, a period of 7 days considered as a time interval to transport samples form field to the analytical laboratories. DBS samples were then stored at -20°C, because it has been shown [12] that DBS retinol is more stable to oxidation at freezing temperatures during long storage time. In contrast to those studies, we did not observe significant reduction in DBS retinol during the 7 days storage (Fig. 4). The stability of retinol during the first week of storage might be related to dry storage condition (RH=18%) in which the spots were kept on the first day. This phenomenon has also been described by Erhardt et al. [14] who stated that storage under humid conditions could lead to a loss of retinol in DBS samples. Retinol, which is vulnerable to oxidation and light, is not stable in DBS, especially at ambient temperature. However, it is known that retinol in plasma appears in a complex protein form [16]. In such complex form, retinol is stable in plasma. When the complex is broken by addition of ethanol (during the first stage of extraction) retinol becomes susceptible for instability [13]. This is also evident from the stability of retinol in DBS in this study. If retinol in DBS remains stable after blood collection it will probably lead to more reliable and less cumbersome measurement of retinol in DBS.
Method validation
Imprecision of DBS method
Imprecision of DBS measurements showed an acceptable low value of 4%, compared to that of retinol measurements in plasma. However, with respect to day variations this was reverse. This could be either due to the small but non-significant reduction of retinol in DBS during storage, or different calibrators used for different runs. The results showed that DBS method is a precise procedure with respect to the total variation.
Agreement between DBS and plasma retinol measurements
Plasma volume in DBS
Since Hct measurements show constant values [17], we used this criterion to calculate the volume of plasma. The Hct value could be determined by Hemo Cue B-Hemoglobin Photometer in the field conditions [18]. The instrument is battery operated device and the procedure requires only a few droplets of blood from finger prick, which can be taken at the same time of collection of blood for filter papers.
Correlation between DBS and plasma retinol measurements
The correlation between DBS retinol and plasma retinol in the current study was slightly low (R2=0.59). However, this value is acceptable for epidemiological purposes. Other researchers [11,12,14,19] found higher R2 values (0.88-0.95). The low correlation coefficient values between two methods in our study could be related to the fact that we did not use an adjustment factor for both recovery and reduction bias. This was the case in the reported studies.
Assessment of agreement using Bland – Altman plot
To assess the agreement between the two methods, Bland-Altman plot was used which is more appropriate and informative for this purpose [15]. Using regression analysis it was revealed that the slope was not significantly different from zero, indicating no level-dependent bias. It means that an increase in the retinol value does not change the difference between two measurements. Statistically we could not find a significant difference between two methods; however the mean difference between these methods was 8%, which was higher than the accepted 3% value for this kind of measurements. The non–significant difference on group level was perhaps due to the small sample size (n =21). Thus, we cannot draw a strong conclusion on group level validity.
The agreement between individual measurements was evaluated by drawing a prediction interval. Most of the data points, which show the individual difference, were not within the prediction interval. Moreover, the interval for limits of agreement was much wider than the prediction interval, indicating the considerable lack of agreements between two methods with respect to individual level.
Conclusions
Application of DBS standard samples in which a part of the plasma was replaced by artificial plasma is a reliable calibration mean for retinol measurements in DBS samples. Under the conditions described in this study, retinol concentration in DBS was stable for 90 days. The DBS method provided a precise measurement of retinol, giving comparable results with the measurement of retinol in plasma. The difference between two methods was not statistically significant on group level, which was maybe due to the small sample size. Thus, strong conclusion on group level validity can not be drawn. Therefore, in the studies in which group levels is intended to be used, DBS method is not recommended to be the method of choice. If the collection and transportation of plasma is easily possible, this technique can make the assessment of vitamin A status much easier. The difference between two methods was significant on individual level. Therefore, DBS method is not recommended for the studies in which retinol concentration of individuals is intended to be determined.
Acknowledgments
This study was supported by Department of Human Nutrition and Epidemiology, Wageningen University, the Netherlands. The cooperation of P.J.M. Hulshof, P.Versloot, J. Durga and participants of FACIT study is gratefully acknowledged. The authors declare that there is no conflict of interest.
References
- [1].Maberly G, Trowbridge FL, Yip R, Sullivan KM, West CE. Program against micronutrient malnutrition: ending hidden hunger. Annu Rev Public Health. 1994;15:277–301. doi: 10.1146/annurev.pu.15.050194.001425. [DOI] [PubMed] [Google Scholar]
- [2].Underwood BA. Micronutrient mal-nutrition. Is it being eliminated? Nutrition Today. 1998;33:121–129. [Google Scholar]
- [3].Semba RD, Miooti PG, Chiphangwi JD, Saah AJ, Canner JK, Dallabetta GA, Hoover DR. Maternal vitamin A deficiency and mother-to-child transmission of HIV-1. Lancet. 1994;343:1593–1596. doi: 10.1016/s0140-6736(94)93056-2. [DOI] [PubMed] [Google Scholar]
- [4].Sommer A, Katz J, Tarwotjo I. Increased risk of respiratory disease and diarrhea in children with pre-existing mild vitamin A deficiency. Am J Clin Nutr. 1984;40:1090–1095. doi: 10.1093/ajcn/40.5.1090. [DOI] [PubMed] [Google Scholar]
- [5].Underwood B, Arthur P. The contribution of vitamin A to public health. FASEB J. 1996;10:1040–1048. [PubMed] [Google Scholar]
- [6].Sommer A. moving from science to public health programs: lessons from vitamin A. Am J Clin Nutr. 1998;68:513S–516S. doi: 10.1093/ajcn/68.2.513S. [DOI] [PubMed] [Google Scholar]
- [7]. WHO/UNICEF. Report: Indicators for assessing vitamin A deficiency and their application in monitoring and evaluating intervention programmes. Geneva; 1994.
- [8].O’Broin SD, Gunter EW. Screening of folate status with use of dried blood spots on filter paper. Am J Clin Nutr. 1999;70:359–367. doi: 10.1093/ajcn/70.3.359. [DOI] [PubMed] [Google Scholar]
- [9].Zimmermann MB, Moretti D, Chaouki N, Torresani T. Development of a dried whole blood spot thyroglobulin assay and its evaluation as an indicator of thyroid status in goitrous children receiving iodized salt. Am J Clin Nutr. 2003;77:1453–1458. doi: 10.1093/ajcn/77.6.1453. [DOI] [PubMed] [Google Scholar]
- [10].National Committee for. Blood collection on filter paper for neonatal screening programs: approved standard. 3rd ed. 1997;17:LA4–A3. [Google Scholar]
- [11].Craft NE, Bulux J, Valdez C, Li Y, Solomons NW. Retinol concentrations in capillary dried blood spots from healthy volunteers: method validation. Am J Clin Nutr. 2000;72:450–454. doi: 10.1093/ajcn/72.2.450. [DOI] [PubMed] [Google Scholar]
- [12].Craft NE, Haitema T, Brindle LK, Yamini S, Humphrey JH, West KP. Retinol analysis in dried blood spots by HPLC. J Nutr. 2000;130:882–885. doi: 10.1093/jn/130.4.882. [DOI] [PubMed] [Google Scholar]
- [13].Driskell JW, Bashor MM, Neese WJ. Loss of vitamin A in long –term stored, frozen area. Clin Chim Acta. 1985;147:25–30. doi: 10.1016/0009-8981(85)90006-3. [DOI] [PubMed] [Google Scholar]
- [14].Erhardt JG, Craft NE, Heinrich F, Bielaski HK. Rapid and simple measurement of retinol in dried whole blood spots. J Nutr. 2002;132:318–321. doi: 10.1093/jn/132.2.318. [DOI] [PubMed] [Google Scholar]
- [15].Bland JM, Altman DG. Statistical methods for assessing agreement between two methods of clinical measurement. Lancet. 1986;1:307–310. [PubMed] [Google Scholar]
- [16].Oliver RW, Kafwembe EM, Mwandu D. Stability of vitamin A circulating complex in spots of dried serum samples absorbed onto filter paper. Clin Chem. 1993;39:1744–1745. [PubMed] [Google Scholar]
- [17]. Scientific Tables Geigy, Hematology 2 Ciba Geiga AG Basel S. Hematology 2 Ciba Geiga AG. Basel, Switzerland 1979.
- [18].Lock JP, Szuts EZ, Malomo KJ, Anagnostopoulos A. Whole-blood glucose testing at alternate sites: glucose values and hematocrit of capillary blood drawn from fingertip and forearm. Diabetes Care. 2002;25:337–341. doi: 10.2337/diacare.25.2.337. [DOI] [PubMed] [Google Scholar]
- [19].Craft NE. Innovative approaches to vitamin A assessment. J Nutr. 2001;131:1626s–1630s. doi: 10.1093/jn/131.5.1626S. [DOI] [PubMed] [Google Scholar]


