

The Global Burden of Disease (GBD) 2010 project is a massive effort to systematically describe the epidemiology of a wide array of major diseases, injuries and risk factors. It collates millions of observations and has involved collaboration of nearly 500 scientists from 50 countries. Just to give some idea of the size of the endeavour, the analysis has included 800 million deaths. It has taken 5 years to come to the point where The Lancet was able to publish the headline results, 1–7 but the database is so incredibly rich that there are likely to be hundreds of subsequent papers using this data source. One can anticipate papers on each risk factor (or groups of risk factors – such as dietary risk factors); each disease or specialty; each region; each country, and then local papers on disease outcomes within each country or region.
This paper gives some indication of the richness of the data and how these can be used. Of course, like anything else, GBD 2010 is not perfect. It would be totally unrealistic to expect such a huge project to fulfill every requirement for absolute scientific rigour. But it has now come to a stage of sufficient maturity that people are able to see not just the importance of these data, but also they can identify weaknesses in the data collection in some geographic and medical areas. Efforts to address the deficiencies have already been initiated and we can look forward to even more reliable estimates in the future. We should remember, however, that this analysis provides estimates rather than definitive numbers; and it's about relative contributions to medical problems. Does it really matter if the estimates of cardiovascular deaths globally, for example, are out by a million – the uncertainty interval on the estimate 2 ? And does it matter if these errors result in ischaemic heart disease being second in the list of causes of death rather than first in the list? What these estimates do tell us is the relative size of the burden: that cardiovascular disease accounts for vastly more deaths worldwide than, for example, infectious disease.
So what sort of things can we learn from GBD 2010? Cardiovascular diseases account for 30% of all deaths worldwide. Ischaemic heart disease (13.3%) and strokes (11.1%) are at the top of the list of causes of death. In the heatmap (Figure 1) in only one region is cardiovascular diseases not in the top 10 causes of death. This suggests that cardiovascular disease, across the world, is where investment in research, policy and treatment might be most effectively employed.
Figure 1. .

Heatmap of the top 20 causes of death by GDB region in 2010. Redrawn from www.healthmetricsandevaluation.org/gbd/visualizations.
Compared with ischaemic heart disease, topics which in the past were considered to be extremely important and warranting huge research budgets apparently contribute relatively little to global deaths: malaria (2.2%), tuberculosis (2.3%), HIV (2.8%). 2 A similar pattern is seen for disability adjusted life years (DALYs), where ischaemic heart disease is responsible for twice the number of DALYs as tuberculosis (Figure 2). Overall, non-communicable diseases (NCDs) such as ischaemic heart disease, cerebrovascular disease and respiratory disorders, are responsible for 65.5% of deaths, and much more disability, than the traditional infectious diseases. This might be a positive benefit from research into infectious diseases (vaccines and disease control) through initiatives like the Gates Foundation. The battle against these diseases is still far from won, however.
Figure 2. .

Comparison of the ten leading diseases and injuries (blue) and the ten leading risk factors (red) based on percentage of global deaths and percentage of DAYLs. Reprinted from Murray et al 11 by kind permission of the authors and The Lancet.
The GBD 2010 studies show not only the causes of disease, but which age groups are affected. Figure 3 shows global deaths by age group. After the susceptible neonatal period, the number of deaths is low and increases slowly through until about 55. It might come as no surprise that death is increasingly more likely after 55 years of age, but the rate of changes in life expectancy with age are intriguing. Figure 4 shows the decline in deaths by age.
Figure 3. .
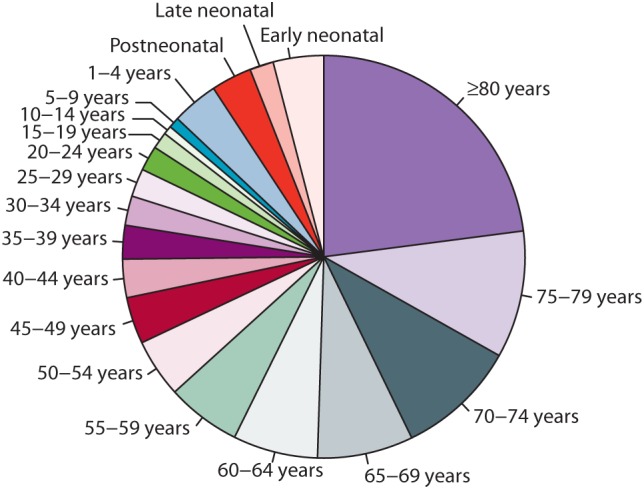
Global deaths by age groups in 2010. Reprinted from Wang et al. 1 with kind permission of the authors and The Lancet.
Figure 4. .

Decline in age-specific mortality between 1970 and 2010. Reprinted from Wang et al. 1 with kind permission of the authors and The Lancet.
The age-specific decline in deaths is reported by Wang et al. (Figure 4) 1 . It is a little confusing since a higher point on the graph actually reflects better outcomes. Mortality has decreased less among young adults (especially young males) than in other age groups. This might be because this age group have a naturally low rate of death, but it might also reflect the fact that young adult men are primarily those who are at increased risk of death as combatants in war; this age group is also the most likely to engage in risky behaviours – and to die as a result of traffic accidents. 2 Even so, every age group now shows a higher life expectancy than the 1970 estimates.
It is encouraging to see there have been huge strides in reducing infant mortality: deaths among the 1–4 year age group have dropped by 70%. In 1970, deaths in those younger than 5 years accounted for 38% of deaths worldwide; by 2010 this was down to 13%. Whether or not it is causal, it seems that the Millennium Development Goals regarding infant mortality are well on the way to being successfully met. The job is not complete since deaths in the first 4 years of life are still greater than any other age group except over 80s (Figure 3) but now might be a time to begin planning for the next focus of priorities.
Over the past 20 years global population life expectancy has increased in almost all countries. GBD 2010 also presents the changes in deaths by geographic region. 1 Much more detailed analysis can be found at www.healthmetricsandevaluation.org/gbd/visualizations. All regions of the world have seen an increase in life expectancy since 1990 as demonstrated in Figure 5 where all points are below the line. Life expectancy is longest in high-income countries, and shortest in Africa. But Africa has made massive strides. In Western Europe life expectancy has increased by 8 years (from about 68 years to 76 years), but in North Africa and the Middle East, for example, life expectancy has more than doubled from 22 years in 1970 to 52 years in 2010. An extra 30 years of life. Life expectancy in this region is, however, still relatively short.
Figure 5. .

Comparison of the mean age of death in 1970 and 2010 in different regions of the world. Reprinted from Wang et al. 1 with kind permission of the authors and The Lancet.
In general, the causes of death in 2010 are similar to causes of death in 1990. 2 Lozano et al. 2 clearly show (Figure 6) that cardiovascular diseases becomes an increasingly important cause of death with ageing, and cancer remains a big killer of adults, but there have been some notable changes. Amongst females, deaths due to maternal disorders have reduced. By contrast deaths from HIV/AIDS and tuberculosis have risen due to a rise in deaths from HIV/AIDS. It is also interesting to see that transport deaths are much more prevalent in men than women.
Figure 6. .

Global causes of deaths (%) for males (A and C) and females (B and D) in 1990 (A and B) and 2010 (C and D). Reprinted from Lozano et al. 2 with kind permission of the authors and The Lancet.
Figure 7 provides an alternative way of looking at the relative changes in causes of death between 1990 and 2010. HIV deaths have increased massively, but causes of fetal/ neonatal death (preterm complications, neonatal sepsis, neonatal encephalopathy) have been radically reduced.
Figure 7. .

Top 25 causes of death in 1990 and 2010. Reprinted from Lozano et al. 2 with kind permission of the authors and The Lancet.
What is striking is that with the exception of HIV/AIDS, the ranking of deaths due to infections have decreased substantially. By contrast non-communicable diseases have become more important causes of death. The lines between the ranking tell the story of relative importance, but one needs to look beyond the lines to get a better idea of change. Although malaria has declined in relative importance from 9th to 11th, this masks a 21% increase in absolute numbers of deaths as shown in the right hand column. Overall, however, the picture of change generally reflects absolute changes. Ischaemic heart disease and stroke remain the two biggest causes of death. Of non-communicable diseases, only stomach cancer, rheumatic heart disease and congenital anomalies have declined in importance. Perhaps emphasis on research and policy should now start to focus more on non-communicable diseases.
The GBD database is a massive resource and the papers published in December 2012 are headline summaries. It can be expected that there will be many future papers looking at specific diseases and regions. One can expect at least one detailed paper on cardiovascular disease, but the headline data provide some interesting insights, such as the years living with disability due to heart failure around the world. 5
These data might be of interest to physicians and health policy-makers in specific regions and can be useful to prioritise policy in particular regions. It can be seen in Figure 8 that the effect of iodine deficiency is largely confined to the North Africa and Middle East. Perhaps this might stimulate more investment in iodised salt in North Africa and Middle East countries. It is also apparent that endocarditis is more prevalent in Oceania than elsewhere, and this might inform funding for endocarditis research in that region.
Figure 8. .

Years lived with disability from heart failure by cause and region in 2010. Reprinted from Vos et al. 5 with kind permission of the authors and The Lancet.
The headline analysis also provides insights into subspecialty causes of deaths. 2 A global picture of causes of cardiovascular deaths is in Table 1. The number of cardiovascular deaths has increased 31% from 12 million to 16 million deaths between 1990 and 2010, 2 but of course this needs to be considered in the context of an increase in the global population. In that perspective, the 25% reduction in the number of deaths due to rheumatic heart disease is notable. The absolute numbers of deaths due to most other cardiovascular conditions have increased, but so has the mean age of the population. Diseases such as atrial fibrillation which are more prevalent in the elderly, are therefore expected to be more common as the population ages. For most of the cardiovascular diseases in Table 1 age-standardised mortality rate has decreased, but atrial fibrillation shows an 89% age-standardised increase. The other condition with an increased age-standardised mortality is peripheral vascular disease. This probably reflects the increase in diabetes associated with changing life styles and increased age.
Table 1 .
Causes of deaths and age-standardised death rates, with 95% uncertainty interval, from cardiovascular and circulatory diseases in 1990 and 2010.
| All ages deaths (thousands) | Age-standardised death rates (per 100 000) | |||||
| 1990 | 2010 | Δ% | 1990 | 2010 | Δ% | |
| Cardiovascular and circulatory diseases | 11 903.7 (11 329.4–12 589.3) | 15 616.1 (14 542.2–16 315.1) | 31.2% | 298.1 (283.9–314.9) | 234.8 (218.7–245.2) | − 21.2 |
| Rheumatic heart disease | 462.6 (431.5–517.7) | 345.1 (305.8–374.3) | − 25.4% | 11.1 (10.3–12.4) | 5.2 (4.6–5.6) | − 53.1 |
| Ischaemic heart disease | 5211.8 (5014.5–5643.9) | 7029.3 (6577.2–7431.1) | 34.9% | 131.3 (126.4–142.2) | 105.7 (98.8–111.9) | − 19.5 |
| Cerebrovascular disease | 4660.4 (4436.1–5154.9) | 5874.2 (5304.7–6280.1) | 26.0% | 105.7 (98.8–111.9) | 88.4 (79.8–94.4) | − 24.6 |
| Ischaemic stroke | 2241.1 (2088.0–2494.9) | 2835.4 (2657.0–3262.8) | 26.5% | 57.6 (53.7–64.0) | 42.3 (39.6–48.7) | − 26.6 |
| Non-ischaemic stroke | 2419.4 (2050.9–2827.9) | 3038.8 (2643.4–3496.9) | 25.6% | 59.7 (50.6–69.7) | 46.1 (40.1–53.1) | − 22.7 |
| Hypertensive heart disease | 590.7 (481.0–740.6) | 873.2 (715.5–1074.1) | 47.8% | 14.9 (12.1–18.6) | 13.1 (10.8–16.2) | − 11.5 |
| Cardiomyopathy and myocarditis | 286.8 (250.5–316.8) | 403.9 (361.5–450.4) | 40.8% | 6.7 (5.9–7.4) | 6.1 (5.4–6.8) | − 9.8 |
| Atrial fibrillation and flutter | 34.4 (27.9–43.1) | 114.7 (92.7–144.7) | 233.9% | 0.9 (0.7–1.1) | 1.7 (1.4–2.1) | 89.6 |
| Aortic aneurysm | 131.9 (94.6–173.3) | 191.7 (140.3–249.2) | 45.3% | 3.3 (2.4–4.3) | 2.9 (2.1–3.8) | − 12.7 |
| Peripheral vascular disease | 18.6 (12.2–28.7) | 49.8 (32.9–74.8) | 167.0% | 0.5 (0.3–0.7) | 0.7 (0.5–1.1) | 53.3 |
| Endocarditis | 35.8 (30.0–44.4) | 48.3 (39.3–55.4) | 34.8% | 0.8 (0.7–1.0) | 0.7 (0.6–0.8) | − 8.0 |
| Other cardiovascular diseases | 470.6 (446.3–489.9) | 685.9 (664.0–705.3) | 45.7% | 11.5 (11.0–11.9) | 10.3 (9.9–10.5) | − 10.9 |
GBD 2010 doesn't only report deaths. It also reports the burden of disease in terms of years lived with disabilities, 5 disability adjusted life years 6 and risk factors for disease and injury. 7 The years of life lost (YLL) analysis shows a slightly different pattern. Ischaemic heart disease and stroke are still near the top of the list, 2 but Figure 9 reflects the effect of disease early in life on total years lost. Serious diseases of infancy and childhood achieve a greater prominence when analysed by YLL. In this analysis infectious diseases are more important causes of YLL but they have all (except HIV) also decreased in number – presumably as a result of the success of immunisation programmes.
Figure 9. .

The top 25 causes of years of life lost in 1990 and 2010. Reprinted from Lozano et al. 2 with kind permission of the authors and The Lancet.
There remain too many people in the world who are hungry. It is encouraging that deaths due to malnutrition have fallen by 32%, but it still ranks as 21st in the list. And there is also a decline in ranking by YLL but, because malnutrition in childhood has long term effects, it remains as the 15th commonest cause of years lost (Figure 9). The decrease in malnutrition probably reflects major advances in agriculture as well as medicine.
Although less headline-grabbing than deaths, DALYs are particularly important to inform government health policies. The causes of DALYs by regions 6 are interesting as a reflection of events (both natural and man-made). It is well known that there has been an explosion of HIV in Southern subSaharan Africa and this is clearly demonstrated in Figure 10. The effect of the Haitian earthquake is also reflected in the war and disaster statistics in the Caribbean region. And in good news, the DALYs due to diarrhoea and respiratory infections have declined substantially in central and southern America and in south east and central Asia. The data presented here are regional estimates, but national estimates (available at www.healthmetricsandevaluation.org/gbd/country-profiles/) can help governments decide which diseases should be their priority for treatment and prevention. In terms of reducing incidence of disease, the risk factors data provides information that needs careful consideration that can have an impact on government decisions.
Figure 10. .

Disability adjusted life years (%) by cause and region in 1990 (A) and 2010 (B). Reprinted from Murray et al. 6 with kind permission of the authors and The Lancet.
Some of the risk factors for disease are not a surprise: smoking causes cancer; high glucose is associated with diabetes. The change in relative importance of risk factors between 1990 and 2010 can be found in the paper by Lim et al. 7 Risk factors are especially important for the predicting the future global burden of diseases. Identifying the most important risk factors to reduce DALYs can help decide on health policy strategies. For example, is money best spent on anti-smoking campaigns, on promoting exercise, or reducing pollution? Figure 11 shows the analysis for 2010 and this can be a starting point for policy changes that will influence future health outcomes.
Figure 11. .

Top 20 risk factors for disease in 2010 expressed as disability-adjusted life-years. Redrawn from Lim et al. 7 with permission of the authors and The Lancet.
A careful look at Figure 11 provides some interesting insights into how policies to address health issues might sometimes promote solutions which might not necessarily be those that will have the biggest effect on health. The analysis in Figure 11 provides an example of where perhaps these analyses might influence future priorities. It is no surprise that tobacco is a prominent cause of DALYs, and around the world Governments are working to reduce tobacco consumption. It might be less obvious that household air pollution is so important. These data might stimulate promotion of cleaner household fuels. However, there are some anomalies. High blood pressure is identified as the major burden of DALYs. To counteract this there are moves to reduce salt intake, but this might not be the most effective way to promote health since a diet high in sodium is way down the list of risk factors. That discrepancy supports the fact that, despite association studies linking salt intake and hypertension, direct evidence that high salt intake increases blood pressure in non-hypertensive people is very weak. Perhaps focusing health campaigns on other factors would be more beneficial. Much further up the list of important risk factors is a diet low in fruit. It is known that fruit is beneficial in avoiding major killers like heart disease and cancer, 8 but this gets little positive action from governments. At the very least, the risk factors identified in GBD 2010 should encourage a critical scientific re-evaluation of the hard evidence underpinning policies on risk factors. It might be fashionable (and easy) to blame the fast food industry for obesity or the soft drinks industry for diabetes, but it seems that increasing fruit intake would be a more important initiative for improving health.
This paper indicates some of the ways in which the Global Burden of Disease 2010 study can be of interest and value, but it merely scratches the surface. The main analyses of GBD 2010 are published in The Lancet 1–7 and regional, country and specialty specific analysis are likely to follow. Many more GBD 2010 analyses are available at www.healthmetricsandevaluation.org/gbd/visualizations.
In conclusion, GBD 2010 can be important in framing health policies and objectives both globally and in specific countries. The first country specific analysis from the GDB team was an assessment of the UK. 9 The UK government was represented at the launch of the GBD 2010 presentation in London in 2012 and recognised the findings should inform policy. In March 2013 the Department of Health in the UK published a call to action. 10 It would be surprising if other governments did not follow this lead, and more country-specific analyses are expected. In depth analysis of the data will also help refine attitudes to risk factors and influence research priorities in specific regions and countries. As NCDs are the major cause of death and disability perhaps it is time to reconsider the priorities for research and policy initiatives away from the current HIV, tuberculosis and malaria programmes. And now might be the time to start considering whether more emphasis might be placed on death and disease in adults now infant mortality has been so substantially reduced. Analysis by medical specialty will also shape research priorities and research programmes in specific regions. Finally, the GBD 2010 has highlighted weaknesses in data collection in some geographic and specialty areas and moves have already begun to improve the databases to make future assessments more rigorous.
Conflicts of interest SS is a full time editor at The Lancet but has no other relations with any aspect of the Global Burden of Disease Study, and no financial interests.
Acknowledgement
My thanks to Prof CJL Murray and The Lancet for permission to re-use figures from the GBD 2010 papers. I am especially grateful to A Roots for redrawing the figures.
References
- [1].Wang H, Dwyer-Lindgren L, Lofgren KT, Rajaratnam JK, Marcus JR, Levin-Rector A, Levitz C, Lopez AD, Murray CJL. Age-specific and sex-specific mortality in 187 countries, 1970–2010: a systematic analysis for the Global Burden of Disease Study 2010. Lancet. 2012;380:2071–2094. doi: 10.1016/S0140-6736(12)61719-X. [DOI] [PubMed] [Google Scholar]
- [2].Lozano R, Naghavi M, Foreman K, Lim S, Shibuya K, Aboyans V, Abraham J, Adair T, Aggarwal R, Ahn SY, Alvarado M, Anderson HR, Anderson LM, Andrews KG, Atkinson C, Baddour LM, Barker-Collo S, Bartels DH, Bell ML, Benjamin EJ, Bennett D, Bhalla K, Bikbov B, Bin Abdulhak A, Birbeck G, Blyth F, Bolliger I, Boufous S, Bucello C, Burch M, Burney P, Carapetis J, Chen H, Chou D, Chugh SS, Coffeng LE, Colan SD, Colquhoun S, Colson KE, Condon J, Connor MD, Cooper LT, Corriere M, Cortinovis M, de Vaccaro KC, Couser W, Cowie BC, Criqui MH, Cross M, Dabhadkar KC, Dahodwala N, DeLeo D, Degenhardt L, Delossantos A, Denenberg J, Des Jarlais DC, Dharmaratne SD, Dorsey ER, Driscoll T, Duber H, Ebel B, Erwin PJ, Espindola P, Ezzati M, Feigin V, Flaxman AD, Forouzanfar MH, Fowkes FGR, Franklin R, Fransen M, Freeman MK, Gabriel SE, Gakidou E, Gaspari F, Gillum RF, Gonzalez-Medina D, Halasa YA, Haring D, Harrison JE, Havmoeller R, Hay RJ, Hoen B, Hotez PJ, Hoy D, Jacobsen KH, James SL, Jasrasaria R, Jayaraman S, Johns N, Karthikeyan G, Kassebaum N, Keren A, Khoo J-P, Knowlton LM, Kobusingye O, Koranteng A, Krishnamurthi R, Lipnick M, Lipshultz SE, Ohno SL, Mabweijano J, MacIntyre MF, Mallinger L, March L, Marks GB, Marks R, Matsumori A, Matzopoulos R, Mayosi BM, McAnulty JH, McDermott MM, McGrath J, Mensah GA, Merriman TR, Michaud C, Miller M, Miller TR, Mock C, Mocumbi AO, Mokdad AA, Moran A, Mulholland K, Nair MN, Naldi L, Venkat Narayan KM, Nasseri K, Norman P, O'Donnell M, Omer SB, Ortblad K, Osborne R, Ozgediz D, Pahari B, Pandian JD, Rivero AP, Padilla RP, Perez-Ruiz F, Perico N, Phillips D, Pierce K, Pope CA, III, Porrini E, Pourmalek F, Raju M, Ranganathan D, Rehm JT, Rein DB, Remuzzi G, Rivara FP, Roberts T, De Leòn FR, Rosenfeld LC, Rushton L, Sacco RL, Salomon JA, Sampson U, Sanman E, Schwebel DC, Segui-Gomez M, Shepard DS, Singh D, Singleton J, Sliwa K, Smith E, Steer A, Taylor JA, Thomas B, Tleyjeh IM, Towbin JA, Truelsen T, Undurraga EA, Venketasubramanian N, Vijayakumar L, Vos T, Wagner GR, Wang M, Wang W, Watt K, Weinstock MA, Weintraub R, Wilkinson JD, Woolf AD, Wulf S, Yeh P-H, Yip P, Zabetian A, Zheng Z-J, Lopez AD, Murray CJL. Global and regional mortality from 253 causes of death for 20 age groups in 1990 and 2010: a systematic analysis for the Global Burden of Disease Study 2010. Lancet. 2012;380:2095–2128. doi: 10.1016/S0140-6736(12)61728-0. [DOI] [PMC free article] [PubMed] [Google Scholar]
- [3].Salomon JA, Vos T, Hogan DR, Gagnon M, Naghavi M, Mokdad A, Begum N, Shah R, Karyana M, Kosen S, Farje MR, Moncada G, Dutta A, Sazawal S, Dyer A, Seiler J, Aboyans V, Baker L, Baxter A, Benjamin EJ, Bhalla K, Bin Abdulhak A, Blyth F, Bourne R, Braithwaite T, Brooks P, Brugha TS, Bryan-Hancock C, Buchbinder R, Burney P, Calabria B, Chen H, Chugh SS, Cooley R, Criqui MH, Cross M, Dabhadkar KC, Dahodwala N, Davis A, Degenhardt L, Díaz-Torné C, Dorsey ER, Driscoll T, Edmond K, Elbaz A, Ezzati M, Feigin V, Ferri CP, Flaxman AD, Flood L, Fransen M, Fuse K, Gabbe BJ, Gillum RF, Haagsma J, Harrison JE, Havmoeller R, Hay RJ, Hel-Baqui A, Hoek HW, Hoffman H, Hogeland E, Hoy D, Jarvis D, Karthikeyan G, Knowlton LM, Lathlean T, Leasher JL, Lim SS, Lipshultz SE, Lopez AD, Lozano R, Lyons R, Malekzadeh R, Marcenes W, March L, Margolis DJ, McGill N, McGrath J, Mensah GA, Meyer AC, Michaud C, Moran A, Mori R, Murdoch ME, Naldi L, Newton CR, Norman R, Omer SB, Osborne R, Pearce N, Perez-Ruiz F, Perico N, Pesudovs K, Phillips D, Pourmalek F, Prince M, Rehm JT, Remuzzi G, Richardson K, Room R, Saha S, Sampson U, Sanchez-Riera L, Segui-Gomez M, Shahraz S, Shibuya K, Singh D, Sliwa K, Smith E, Soerjomataram I, Steiner T, Stolk WA, Stovner LJ, Sudfeld C, Taylor HR, Tleyjeh IM, van der Werf MJ, Watson WL, Weatherall DJ, Weintraub R, Weisskopf MG, Whiteford H, Wilkinson JD, Woolf AD, Zheng ZJ, Murray CJ, Jonas JB. Common values in assessing health outcomes from disease and injury: disability weights measurement study for the Global Burden of Disease Study 2010. Lancet. 2012;380:2129–2143. doi: 10.1016/S0140-6736(12)61680-8. [DOI] [PMC free article] [PubMed] [Google Scholar]
- [4].Salomon JA, Wang H, Freeman MK, Vos T, Flaxman AD, Lopez AD, Murray CJL. Healthy life expectancy for 187 countries, 1990–2010: a systematic analysis for the global burden of disease study 2010. Lancet. 2012;380:2144–2162. doi: 10.1016/S0140-6736(12)61690-0. [DOI] [PubMed] [Google Scholar]
- [5].Vos T, Flaxman AD, Naghavi M, Lozano R, Michaud C, Ezzati M, Shibuya K, Salomon JA, Abdalla S, Aboyans V, Abraham J, Ackerman I, Aggarwal R, Ahn SY, Ali MK, Alvarado M, Anderson HR, Anderson LM, Andrews KG, Atkinson C, Baddour LM, Bahalim AN, Barker-Collo S, Barrero LH, Bartels DH, Basáñez MG, Baxter A, Bell ML, Benjamin EJ, Bennett D, Bernabé E, Bhalla K, Bhandari B, Bikbov B, Bin Abdulhak A, Birbeck G, Black JA, Blencowe H, Blore JD, Blyth F, Bolliger I, Bonaventure A, Boufous S, Bourne R, Boussinesq M, Braithwaite T, Brayne C, Bridgett L, Brooker S, Brooks P, Brugha TS, Bryan-Hancock C, Bucello C, Buchbinder R, Buckle G, Budke CM, Burch M, Burney P, Burstein R, Calabria B, Campbell B, Canter CE, Carabin H, Carapetis J, Carmona L, Cella C, Charlson F, Chen H, Cheng AT, Chou D, Chugh SS, Coffeng LE, Colan SD, Colquhoun S, Colson KE, Condon J, Connor MD, Cooper LT, Corriere M, Cortinovis M, de Vaccaro KC, Couser W, Cowie BC, Criqui MH, Cross M, Dabhadkar KC, Dahiya M, Dahodwala N, Damsere-Derry J, Danaei G, Davis A, De Leo D, Degenhardt L, Dellavalle R, Delossantos A, Denenberg J, Derrett S, Des Jarlais DC, Dharmaratne SD, Dherani M, Diaz-Torne C, Dolk H, Dorsey ER, Driscoll T, Duber H, Ebel B, Edmond K, Elbaz A, Ali SE, Erskine H, Erwin PJ, Espindola P, Ewoigbokhan SE, Farzadfar F, Feigin V, Felson DT, Ferrari A, Ferri CP, Fèvre EM, Finucane MM, Flaxman S, Flood L, Foreman K, Forouzanfar MH, Fowkes FG, Franklin R, Fransen M, Freeman MK, Gabbe BJ, Gabriel SE, Gakidou E, Ganatra HA, Garcia B, Gaspari F, Gillum RF, Gmel G, Gosselin R, Grainger R, Groeger J, Guillemin F, Gunnell D, Gupta R, Haagsma J, Hagan H, Halasa YA, Hall W, Haring D, Haro JM, Harrison JE, Havmoeller R, Hay RJ, Higashi H, Hill C, Hoen B, Hoffman H, Hotez PJ, Hoy D, Huang JJ, Ibeanusi SE, Jacobsen KH, James SL, Jarvis D, Jasrasaria R, Jayaraman S, Johns N, Jonas JB, Karthikeyan G, Kassebaum N, Kawakami N, Keren A, Khoo JP, King CH, Knowlton LM, Kobusingye O, Koranteng A, Krishnamurthi R, Lalloo R, Laslett LL, Lathlean T, Leasher JL, Lee YY, Leigh J, Lim SS, Limb E, Lin JK, Lipnick M, Lipshultz SE, Liu W, Loane M, Ohno SL, Lyons R, Ma J, Mabweijano J, MacIntyre MF, Malekzadeh R, Mallinger L, Manivannan S, Marcenes W, March L, Margolis DJ, Marks GB, Marks R, Matsumori A, Matzopoulos R, Mayosi BM, McAnulty JH, McDermott MM, McGill N, McGrath J, Medina-Mora ME, Meltzer M, Mensah GA, Merriman TR, Meyer AC, Miglioli V, Miller M, Miller TR, Mitchell PB, Mocumbi AO, Moffitt TE, Mokdad AA, Monasta L, Montico M, Moradi-Lakeh M, Moran A, Morawska L, Mori R, Murdoch ME, Mwaniki MK, Naidoo K, Nair MN, Naldi L, Narayan KM, Nelson PK, Nelson RG, Nevitt MC, Newton CR, Nolte S, Norman P, Norman R, O'Donnell M, O'Hanlon S, Olives C, Omer SB, Ortblad K, Osborne R, Ozgediz D, Page A, Pahari B, Pandian JD, Rivero AP, Patten SB, Pearce N, Padilla RP, Perez-Ruiz F, Perico N, Pesudovs K, Phillips D, Phillips MR, Pierce K, Pion S, Polanczyk GV, Polinder S, Pope CA, 3rd, Popova S, Porrini E, Pourmalek F, Prince M, Pullan RL, Ramaiah KD, Ranganathan D, Razavi H, Regan M, Rehm JT, Rein DB, Remuzzi G, Richardson K, Rivara FP, Roberts T, Robinson C, De Leòn FR, Ronfani L, Room R, Rosenfeld LC, Rushton L, Sacco RL, Saha S, Sampson U, Sanchez-Riera L, Sanman E, Schwebel DC, Scott JG, Segui-Gomez M, Shahraz S, Shepard DS, Shin H, Shivakoti R, Singh D, Singh GM, Singh JA, Singleton J, Sleet DA, Sliwa K, Smith E, Smith JL, Stapelberg NJ, Steer A, Steiner T, Stolk WA, Stovner LJ, Sudfeld C, Syed S, Tamburlini G, Tavakkoli M, Taylor HR, Taylor JA, Taylor WJ, Thomas B, Thomson WM, Thurston GD, Tleyjeh IM, Tonelli M, Towbin JA, Truelsen T, Tsilimbaris MK, Ubeda C, Undurraga EA, van der Werf MJ, van Os J, Vavilala MS, Venketasubramanian N, Wang M, Wang W, Watt K, Weatherall DJ, Weinstock MA, Weintraub R, Weisskopf MG, Weissman MM, White RA, Whiteford H, Wiersma ST, Wilkinson JD, Williams HC, Williams SR, Witt E, Wolfe F, Woolf AD, Wulf S, Yeh PH, Zaidi AK, Zheng ZJ, Zonies D, Lopez AD, Murray CJ, Al Mazroa MA, Memish ZA. Years lived with disability (YLDs) for 1160 sequelae of 289 diseases and injuries 1990–2010: a systematic analysis for the Global Burden of Disease Study 2010. Lancet. 2012;380:2163–2196. doi: 10.1016/S0140-6736(12)61729-2. [DOI] [PMC free article] [PubMed] [Google Scholar]
- [6].Murray CJ, Vos T, Lozano R, Naghavi M, Flaxman AD, Michaud C, Ezzati M, Shibuya K, Salomon JA, Abdalla S, Aboyans V, Abraham J, Ackerman I, Aggarwal R, Ahn SY, Ali MK, Alvarado M, Anderson HR, Anderson LM, Andrews KG, Atkinson C, Baddour LM, Bahalim AN, Barker-Collo S, Barrero LH, Bartels DH, Basáñez MG, Baxter A, Bell ML, Benjamin EJ, Bennett D, Bernabé E, Bhalla K, Bhandari B, Bikbov B, Bin Abdulhak A, Birbeck G, Black JA, Blencowe H, Blore JD, Blyth F, Bolliger I, Bonaventure A, Boufous S, Bourne R, Boussinesq M, Braithwaite T, Brayne C, Bridgett L, Brooker S, Brooks P, Brugha TS, Bryan-Hancock C, Bucello C, Buchbinder R, Buckle G, Budke CM, Burch M, Burney P, Burstein R, Calabria B, Campbell B, Canter CE, Carabin H, Carapetis J, Carmona L, Cella C, Charlson F, Chen H, Cheng AT, Chou D, Chugh SS, Coffeng LE, Colan SD, Colquhoun S, Colson KE, Condon J, Connor MD, Cooper LT, Corriere M, Cortinovis M, de Vaccaro KC, Couser W, Cowie BC, Criqui MH, Cross M, Dabhadkar KC, Dahiya M, Dahodwala N, Damsere-Derry J, Danaei G, Davis A, De Leo D, Degenhardt L, Dellavalle R, Delossantos A, Denenberg J, Derrett S, Des Jarlais DC, Dharmaratne SD, Dherani M, Diaz-Torne C, Dolk H, Dorsey ER, Driscoll T, Duber H, Ebel B, Edmond K, Elbaz A, Ali SE, Erskine H, Erwin PJ, Espindola P, Ewoigbokhan SE, Farzadfar F, Feigin V, Felson DT, Ferrari A, Ferri CP, Fèvre EM, Finucane MM, Flaxman S, Flood L, Foreman K, Forouzanfar MH, Fowkes FG, Fransen M, Freeman MK, Gabbe BJ, Gabriel SE, Gakidou E, Ganatra HA, Garcia B, Gaspari F, Gillum RF, Gmel G, Gonzalez-Medina D, Gosselin R, Grainger R, Grant B, Groeger J, Guillemin F, Gunnell D, Gupta R, Haagsma J, Hagan H, Halasa YA, Hall W, Haring D, Haro JM, Harrison JE, Havmoeller R, Hay RJ, Higashi H, Hill C, Hoen B, Hoffman H, Hotez PJ, Hoy D, Huang JJ, Ibeanusi SE, Jacobsen KH, James SL, Jarvis D, Jasrasaria R, Jayaraman S, Johns N, Jonas JB, Karthikeyan G, Kassebaum N, Kawakami N, Keren A, Khoo JP, King CH, Knowlton LM, Kobusingye O, Koranteng A, Krishnamurthi R, Laden F, Lalloo R, Laslett LL, Lathlean T, Leasher JL, Lee YY, Leigh J, Levinson D, Lim SS, Limb E, Lin JK, Lipnick M, Lipshultz SE, Liu W, Loane M, Ohno SL, Lyons R, Mabweijano J, MacIntyre MF, Malekzadeh R, Mallinger L, Manivannan S, Marcenes W, March L, Margolis DJ, Marks GB, Marks R, Matsumori A, Matzopoulos R, Mayosi BM, McAnulty JH, McDermott MM, McGill N, McGrath J, Medina-Mora ME, Meltzer M, Mensah GA, Merriman TR, Meyer AC, Miglioli V, Miller M, Miller TR, Mitchell PB, Mock C, Mocumbi AO, Moffitt TE, Mokdad AA, Monasta L, Montico M, Moradi-Lakeh M, Moran A, Morawska L, Mori R, Murdoch ME, Mwaniki MK, Naidoo K, Nair MN, Naldi L, Narayan KM, Nelson PK, Nelson RG, Nevitt MC, Newton CR, Nolte S, Norman P, Norman R, O'Donnell M, O'Hanlon S, Olives C, Omer SB, Ortblad K, Osborne R, Ozgediz D, Page A, Pahari B, Pandian JD, Rivero AP, Patten SB, Pearce N, Padilla RP, Perez-Ruiz F, Perico N, Pesudovs K, Phillips D, Phillips MR, Pierce K, Pion S, Polanczyk GV, Polinder S, Pope CA, 3rd, Popova S, Porrini E, Pourmalek F, Prince M, Pullan RL, Ramaiah KD, Ranganathan D, Razavi H, Regan M, Rehm JT, Rein DB, Remuzzi G, Richardson K, Rivara FP, Roberts T, Robinson C, De Leòn FR, Ronfani L, Room R, Rosenfeld LC, Rushton L, Sacco RL, Saha S, Sampson U, Sanchez-Riera L, Sanman E, Schwebel DC, Scott JG, Segui-Gomez M, Shahraz S, Shepard DS, Shin H, Shivakoti R, Singh D, Singh GM, Singh JA, Singleton J, Sleet DA, Sliwa K, Smith E, Smith JL, Stapelberg NJ, Steer A, Steiner T, Stolk WA, Stovner LJ, Sudfeld C, Syed S, Tamburlini G, Tavakkoli M, Taylor HR, Taylor JA, Taylor WJ, Thomas B, Thomson WM, Thurston GD, Tleyjeh IM, Tonelli M, Towbin JA, Truelsen T, Tsilimbaris MK, Ubeda C, Undurraga EA, van der Werf MJ, van Os J, Vavilala MS, Venketasubramanian N, Wang M, Wang W, Watt K, Weatherall DJ, Weinstock MA, Weintraub R, Weisskopf MG, Weissman MM, White RA, Whiteford H, Wiebe N, Wiersma ST, Wilkinson JD, Williams HC, Williams SR, Witt E, Wolfe F, Woolf AD, Wulf S, Yeh PH, Zaidi AK, Zheng ZJ, Zonies D, Lopez AD, Al Mazroa MA, Memish ZA. Disability-adjusted life-years (DALYs) for 291 diseases and injuries in 21 regions, 1990–2010: a systematic analysis for the Global Burden of Disease Study 2010. Lancet. 2012;380:2197–2223. doi: 10.1016/S0140-6736(12)61689-4. [DOI] [PubMed] [Google Scholar]
- [7].Lim SS, Vos T, Flaxman AD, Danaei G, Shibuya K, Adair-Rohani H, Amann M, Anderson HR, Andrews KG, Aryee M, Atkinson C, Bacchus LJ, Bahalim AN, Balakrishnan K, Balmes J, Barker-Collo S, Baxter A, Bell ML, Blore JD, Blyth F, Bonner C, Borges G, Bourne R, Boussinesq M, Brauer M, Brooks P, Bruce NG, Brunekreef B, Bryan-Hancock C, Bucello C, Buchbinder R, Bull F, Burnett RT, Byers TE, Calabria B, Carapetis J, Carnahan E, Chafe Z, Charlson F, Chen H, Chen JS, Cheng AT, Child JC, Cohen A, Colson KE, Cowie BC, Darby S, Darling S, Davis A, Degenhardt L, Dentener F, Des Jarlais DC, Devries K, Dherani M, Ding EL, Dorsey ER, Driscoll T, Edmond K, Ali SE, Engell RE, Erwin PJ, Fahimi S, Falder G, Farzadfar F, Ferrari A, Finucane MM, Flaxman S, Fowkes FG, Freedman G, Freeman MK, Gakidou E, Ghosh S, Giovannucci E, Gmel G, Graham K, Grainger R, Grant B, Gunnell D, Gutierrez HR, Hall W, Hoek HW, Hogan A, Hosgood HD, 3rd, Hoy D, Hu H, Hubbell BJ, Hutchings SJ, Ibeanusi SE, Jacklyn GL, Jasrasaria R, Jonas JB, Kan H, Kanis JA, Kassebaum N, Kawakami N, Khang YH, Khatibzadeh S, Khoo JP, Kok C, Laden F, Lalloo R, Lan Q, Lathlean T, Leasher JL, Leigh J, Li Y, Lin JK, Lipshultz SE, London S, Lozano R, Lu Y, Mak J, Malekzadeh R, Mallinger L, Marcenes W, March L, Marks R, Martin R, McGale P, McGrath J, Mehta S, Mensah GA, Merriman TR, Micha R, Michaud C, Mishra V, Mohd Hanafiah K, Mokdad AA, Morawska L, Mozaffarian D, Murphy T, Naghavi M, Neal B, Nelson PK, Nolla JM, Norman R, Olives C, Omer SB, Orchard J, Osborne R, Ostro B, Page A, Pandey KD, Parry CD, Passmore E, Patra J, Pearce N, Pelizzari PM, Petzold M, Phillips MR, Pope D, Pope CA, 3rd, Powles J, Rao M, Razavi H, Rehfuess EA, Rehm JT, Ritz B, Rivara FP, Roberts T, Robinson C, Rodriguez-Portales JA, Romieu I, Room R, Rosenfeld LC, Roy A, Rushton L, Salomon JA, Sampson U, Sanchez-Riera L, Sanman E, Sapkota A, Seedat S, Shi P, Shield K, Shivakoti R, Singh GM, Sleet DA, Smith E, Smith KR, Stapelberg NJ, Steenland K, Stöckl H, Stovner LJ, Straif K, Straney L, Thurston GD, Tran JH, Van Dingenen R, van Donkelaar A, Veerman JL, Vijayakumar L, Weintraub R, Weissman MM, White RA, Whiteford H, Wiersma ST, Wilkinson JD, Williams HC, Williams W, Wilson N, Woolf AD, Yip P, Zielinski JM, Lopez AD, Murray CJ, Ezzati M, Al Mazroa MA, Memish ZA. A comparative risk assessment of burden of disease and injury attributable to 67 risk factors and risk factor clusters in 21 regions, 1990–2010: a systematic analysis for the Global Burden of Disease Study 2010. Lancet. 2012;380:2224–2260. doi: 10.1016/S0140-6736(12)61766-8. [DOI] [PMC free article] [PubMed] [Google Scholar]
- [8].Boeing H, Bechthold A, Bub A, Ellinger S, Haller D, Kroke A, Leschik-Bonnet E, Müller MJ, Oberritter H, Schulze M, Stehle P, Watzl B. Critical review: vegetables and fruity in the prevention of chronic diseases. Eur J Nutr. 2012;51:637–663. doi: 10.1007/s00394-012-0380-y. [DOI] [PMC free article] [PubMed] [Google Scholar]
- [9].Murray CJL, Richards MAR, Newton JN, Fenton KA, Anderson HR, Atkinson C, Bennett D, Bernabé E, Blencowe H, Bourne R, Braithwaite T, Brayne C, Bruce NG, Brugha TS, Burney P, Dherani M, Dolk H, Edmond K, Ezzati M, Flaxman AD, Fleming TD, Freedman G, Gunnell D, Hay RJ, Hutchings SJ, Ohno SL, Lozano R, Lyons RA, Marcenes W, Naghavi M, Newton CR, Pearce N, Pope D, Rushton L, Salomon JA, Shibuya K, Vos T, Wang H, Williams HC, Woolf AD, Lopez AD, Davis AUK. Health performance: findings of the Global Burden of Disease Study. Lancet. 2010 doi: 10.1016/S0140-6736(13)60355-4. Published online March 5. http://dx.doi.org/10.1016/S0140-6736(13)60355-4. [DOI] [PubMed] [Google Scholar]
- [10].Hunt J. 2013. Living well for longer: a call to action to reduce avoidable premature mortality. www.dh.gov.uk/publicationswww.dh.gov.uk/publications. [Google Scholar]
- [11].Murray CJL, Ezzati M, Flaxman AD, Lim S, Lozano R, Michaud C, Naghavi M, Salomon JA, Shibuya K, Vos T, Wikler D, Lopez AD. GBD 2010: design, definitions and metrics. Lancet. 2012;380:2063–2066. doi: 10.1016/S0140-6736(12)61899-6. [DOI] [PubMed] [Google Scholar]