Significance
The members of the rat sarcoma (RAS) gene family Kirsten rat sarcoma viral oncogene homolog, Harvey rat sarcoma viral oncogene homolog, and neuroblastoma RAS viral oncogene homolog (NRAS) belong to the most extensively studied oncogenes and are central players in carcinogenesis. Since their discovery approximately 30 y ago, efforts to target their aberrant activation have not led to major breakthroughs. We herein report the discovery of four so far undescribed variants of NRAS that differ in their expression patterns and, strikingly, in their downstream effects. Our results suggest that NRAS should be studied in the context of its variants. In addition, this discovery may open opportunities to develop more efficient anticancer therapies.
Abstract
Neuroblastoma rat sarcoma (RAS) viral oncogene homolog (NRAS), a small GTPase, is one of the most thoroughly studied oncogenes that controls cell growth, differentiation, and survival by facilitating signal transduction. Here, we identify four novel naturally occurring NRAS isoforms (isoforms 2–5) in addition to the canonical isoform (isoform 1). Expression analyses performed on a panel of several different human malignancies and matching normal tissue revealed distinct isoform expression patterns. Two of the novel isoforms were found in the nucleus and cytoplasm, whereas the others were exclusively cytoplasmic. The isoforms varied in their binding affinities to known downstream targets and differentially regulated the RAS signaling pathway. Strikingly, forced expression of isoform 5, which encodes only a 20-aa peptide, led to increased cell proliferation and to transformation by activation of known NRAS targets. These discoveries open new avenues in the study of NRAS.
The neuroblastoma rat sarcoma (RAS) viral oncogene homolog (NRAS) gene is located in chromosome band 1p13.2 (1, 2). It encodes a membrane-bound protein with GTPase activity that functions as an important regulatory element in the signal transduction of numerous hormones, cytokines, and growth factors (3). It cycles between an active GTP-bound and an inactive GDP-bound state (4, 5). In the GTP-bound state, two regions, switch I and switch II, undergo a conformation change that enables binding of NRAS to effector molecules, including v-raf-1 murine leukemia viral oncogene homolog 1 (RAF-1) (6) and phosphatidylinositol-4,5-bisphosphate 3-kinase, catalytic subunit alpha (PI3K) (7). This leads to signaling cascades [e.g., RAF/MEK/ERK (MAP)-kinases and PI3/AKT-kinases] affecting cellular proliferation, differentiation, migration, and apoptosis (4, 8).
Aberrant activation of the RAS pathway is a crucial event in many cancers and is frequently caused by point mutations of hotspot codons located within exon 2 [codons 12 and 13 (9)] and exon 3 [codon 61 (9)]. The mutations disrupt intrinsic and RAS-GAP–mediated GTP hydrolysis, leading to constitutive activation (10, 11) and increased affinity of NRAS to the direct effectors, RAF-1 (12) and PI3K (13).
Previously, two transcript variants of NRAS have been described, which differ only in their 3′-UTRs (4.3 kb and 2 kb, here referred to as isoform 1) (14).
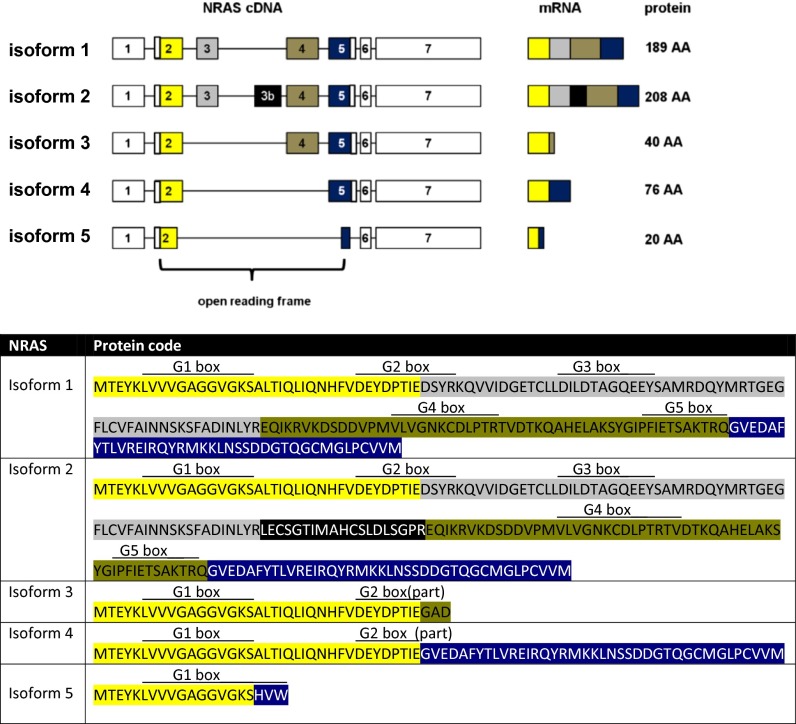
We now report four previously undescribed isoforms of the NRAS oncogene (isoforms 2–5; Fig. 1A) which arise from the introduction of a so far unknown exon (exon 3b, isoform 2; Fig. 1A), the skipping of exon 3 (isoform 3), the skipping of exons 3 and 4 (isoform 4), or the fusion of the beginning of exon 2 with the end of exon 5 (isoform 5; Fig. 1A).
Fig. 1.
(Upper) Characterization of the five naturally occurring NRAS isoforms. Isoform 1 is the hitherto known NRAS isoform. Isoform 2 contains a previously unknown exon 3b. Isoforms 3 and 4 are lacking exon 3 or exons 3 and 4, respectively. Isoform 5 is the result of the fusion of the first 17 codons of exon 2 with 3 codons toward the end of exon 5. The graph displays cDNA, splicing products (mRNA), and corresponding protein lengths of the isoforms. Exons included in the ORF are colored. (Lower) Predicted protein codes of the five NRAS isoforms, with color codes highlighting the different exons (yellow, exon 2; gray, exon 3; black, exon 3b; khaki, exon 4; blue, exon 5). Locations of the G boxes are indicated above the predicted codes [simplified presentation, locations, and functional descriptions adapted from Colicelli (26)]: G1 box, P-loop, purine nucleotide binding; G2 box, GDP/GTP binding and effector binding; G3 box, Mg2+ ion binding; G4 box, hydrogen bond contact with the guanine ring, interaction with G1 box; G5 box, guanine nucleotide association.
In this study, we provide the first evidence, to the authors' knowledge, of the significance of these so far undescribed isoforms of NRAS. First, we analyzed the strengths of the isoform expressions and their expression patterns in normal and paired tumor tissue samples of four human organs [lung tissue/non–small-cell lung cancer (NSCLC), thyroid tissue/papillary thyroid cancer (PTC), skin/malignant melanoma (MM), and colon tissue/colorectal cancer (CRC)].
Second, we studied whether the introduction of the additional exon and/or the loss of known exons may impact known interactions of NRAS with its binding partners and its ability to activate the MAPK and PI3K/AKT pathways, which may ultimately result in more or less aggressive behavior. Finally, we tested the functional consequences of forced expression of the isoforms, including their impact on anchorage-dependent and -independent cell growth, and their transforming potential.
Results
NRAS Has Five Naturally Occurring Isoforms.
While cloning the cDNA of NRAS, we identified four previously undescribed isoforms of the NRAS gene (Fig. 1A). In the following, we refer to the one hitherto known isoform of NRAS as isoform 1. It consists of exons 1–7 with the ORF spanning from exon 2 to exon 5. NRAS isoform 2 contains a so far unknown exon located downstream of exon 3 (exon 3b) with a length of 57 bp.
Isoform 3 lacks exon 3. This splicing event leads to the creation of a premature stop codon after three codons in exon 4, resulting in a predicted small protein product of only 40 aa. Isoform 4 lacks both exons 3 and 4. As the ORF remains intact, the corresponding protein product has a length of 76 aa. In isoform 5, the first 17 codons of exon 2 are fused with three codons toward the end of exon 5, thereby creating a premature stop codon. The predicted result is a small 20-aa peptide (Fig. 1A).
Of note, the latter three isoforms are all missing exon 3. This is of importance, as it contains the switch II region of NRAS. Moreover, it contains codon 61, which is one of three mutational hotspots in the NRAS gene.
NRAS Isoforms Have Different Expression Patterns.
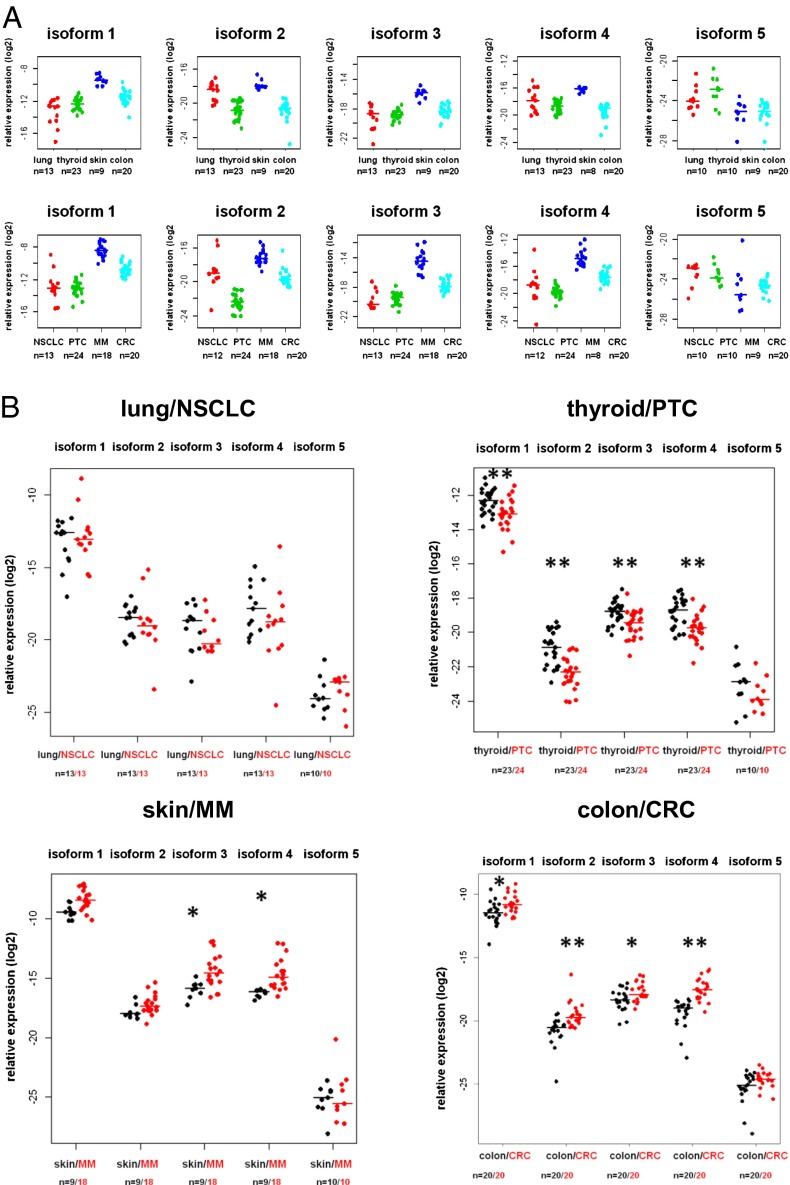
To elucidate the distribution of the isoforms in normal and tumor tissue, we determined the mRNA expression of each isoform in normal lung, thyroid, skin, and colon tissue and in tumor tissue from the same patients (NSCLC, PTC, MM, CRC). Normal and tumor tissues showed different expression profiles of the five NRAS isoforms (Fig. 2A and Fig. S1). Next, we directly compared the isoform expressions in the normal/tumor pairs of the four malignancies. The pairwise comparisons revealed relatively subtle changes in the expression levels of some of the isoforms depending on the tumor type (Fig. 2B and Fig. S2). Although MM samples exhibited up-regulation of only isoforms 3 and 4 compared with normal skin, CRC samples exhibited up-regulation of all isoforms except isoform 5 compared with colon tissue. In contrast, PTC samples had lower expressions of all isoforms except isoform 5 compared with normal thyroid tissue. Even though statistically significant, most of these differences were relatively modest. NSCLC samples did not differ in their expression compared with normal lung tissue (Fig. 2B).
Fig. 2.
(A) Expression levels of the NRAS isoforms in four human tissues and their corresponding malignancies. (Upper) Relative expression levels of the NRAS isoforms in lung tissue, thyroid tissue, skin, and colon tissue. (Lower) Relative isoform expressions in paired tumor tissue of the patients listed above are displayed: patients with NSCLC, PTC (including one nonpaired tumor sample), MM (including nine nonpaired MM samples), and CRC. (B) Expression levels of the NRAS isoforms in four human malignancies compared with normal tissues. Displayed are the relative expression levels of the NRAS isoforms in paired tumor vs. normal tissues of lung/NSCLC, PTC (including one nonpaired sample), skin/MM (including nine nonpaired samples), and CRC. PTC, MM, and CRC differ in some of their isoform expression patterns compared with their paired normal tissues (*P < 0.05 and **P < 0.001, two-sided Wilcoxon rank-sum test for paired samples).
NRAS Isoforms Differ in Their Downstream Effects.
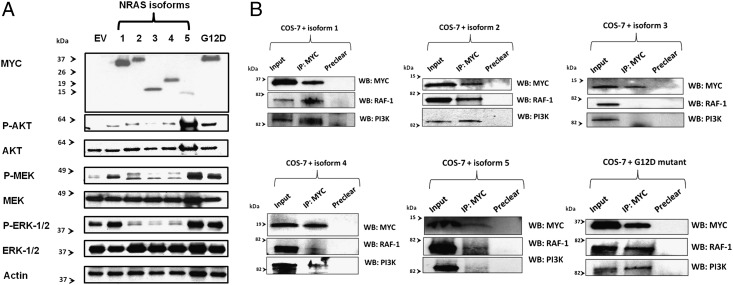
Activated NRAS leads to phosphorylation and consequent activation of its downstream targets, including AKT, MEK, and ERK. To gain initial insights into the downstream effects of the novel NRAS isoforms, we next tested how the different isoforms affect the phosphorylation levels of AKT, MEK, and ERK. To enable detection of the isoforms via Western blot after forced expression in COS-7 cells, the NRAS isoforms were cloned into an expression construct containing a 5′-Myc Tag. The NRAS G12D mutant was included as a positive control for increased target gene phosphorylation. Although isoforms 3 and 4 showed decreased phosphorylation of MEK and ERK, their effects on AKT phosphorylation were comparable to the effects of isoform 1 (Fig. 3A). In contrast, forced expression of isoform 5 led to increased phosphorylation (and consecutive activation) of all tested NRAS downstream targets (Fig. 3A). Isoform 2 showed differential activation potential. Whereas it increased AKT phosphorylation, it decreased phosphorylation of the MEK/ERK axis.
Fig. 3.
(A) Effects of the NRAS isoforms on the phosphorylation of known target genes. After forced expression of the Myc-tagged isoforms in COS-7 cells, Western blotting was performed to test the phosphorylation levels of the downstream targets AKT, MEK, and ERK. Empty vector transfection (EV) was included as a negative control. Antibodies used are listed in Methods. The NRAS G12D mutant was included as a positive control. Isoform 5 led to increased phosphorylation (marked as “P”) of AKT, MEK, and ERK, which even exceeded the phosphorylation caused by the NRAS G12D mutant. In contrast, isoforms 3 and 4 led to reduced phosphorylation of MEK and ERK. Isoform 2 showed diverse activation potentials: whereas it increased AKT phosphorylation, it decreased phosphorylation of the MEK/ERK axis. (B) Binding potential of the NRAS isoforms to known NRAS binding partners. After pull-down of the ectopically expressed Myc-tagged isoforms in COS-7 cells, Western blotting (WB) was performed to test for bound proteins. The input depicts the protein lysates before performance of immunoprecipitations (IP). Antibodies used are listed in Methods. Isoforms 1 and 2 and the NRAS G12D mutant showed similar binding affinities to RAF-1 and PI3K. Isoform 4 had only limited RAF-1 binding, but strong binding to PI3K. After pull-down of isoform 5, RAF-1 and PI3K were bound only to a limited extent. Isoform 3 showed no binding affinity to RAF-1 or PI3K.
Next, we performed immunoprecipitations followed by Western blots of the different isoforms to test for their binding affinities to known NRAS binding partners. Isoforms 1, 2, 4, and (to a lesser extent) 5 showed RAF-1 and PI3K binding. In contrast, isoform 3 did not bind to either of the tested proteins (Fig. 3B).
NRAS Isoform 5 Is an Aggressive Variant.
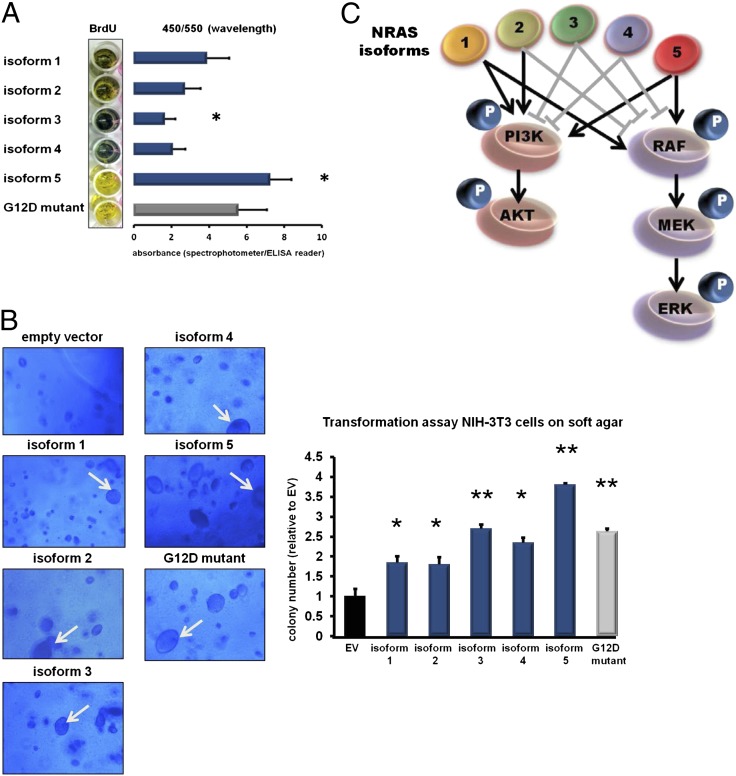
To test whether the differential downstream activation by each isoform may translate into a more (or less) aggressive phenotype, we next stably introduced the isoforms and the NRAS G12D mutant into human skin fibroblasts and compared their effects on cell proliferation. Photometric determination of BrdU uptake revealed that the cells ectopically expressing isoform 5 had the highest BrdU uptake (reflecting increased proliferation), which even exceeded that of the NRAS G12D-expressing cells compared with the canonical isoform 1 (Fig. 4A). In contrast, fibroblasts infected with isoform 3 exhibited a decreased BrdU uptake (Fig. 4A).
Fig. 4.
(A) Effect of the NRAS isoforms on cell proliferation. Skin fibroblasts were stably transfected with the different NRAS isoforms (blue bars) and the NRAS G12D mutant (gray bar) by using lentiviral technologies. At 72 h after infection, a photometric BrdU assay was performed to assess the proliferation rates of the fibroblasts after forced isoform expression. Color changes from blue to yellow indicate increased BrdU uptake corresponding to increased cell proliferation. Absorbances were determined by using a spectrophotometer and are indicated by bar graphs depicted next to the macroscopic plate appearance. Whereas isoform 3 decreased proliferation, isoform 5 increased proliferation compared with isoform 1. (All values are presented as mean ± SD of assays performed in triplicate; *P < 0.05 vs. isoform 1, two-tailed Student t test). (B) Transformation assay of NIH 3T3 cells on soft agar. Representative pictures of the microscopic appearance of NIH 3T3 cells on soft agar 8 d after stable infection with the NRAS isoforms (blue bars) and the NRAS G12D mutant (gray bar) are shown. Empty vector (EV; black bar) was included as a negative control. All NRAS isoforms led to the development of the typical giant cell phenotype of NIH 3T3 cells (indicated by white arrows), but with different frequencies. The bar graph displays the colony numbers analyzed by fluorimetric assays. (All values are presented as mean ± SD of assays performed in triplicate; *P < 0.05 and **P < 0.001 vs. empty vector, two-tailed Student t test). (C) Graphical summary of the different downstream effects of the NRAS isoforms. Gray block bars indicate reduction of downstream phosphorylation (marked as “P”), and black arrows indicate increased downstream phosphorylation.
Next, we performed transformation assays with NIH 3T3 cells (murine fibroblasts; Fig. 4B) ectopically expressing the NRAS isoforms and the NRAS G12D mutant. In the performed assay, cell growth and colony formation indicate anchorage-independent cell growth. Again, forced expression of isoform 5 had the highest anchorage-independent cell growth compared with the four other isoforms and the NRAS G12D mutant (Fig. 4B). Notably, we also observed that forced expression of each isoform was capable of transforming the murine fibroblasts to giant cells characteristic of activated RAS signaling, but to different extents. Although almost 50% of the NIH 3T3 cells forcedly expressing isoform 5 had a giant cell phenotype, isoforms 2 and 3 transformed only a small fraction of the cells (Fig. 4B). Taken together, the functional assays and downstream activation observed in the Western blots identify isoform 5 as a highly aggressive variant. A summary of the different downstream activation potentials of the NRAS isoforms is shown in Fig. 4C.
NRAS Isoforms 3 and 5 Are Found in the Nucleus.
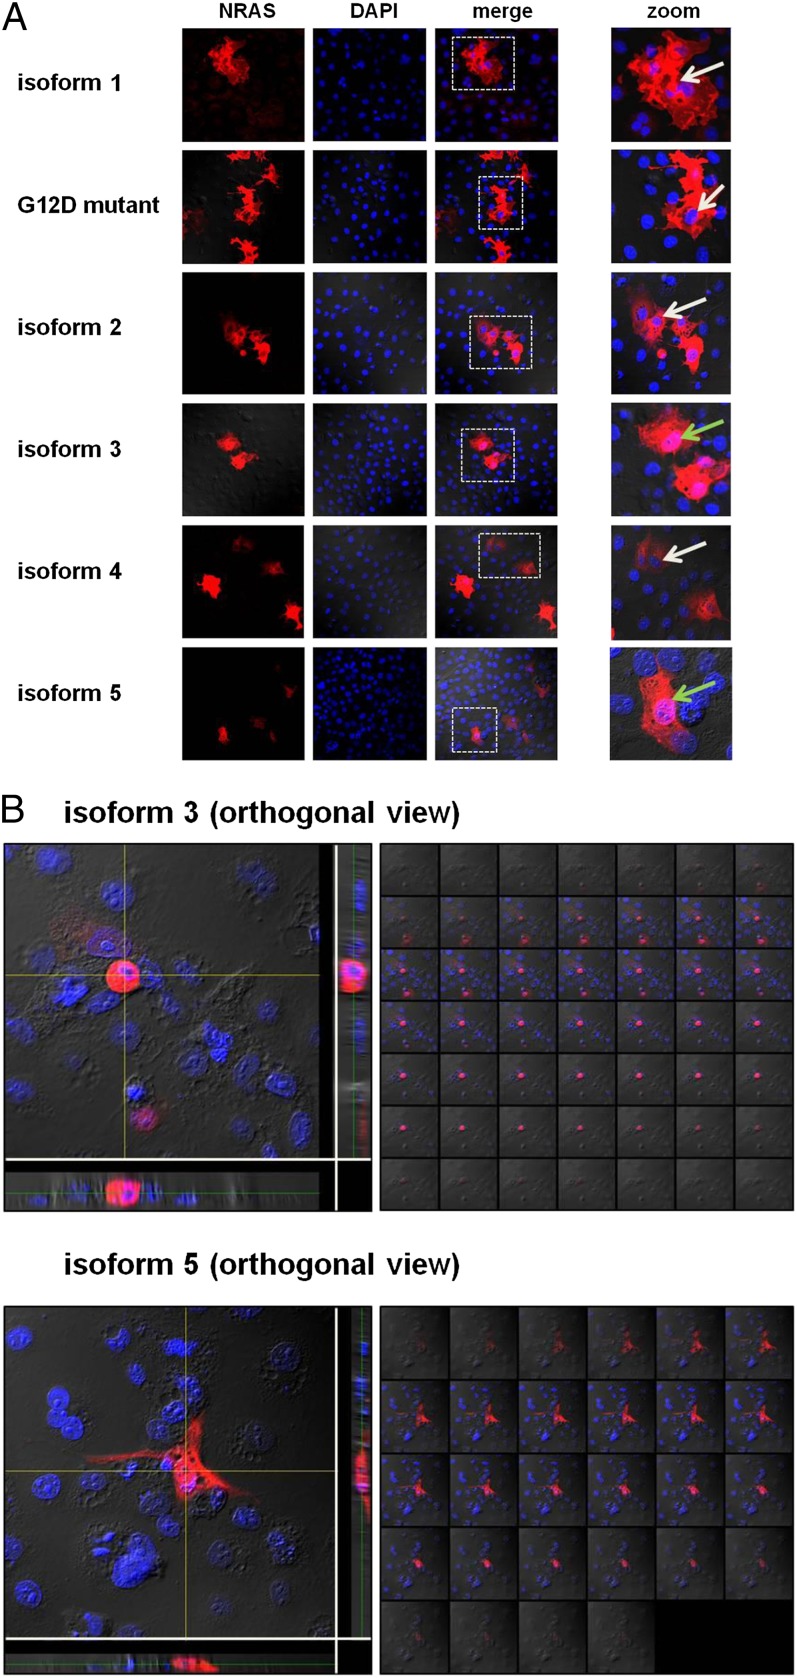
As isoforms 3 and 5 are very small, we hypothesized that they may translocate into the nucleus despite not having nuclear localization signals (15). Indeed, confocal microscopy of COS-7 cells expressing each of the isoforms revealed that isoforms 1, 2, and 4 were localized entirely in the cytoplasm, but, strikingly, isoforms 3 and 5 were also detected in the nucleus (Fig. 5).
Fig. 5.
(A) Cellular localization of the NRAS isoforms. Displayed are single-channel and merged confocal micrographs of COS-7 cells ectopically expressing the NRAS isoforms and NRAS G12D mutant. Whereas isoforms 1, 2, and 4, and the NRAS G12D mutant were located only in the cytoplasm, isoforms 3 and 5 displayed nuclear localization as well. Pink nuclei show nuclear isoform localization (green arrows). Blue nuclei show no nuclear isoform localization (white arrows). The white dashed boxes in the merged pictures indicate the magnified areas. (B) Nuclear localization of NRAS isoforms 3 and 5. Three-dimensional images of cells transfected with NRAS isoforms 3 and 5 (Z-stacks). Z-stacks were collected (0.2 μm per slice) and images were chosen from the middle of the nuclei. Side views of the cells (across bottom and side of figures) are also shown. Both isoforms show nuclear localization (pink).
Discussion
In 1982, Marshall et al. identified a novel transforming gene in two human cancer cell lines (16). A year later it was classified as a member of the RAS gene family by Hall et al. (1) after a joint seminar with the group of Aaronson and after discussions with Weinberg. As the gene was discovered in a neuroblastoma cell line, it was named NRAS, or neuroblastoma RAS viral oncogene homolog. It soon became clear that NRAS and the other previously discovered RAS genes, Kirsten rat sarcoma viral oncogene homolog (KRAS) and Harvey rat sarcoma viral oncogene homolog, are potent oncogenes in numerous human cancers (17–20). Even though perturbation of RAS signaling is one of the most common events in carcinogenesis (8), many questions remain open.
We here discovered four so far unknown isoforms of the NRAS gene that show striking differences in their protein sizes, expression profiles, and downstream effects. The isoforms result from various alternative splicing events, which lead to the introduction of an additional exon (isoform 2), the skipping of exons 3 and 4 (isoforms 3 and 4), and a partial loss of exons 2 and 5 (isoform 5). These events stand in contrast to the known alternative splicing of KRAS, in which the two isoforms KRASA and KRASB are the result of alternative splicing events of exon 5, whereas exons 2, 3, and 4 remain invariant (21).
In particular, NRAS isoform 5 seems to represent an aggressive NRAS variant. Because it has limited binding affinities to RAF-1 and PI3K, but still leads to activation of downstream RAS targets (AKT, MEK, ERK), and because it is additionally found in the nucleus, at least part of the observed phenotypic effects may be caused by interactions with other proteins.
It is noteworthy that the different isoforms varied in the strengths of their expressions as determined by quantitative PCR (qPCR). For example, isoform 5 had almost 1,000-fold lower expression compared with the canonical isoform 1. Even though the expression of isoform 5 may be artificially lowered by the complicated assay design, it seems clear that isoform 1 accounts for the majority of the NRAS expression. Therefore, the observed downstream effects of isoform 5 should be considered in the context of their relatively low expression, as even subtle changes in the expression may lead to significant functional consequences.
The discovery of the novel isoforms may not only have important biological consequences, but also therapeutic implications. In fact, the different structures of the NRAS isoforms must be considered in the context of NRAS inhibitors. So far, direct and indirect targeting of the aberrantly activated RAS pathway has shown varying success in the clinic, which most likely is because of the complexity of RAS gene functions (22–24). However, as only amino acids 1–17 are shared among all five isoforms, pharmacologic approaches to specifically influence the expression of different isoforms (e.g., isoform 5 inhibition) might represent an option to enhance the effective targeting of this “undruggable” molecule (25).
Of note, three of the four novel NRAS isoforms are missing exon 3, which contains the mutational hotspot codon 61. This presently complicates our ability to interpret the effects of the mutation, as the remaining NRAS isoforms 3, 4, and 5 that do not contain codon 61 may counteract and/or strengthen the activating effects. Further characterization of the isoforms should be conducted in the context of codon 61 mutations.
The identification of four novel NRAS isoforms carries important implications for RAS biology, and also opens many new questions. It is only the first step in a long line of research that is likely to follow.
Methods
Tissue Origin.
NSCLC (n = 13) and unaffected lung samples (n = 13) were obtained from the tissue procurement at The Ohio State University (OSU). PTC (n = 24) and paired unaffected thyroid samples (n = 23) and CRC (n = 20) and paired unaffected colon samples (n = 20) were obtained from the Human Cancer Genetics Tissue Bank at OSU. All patients provided written informed consent according to the Declaration of Helsinki to store and use their tissue for discovery studies according to OSU institutional guidelines under protocols approved by the OSU Institutional Review Board. Total RNA samples from patients with MM (n = 18) and paired skin tissues (n = 9) were purchased from Asterand. COS-7 cells and NIH 3T3 cells were purchased from the American Type Culture Collection.
Cloning of the NRAS Isoforms.
The NRAS isoforms were cloned via cDNA-based PCR with primers covering the translation start codon and the stop codon of NRAS isoform 1. Primer sequences used for cloning were as followed: NRAS forward, GTGCGGATCCGTGTGAAATGACTGAGTAC; NRAS reverse, GTGCGAATCCGTATCTTGTTACATCACCAC. The corresponding PCR product was cloned into a Topo-TA vector (Invitrogen), single colonies were picked, and DNA was extracted and subjected to Sanger-based sequencing analysis.
Forced Overexpression of the NRAS Isoforms.
The isoforms were cloned into a 5′-Myc–tagged expression vector (pcDNA3-5′-Myc; Clontech) to enable detection via Western blot. COS-7 cells were transfected with the expression construct using Lipofectamine LTX reagent following the manufacturer’s instructions (Invitrogen). For stable expression of the isoforms, the constructs were shuttled into a lentiviral expression vector (SBI).
Quantification of the NRAS Isoforms.
Isoform-specific SYBR Green qPCR primers were designed for each isoform. Specificity was confirmed by using RNA from cells after forced isoform expression. A melting curve analysis was added to each qPCR run. 18S mRNA expression was used as a housekeeper for normalization. Primer sequences used for the qPCR were as followed: NRAS isoform 1 forward, TAACCTCTACAGGGAGCAGAT; NRAS isoform 1 reverse, GTGGGCTTGTTTTGTATCAAC; NRAS isoform 2 forward, CTACAGGCTGGAGTGCAG; NRAS isoform 2 reverse, GTCTTTTACTCGCTTAATCTG; NRAS isoform 2 forward, CCACCATAGAGGGAGCAGA; NRAS isoform 3 reverse, GCTTGTTTTGTATCAACTGTCC; NRAS isoform 4 forward, CACCATAGAGGGTGTTGAAG; NRAS isoform 4 reverse, CACACATGGCAATCCCATAC; NRAS isoform 5 forward, CGTGTGAAATGACTGAGTAC; and NRAS isoform 5 reverse, ATCACCACACATGGCTTTTC.
Western Blotting.
Western blotting was performed by using standard protocols. Antibodies used include: c-Myc (9E10, sc-40 HRP; Santa Cruz), P-AKT (S473, 4060S; Cell Signaling), AKT (no. 9272; Cell Signaling), Actin (sc-1616; Santa Cruz), P-ERK (9101S; Cell Signaling), P-MEK (9154P; Cell Signaling), ERK (4695P; Cell Signaling), MEK1/2 (8727S; Cell Signaling), anti-rabbit IgG (7074S; Cell Signaling), anti-mouse IgG (NA931V; Pierce), and anti-goat IgG (sc-2056; Santa Cruz).
Functional Assays.
Cell proliferation was assessed by using the BrdU Cell Proliferation Assay Kit (no. 68135; Cell Signaling). Transformation assays were performed using the CytoSelect 96-well Cell Transformation Assay Kit (Soft Agar Colony Formation; Cell Biolabs). All assays were performed in triplicate following the manufacturer’s instructions.
Immunoprecipitation.
COS-7 cells in P100 plates were transfected with 10 μg of the NRAS isoform or NRAS G12D mutant expression constructs (sc-40; Santa Cruz). At 24 h later, cells were lysed with 0.1% Nonidet P-40 buffer containing 20 mM Hepes, 150 mM NaCl, protease, and phosphatase inhibitors. Preclear was performed by using 500 µg of lysate for 3 h with protein G-plus agarose beads (Calbiochem) coated with normal mouse IgG (sc-2025; Santa Cruz); immunoprecipitations were then performed overnight with protein G-plus beads coated with c-myc antibody (sc-40; Santa Cruz). Immunoprecipitates were subjected to SDS/PAGE and Western blotting with the following antibodies: c-myc (sc-40; Santa Cruz), RAF-1 (sc-227; Santa Cruz) and PI3K (no. 4292; Cell Signaling).
Confocal Microscopy.
Confocal staining was performed by standard procedures using the following antibodies: anti–c-myc (sc-40; Santa Cruz) and Alexa Fluor 647 goat anti-mouse (BD Biosciences). Confocal micrographs were taken using the FV1000 Confocal Laser Scanning Microscope (Olympus) with a UPLFLN 40× oil, N.A. 1.3 lens.
Statistical Methods.
Comparison of tumor/normal paired data were performed by using pairwise Wilcoxon rank-sum tests. To compare the isoform expressions among tissue types within tumor and normal samples, the Kruskal–Wallis test was used. All tests used were two-sided and nonparametric. A P value of <0.05 was considered statistically significant.
Supplementary Material
Acknowledgments
We thank Michael C. Ostrowski and Paul Herman for their critical reading of the manuscript; Pia Hoellerbauer for her help with the wet laboratory experiments; and Heather Hampel, Xin Wu, and Wei Li for handling patient samples. This work was supported in part by the National Cancer Institute Grants P30 CA16058 and P01 CA124570, the Coleman Leukemia Research Foundation (A.K.E., A.d.l.C., and S.S.), and the Pelotonia Fellowship Program (A.K.E. and R.P.).
Footnotes
The authors declare no conflict of interest.
This article contains supporting information online at www.pnas.org/lookup/suppl/doi:10.1073/pnas.1401727111/-/DCSupplemental.
References
- 1.Hall A, Marshall CJ, Spurr NK, Weiss RA. Identification of transforming gene in two human sarcoma cell lines as a new member of the ras gene family located on chromosome 1. Nature. 1983;303(5916):396–400. doi: 10.1038/303396a0. [DOI] [PubMed] [Google Scholar]
- 2.Davis M, Malcolm S, Hall A, Marshall CJ. Localisation of the human N-ras oncogene to chromosome 1cen - p21 by in situ hybridisation. EMBO J. 1983;2(12):2281–2283. doi: 10.1002/j.1460-2075.1983.tb01735.x. [DOI] [PMC free article] [PubMed] [Google Scholar]
- 3.Sweet RW, et al. The product of ras is a GTPase and the T24 oncogenic mutant is deficient in this activity. Nature. 1984;311(5983):273–275. doi: 10.1038/311273a0. [DOI] [PubMed] [Google Scholar]
- 4.Rajalingam K, Schreck R, Rapp UR, Albert S. Ras oncogenes and their downstream targets. Biochim Biophys Acta. 2007;1773(8):1177–1195. doi: 10.1016/j.bbamcr.2007.01.012. [DOI] [PubMed] [Google Scholar]
- 5.Vetter IR, Wittinghofer A. The guanine nucleotide-binding switch in three dimensions. Science. 2001;294(5545):1299–1304. doi: 10.1126/science.1062023. [DOI] [PubMed] [Google Scholar]
- 6.Vojtek AB, Hollenberg SM, Cooper JA. Mammalian Ras interacts directly with the serine/threonine kinase Raf. Cell. 1993;74(1):205–214. doi: 10.1016/0092-8674(93)90307-c. [DOI] [PubMed] [Google Scholar]
- 7.Castellano E, Downward J. RAS interaction with PI3K: More than just another effector pathway. Genes Cancer. 2011;2(3):261–274. doi: 10.1177/1947601911408079. [DOI] [PMC free article] [PubMed] [Google Scholar]
- 8.Malumbres M, Barbacid M. RAS oncogenes: The first 30 years. Nat Rev Cancer. 2003;3(6):459–465. doi: 10.1038/nrc1097. [DOI] [PubMed] [Google Scholar]
- 9.Bezieau S, et al. High incidence of N and K-Ras activating mutations in multiple myeloma and primary plasma cell leukemia at diagnosis. Hum Mutat. 2001;18(3):212–224. doi: 10.1002/humu.1177. [DOI] [PubMed] [Google Scholar]
- 10.Herrmann C. Ras-effector interactions: After one decade. Curr Opin Struct Biol. 2003;13(1):122–129. doi: 10.1016/s0959-440x(02)00007-6. [DOI] [PubMed] [Google Scholar]
- 11.McGrath JP, Capon DJ, Goeddel DV, Levinson AD. Comparative biochemical properties of normal and activated human ras p21 protein. Nature. 1984;310(5979):644–649. doi: 10.1038/310644a0. [DOI] [PubMed] [Google Scholar]
- 12.Moodie SA, Willumsen BM, Weber MJ, Wolfman A. Complexes of Ras.GTP with Raf-1 and mitogen-activated protein kinase kinase. Science. 1993;260(5114):1658–1661. doi: 10.1126/science.8503013. [DOI] [PubMed] [Google Scholar]
- 13.Sjölander A, Yamamoto K, Huber BE, Lapetina EG. Association of p21ras with phosphatidylinositol 3-kinase. Proc Natl Acad Sci USA. 1991;88(18):7908–7912. doi: 10.1073/pnas.88.18.7908. [DOI] [PMC free article] [PubMed] [Google Scholar]
- 14.Hall A, Brown R. Human N-ras: cDNA cloning and gene structure. Nucleic Acids Res. 1985;13(14):5255–5268. doi: 10.1093/nar/13.14.5255. [DOI] [PMC free article] [PubMed] [Google Scholar]
- 15.Mohr D, Frey S, Fischer T, Güttler T, Görlich D. Characterisation of the passive permeability barrier of nuclear pore complexes. EMBO J. 2009;28(17):2541–2553. doi: 10.1038/emboj.2009.200. [DOI] [PMC free article] [PubMed] [Google Scholar]
- 16.Marshall CJ, Hall A, Weiss RA. A transforming gene present in human sarcoma cell lines. Nature. 1982;299(5879):171–173. doi: 10.1038/299171a0. [DOI] [PubMed] [Google Scholar]
- 17.Harvey JJ. An unidentified virus which causes the rapid production of tumors in mice. Nature. 1964;204:1104–1105. doi: 10.1038/2041104b0. [DOI] [PubMed] [Google Scholar]
- 18.Kirsten WH, Mayer LA. Morphologic responses to a murine erythroblastosis virus. J Natl Cancer Inst. 1967;39(2):311–335. [PubMed] [Google Scholar]
- 19.Der CJ, Krontiris TG, Cooper GM. Transforming genes of human bladder and lung carcinoma cell lines are homologous to the ras genes of Harvey and Kirsten sarcoma viruses. Proc Natl Acad Sci USA. 1982;79(11):3637–3640. doi: 10.1073/pnas.79.11.3637. [DOI] [PMC free article] [PubMed] [Google Scholar]
- 20.Chang EH, Gonda MA, Ellis RW, Scolnick EM, Lowy DR. Human genome contains four genes homologous to transforming genes of Harvey and Kirsten murine sarcoma viruses. Proc Natl Acad Sci USA. 1982;79(16):4848–4852. doi: 10.1073/pnas.79.16.4848. [DOI] [PMC free article] [PubMed] [Google Scholar]
- 21.Carta C, et al. Germline missense mutations affecting KRAS Isoform B are associated with a severe Noonan syndrome phenotype. Am J Hum Genet. 2006;79(1):129–135. doi: 10.1086/504394. [DOI] [PMC free article] [PubMed] [Google Scholar]
- 22.Ward AF, Braun BS, Shannon KM. Targeting oncogenic Ras signaling in hematologic malignancies. Blood. 2012;120(17):3397–3406. doi: 10.1182/blood-2012-05-378596. [DOI] [PMC free article] [PubMed] [Google Scholar]
- 23.Adjei AA. Blocking oncogenic Ras signaling for cancer therapy. J Natl Cancer Inst. 2001;93(14):1062–1074. doi: 10.1093/jnci/93.14.1062. [DOI] [PubMed] [Google Scholar]
- 24.Cox AD, Der CJ. Ras family signaling: Therapeutic targeting. Cancer Biol Ther. 2002;1(6):599–606. doi: 10.4161/cbt.306. [DOI] [PubMed] [Google Scholar]
- 25.Thompson H. US National Cancer Institute’s new Ras project targets an old foe. Nat Med. 2013;19(8):949–950. doi: 10.1038/nm0813-949. [DOI] [PubMed] [Google Scholar]
- 26.Colicelli J. Human RAS superfamily proteins and related GTPases. Sci STKE. 2004;2004(250):RE13. doi: 10.1126/stke.2502004re13. [DOI] [PMC free article] [PubMed] [Google Scholar]
Associated Data
This section collects any data citations, data availability statements, or supplementary materials included in this article.


