

Significance
Ras oncogens have been implicated in high proportion of cancers. However, selective treatment for Ras oncogenes is not yet available and components that could mediate Ras functions are being extensively assessed as alternative targets. For some potential targets, such as phospholipase Cε (PLCε), it is not clear how they contribute to tumor development. Here we provide several lines of experimental evidence that support a tumor suppressor function of PLCε, contrasting a positive role of several other well-defined effectors of Ras. Our results show a tumor suppressor role for this PLC in animal models and describe its impact on cell proliferation. Together with observations of marked down-regulation in several types of tumors, this study suggests its use as a biological marker in cancer.
Abstract
Phospholipase Cε (PLCε) has been characterized as a direct effector of Ras in vitro and in cellular systems; however, the role of PLCε in tumorigenesis and its link to Ras in this context remain unclear. To assess the role of PLCε in Ras-driven cancers, we generated two new mouse strains: one carrying a targeted deletion of Plce (Plce−/−) and the other carrying mutant alleles of Plce unable to bind to Ras (PlceRAm/RAm). The Plce−/− and, to a lesser degree, PlceRAm/RAm transgenic mice exhibited increased susceptibility to tumor formation in the two-stage skin carcinogenesis protocol, revealing a tumor suppressor function for this PLC. This result also suggests that in this context Ras binding in part regulates functions of PLCε. Although significant differences were not seen in the LSL-KrasG12D nonsmall cell lung carcinoma model, down-regulation of PLCε was found in animal tumors and in cellular systems following expression of the oncogenic Ras. An inhibitory impact of PLCε on cell growth requires intact lipase activity and is likely mediated by protein kinase C enzymes. Further cellular studies suggest involvement of histone deacetylase in the mechanism of PLCε down-regulation. Taken together, our results show a previously unidentified tumor suppressor role for this PLC in animal models and, together with observations of marked down-regulation in colorectal, lung, and skin tumors, suggest its use as a biological marker in cancer.
Activating mutations in the Ras subfamily of small GTPases contribute to the formation of a large proportion of human tumors (1). However, selective treatment for Ras oncogenes is not yet available in the clinic and components that could mediate generation and progression of tumors by Ras are being extensively assessed as alternative targets. These components include direct signaling effectors (such as Raf-kinase, PI3-K, and RalGDS) (2–4) and recently identified Ras-binding protein (PDEδ) (5), as well as components less directly linked to Ras or necessary for Ras oncogene-dependent cancer cell survival (for example, Ral, Cdk4, GATA, TBK1) (6–9). Approaches for evaluating their role in vivo are based on mouse models for Ras-triggered cancers. In addition to a two-stage chemical carcinogenesis model where a carcinogen [DMBA, 7.12-dimethylbenz(a)anthracene] generates activating mutations in Hras, other models, including lung and pancreatic cancer, have been developed based on inducible expression of the Kras oncogene (10, 11). By applying these strategies and models to strains with ablated expression of a specific component or using specific inhibitors, it was possible to assess the requirement or contribution of each component in Ras-triggered malignancies. Some of the well-known direct effectors of Ras have been found necessary for tumor formation; in their absence, tumor generation and progression is attenuated or absent. Examples include the requirement for c-Raf in Kras oncogene-driven nonsmall cell lung carcinoma (NSCLC) (4), PI3K p110α in NSCLC, and in two-stage skin cancerogenesis (3) and RalGDS in the same Hras oncogene-driven skin cancer model (2). In some instances, for example for PI3K, it was also possible to assess the requirement for a Ras-binding domain (RA) by generating alleles encoding p110α variants deficient in Ras-binding (3). However, not all proteins implicated in direct binding to Ras appear to have a positive role in Ras oncogene-driven tumors or tumors caused by other factors. For example, depletion of some members of the Ras Association Doman Family (rassf), such as Rassf1A, enhanced tumor formation in mice (12).
Phospholipase Cε (PLCε) is a multifunctional signaling protein, incorporating both PLC and guanine nucleotide exchange factor activities (13, 14). Importantly, and in common to several direct effectors of Ras, PLCε has an RA domain that binds several Ras GTPases, including oncogenic Kras and Hras (15). The main insights into in vivo functions of PLCε have been obtained using two different transgenic mouse strains, one with an in-frame deletion within the PLC catalytic domain (Plce1ΔX/ΔX) and the other lacking PLCε expression (Plce1−/−) (16). Although in both cases mice were viable, some notable differences in their phenotype, in particular related to heart morphology, have been observed. In assessing functions related to cancer, however, only the Plce1ΔX/ΔX transgene—where the link between PLCε and a phenotype could be more difficult to interpret—has been used so far (16, 17). Some of these studies have suggested that the function of PLCε could be required for immune responses associated with the skin chemical cancerogenesis and colorectal models (18, 19). However, in the case of another skin cancer, caused by UVB light—which also triggers inflammation (20)—such an overall positive role of PLCε was not seen. Furthermore, several studies based on analysis of human colorectal tumors (21–23) show markedly reduced levels of PLCε and indicate cancer-suppressing functions of PLCε rather than a positive role in generation and progression of tumors. Because of these apparent discrepancies, it is necessary to further scrutinize the role of PLCε in a more comprehensive study, including use of different Plce1 transgenes.
We describe herein generation of two unique Plce1 transgenic strains and their analysis in Ras-triggered cancers that, together with cellular studies and information for expression in human tumors, provide evidence for a tumor suppressor role of PLCε.
Results
Generation and Characterization of Transgenic Mice.
To study the role of PLCε and its signaling links to Ras GTPases in vivo, we generated two new transgenic strains. Plce-null mice (Plce−/−) were generated by disruption of exon 2 of Plce and the introduction of a frame-shift termination codon in exon 3, therefore preventing the expression of any functional domains of PLCε (Fig. 1 A and B). The variant deficient in Ras-binding (PlceRAm/RAm) was generated by introduction of three point mutations (R2130L, K2151E, and Y2154L) into exon 29 and 30 of the Plce allele (Fig. 1B, Right); these point mutations were previously shown to completely disrupt Ras binding to the RA2 domain of PLCε (15). Plce−/− and PlceRAm/RAm mice were bred to homozygosity, exhibiting the expected Mendelian ratio (Fig. 1C). Homozygotes were fertile and showed normal life span and development.
Fig. 1.

Generation of transgenic mice. (A) Schematic diagram of PLCε showing domain organization. The underlined region at the N terminus indicated by an asterisk represents a largely unstructured and evolutionary highly variable (in length and sequence) portion of PLCε that has not been removed using the strategy described in B (Left). (B) Strategies for generation of Plce1 null (Left) and PlceRAm (Right) alleles. (C) Number and percentage (%) of offsprings generated from Plce+/− (Upper) and Plce+/RAm (Lower) intercrosses, genotyped 3 wk after birth. (D) Total RNA was extracted from Plce+/+ and Plce−/− brain, heart, lung, and skin and RT-PCR was performed using primers for exons 2–3 (Left). Genomic DNA, extracted from brain, heart, lung, and skin of Plce+/+ and PlceRAm/RAm mice, was amplified (sequences flanking exons 29 and 30) by PCR and the product digested with HpaI or HaeIII (Right).
Initial confirmation for homolog recombination in ES cells was obtained by Southern blot analysis (Fig. S1A). The excision of exon 2 in the Plce-/− mice was confirmed by RT-PCR of various organs using primers for exon 2–3 (Fig. 1D, Left). Point mutations generated in exon 29 and 30 of PlceRAm/RAm were verified in different organs based on the presence of specific restriction sites (Fig. 1D, Right). In addition, the absence of PLCε expression was confirmed by Western blotting of protein extracts from selected organs and mouse embryonic fibroblasts (MEF) (Fig. S1 B and C). To access whether other PLCs would compensate for the absence of the Plce gene, protein extracts from Plce+/+ and Plce−/− MEFs were used for Western blotting and showed no significant difference of expression of other PLCs (Fig. S1B).
Two-Stage Chemical Skin Carcinogenesis.
Before applying the two-stage chemical charcinogenesis protocol we analyzed the skin from Plce+/+, Plce−/−, and PlceRAm/RAm mice and verified the absence of PLCε expression in the null mice and similar levels of expression in Plce+/+and PlceRAm/RAm mice (Fig. 2A). We also confirmed PLCε expression in the epidermis and hair follicles of the dermis but not in the dermis itself (Figs. S2A and S3B), as suggested previously (24).
Fig. 2.
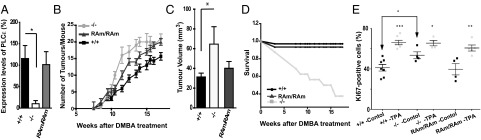
Two-stage skin chemical carcinogenesis model applied to different Plce genotypes. (A) Evaluation of PLCε expression in the skin of Plce+/+, Plce−/−, and PlceRAm/RAm mice. qRT-PCR was performed using a probe made to hybridize with exon 2–3 of Plce1. Values were normalized to the expression level of the endogenous control, GAPDH. One-way ANOVA, *P < 0.05. (B) Cohorts of mice were treated with one application of DMBA and subsequent, twice a week applications of TPA for 18 wk. Time course of the average number of tumors per mouse in FVB background (mean ± SEM) for Plce+/+ (n = 33), Plce−/− (n = 15), and PlceRAm/Ram (n = 16) genotypes is shown per week after DMBA treatment. Two-way ANOVA, P < 0.0001. (C) Rate of tumor growth. The three greatest tumors of each animal were measured at 13 wk after DMBA treatment and averaged per genotype; t test, *P < 0.01. (D) Percentage of the survival rate per week after DMBA treatment for Plce+/+, Plce−/−, and PlceRAm/RAm mice. (E) Evaluation of epidermal hyperplasia in Plce+/+, Plce−/−, and PlceRAm/RAm mice. Dorsal skin of Plce+/+ (n = 7), Plce−/− (n = 4), and PlceRAm/Ram (n = 5) mice was treated with either acetone (control, black) or TPA in acetone (TPA, gray); 48 h after treatment the skin was excised, fixed, and paraffin-embedded. Proliferation was assessed by immunohistochemistry for Ki67, Ki67+ cells were counted in three fields of view per skin sample. The data are shown as mean ± SEM. Statistical analysis was performed using the Student t test: *P < 0.05, **P < 0.01, ***P < 0.0001.
For the two-stage chemical skin carcinogenesis model, driven through Hras signaling, Plce+/+, Plce−/−, and PlceRAm/RAm mice were backcrossed to FVB strain of mice for six generations and cohorts of mice were treated with one single application of DMBA—to initiate oncogenic mutation on the Hras gene—and weekly applications of TPA (12-O-tetradecanoyl-phorbor-13-acetate) —to promote clonal expansion of the initiated cells—for 18 wk. Three tumors of each genotype were tested for the activating mutations at the 61st codon of Hras (25) and all tumors were found to carry the activating mutations, irrespective of the Plce genetic background (Fig. S3A).
As shown in Fig. 2B, our results clearly show that the loss of PLCε leads to a significant increase in tumor burden compared with the wild-type control mice. Similarly, PlceRAm/RAm mice also exhibited increase in tumor burden compared with the wild-type, suggesting that absence of signaling mediated by the RA2 domain of PLCε increases susceptibility to tumor development; however, mice with a total absence of PLCε exhibited an aggravated phenotype (Fig. 2B). We also excluded the possibility that the enhancement in tumor development was because of a reduction in apoptosis (Fig. S3C).
When tumor volume was assessed at 13 wk of treatment, Plce−/− mice had significantly bigger tumors than those seen in the wild-type, whereas no significant difference was seen between Plce+/+ and PlceRAm/RAm (Fig. 2C). This finding suggests that the RA2 domain could contribute to suppression of tumor formation without significantly affecting tumor growth. In contrast, complete ablation of PLCε has an effect on both processes, affecting the number and size of tumors.
Unexpectedly, the survival rate of the Plce−/− mice was drastically affected during the treatment (Fig. 2D). Our initial experiments performed on a different, C57BL/6J-FVB (F1) mixed background (Fig. S3 D and E), however, suggest that the FVB genetic background is affecting the survival of Plce−/− mice shown in Fig. 2D, rather than the Plce−/− genotype per se. In C5Bl/6J-FVB background we have shown a similar increase in tumor burden in the Plce−/− mice (Fig. S3D) but the survival of Plce−/− mice was not affected by the DMBA/TPA treatment (Fig. S3E). It is, however, currently not possible to make clear inferences from these observations. C57BL/6 mice, which are relatively resistant to TPA skin tumor formation, have a number of not yet defined genetic loci that influence tumor susceptibility in the two-stage skin carcinogenesis model (26–28). Although to our knowledge, FVB vs. C57BL/6 outcrossing to identify susceptibility genes has not been done, our data suggest that in the F1 (FVBxC57BL/6) generation a C57BL/6 derived “tumor survival” allele is present, which could be associated with PLCε tumor suppressor or other roles relevant for tumor formation.
We also examined epidermal hyperplasia in TPA-treated skin to determine the potential effect of PLCε in the second proliferative step of the two chemical carcinogenesis protocol. Initial measurements of the skin thickness on day 2 showed that a single topical application of TPA at 10 μg induced thickening of the epidermis in all genotypes (from 19.3 ± 1.8 μm to 39.3 ± 3.5 μm in Plce+/+, from 19.3 ± 1.2 μm to 44.1 ± 2.9 μm in PlceRAm/RAm, and from 24.1 ± 4.1 μm to 45.4 ± 5.7 μm in Plce−/− mice). The measurements also suggested some thickening of the epidermis in Plce−/− mice compared with the wild-type under control conditions. This finding was further supported by data for the rate of cell proliferation in the vehicle or TPA-treated skin using immunohistochemistry for Ki67 (Fig. 2E and Fig. S4). TPA treatment of Plce+/+ and PlceRAm/RAm induced an increase in the number of proliferative cells in the epidermis compared with the vehicle-treated control skin. TPA treatment also induced an increase in epidermal proliferation in the Plce−/− skin; however, this increase was smaller than that seen in the Plce+/+ and PlceRAm/RAm mice (Fig. 2E) and this appears to be because of the fact that there is a higher level of basal proliferation in the Plce−/− skin compared with the wild-type skin (Fig. 2E) (P < 0.05). These findings, revealing prolonged higher basal proliferation rate of Plce−/− skin, are consistent with the results showing greater tumors in the Plce−/− mice compared with the other genotypes (Fig. 2C).
Analysis of Skin Tumors: PLCε Down-Regulation.
To investigate the level of expression of PLCε in the tumors, we analyzed four tumors of four different mice of each genotype and compared these to untreated animals. The results showed a significant decrease in PLCε expression in the Plce+/+ and PlceRAm/RAm tumor samples compared with normal skin, close to the level seen in the Plce−/− skin (Fig. 3A). This result seems to be in keeping with a putative tumor suppressor function of this PLC. To further investigate if Hras could directly down-regulate PLCε in tumors, primary MEFs from Plce+/+ and PlceRAm/RAm embryos were first immortalized with retrovirus expressing a dominant negative form of the tumor suppressor protein p53 and subsequently transformed with the activated Hras mutant retrovirus (p53DD+HrasV12), or only transformed with HrasV12 retrovirus (HrasV12) (Fig. 3B). The data show that HrasV12 completely abrogates expression of the wild-type and RAm PLCε in cell culture. Furthermore, these data also suggest an epigenetic silencing of the Plce gene mediated by Hras that is independent of the Ras-binding domain. To examine the epigenetic regulation of this repression, the above immortalized and transformed MEFs were treated with the DNA methylation inhibitor 5-Aza-2′-Deoxycytidine (AZA) or with the histone deacetylase inhibitor Trichostatin A (TSA). Interestingly, TSA seems to increase or completely restore the expression of PLCε in HrasV12 and p53DD+HrasV12 transformed cells, respectively (Fig. 3C). Cellular differences between primary or immortalized cells may be the reason why MEFs expressing HrasV12 respond differently to TSA treatment in terms of PLCε expression. Unexpectedly, treatments with AZA seem to have a negative effect on PLCε expression despite restoring expression of Fas (Fig. S5), one of the best characterized targets of hypermethylation in Ras transformed cells (29). Thus, it appears that in MEFs histone deacetylases most likely mediate the down-regulation of PLCε. Similar results to those observed for Plce+/+ MEFs (Fig. 3C) were seen for the PlceRAm/RAm allele when using TSA and AZA (Fig. S5A). Varying growth conditions and prolonged stimulations of MEFs did not affect expression levels of PLCε (Fig. S5 B and C).
Fig. 3.

Skin cancer model and PLCε down-regulation. (A) Evaluation of PLCε expression by qRT-PCR in normal skin (N) and tumor samples after 13 wk of treatment (T) for indicated genotypes, normalized to expression of β-actin (n = 4 per genotype). Statistical analysis was by one-way ANOVA; ***P < 0.001 for Plce+/+ and **P < 0.01 for PlceRAm/RAm. Similar analysis did not reveal significant differences in expression levels of PLCδ1 (values within 100 ± 32) and PLCγ1 (values within 100 ± 26). (B) Evaluation of PLCε expression by qRT-PCR in Plce+/+ and PlceRAm/RAm MEFs, normalized to the levels of expression of GAPDH. Primary MEFs were transfected with a retrovirus expressing the activated mutant HrasV12 (Hras) or a dominant-negative form of the tumor suppressor protein p53 followed by a transfection with HrasV12 (p53DD+Hras), or the same backbone empty vector (empty vector). Results are representative for three different cell lines. (C) Evaluation of PLCε expression by qRT-PCR in nontransfected wild-type, primary MEFs (primary), and these MEFs transfected with HrasV12 or p53DD+HrasV12, as described in B. In treated cells, the evaluation was performed 3 d after 15 μM of DNA methylation inhibitor (AZA) treatment and 18 h after 400 nM of histone deacetylase inhibitor (TSA) treatment. Results are representative for three different cell lines. (D) Evaluation of PLCε expression by qRT-PCR in untreated ventral skin (untreated skin), dorsal skin treated with DMBA/TPA for 13 wk (treated skin), and two isolated tumors from the same mouse (tumor); analysis was performed on three mice (n = 3). Statistical analysis was by one-way ANOVA, ***P < 0.001. As a further control, expression levels of PLCε were compared between untreated ventral (values 100 ± 19) and untreated dorsal skin (values 115 ± 16), showing no difference.
To further analyze expression levels of PLCε during DMBA/TPA treatment, we crossed our C57BL/6J mice with a background known to be more resistant to the DMBA/TPA treatment, the DBA mice, enabling us to slow down the tumourigenesis process and study treated skin that did not develop tumors. Wild-type F1 mice (C57BL/6J-DBA) were treated as previously and nontreated skin, treated skin, and tumors were analyzed at week 13 of the DMBA/TPA treatment. The three mice analyzed showed an 80% down-regulation of PLCε in treated skin (in the absence of lesions) compared with untreated (ventral) skin (Fig. 3D). This result suggests that the down-regulation of PLCε also occur before tumor formation and is probably mediated by the TPA-promotion step. Overall, these results propose that activated mutations in the Hras gene can directly down-regulate PLCε in cells; however, continuous skin treatment with TPA also down-regulates PLCε before tumor formation.
Our further experiments also suggested that exogenous expression of the wild-type PLCε in Plce−/− MEFs resulted in a reduction in cell proliferation; this effect seems to be dependent on intact lipase activity (Fig. S6A). Consistent with this finding, reexpression of PLCε corresponded to an increase in PKC activity (as assessed by phosphorylation of PKC and its substrate MARCKS) (Fig. S6 B and C). As shown in Fig. S6D, we observed similar changes in precancer skin from Plce−/− mice that is characterized by higher rate of proliferation (Fig. 2E). This finding suggests that the predominant mechanism that impacts on cell proliferation is mediated by PKC; isozymes previously linked to growth inhibition such as PKCδ or PKCη (30), are likely to be involved.
Kras-Driven Lung Tumor Development.
To further investigate the tumor suppressor function of PLCε, we used the conditional LSL-KrasG12D NSCLC model. PLCε expression is highest in the lung (Fig. 4A) and in situ hybridization of the wild-type lung shows ubiquitous expression of PLCε in this tissue (Fig. S2B). In this model, lung tumor initiation is synchronously induced by a single infection with an AdCre virus, which leads to the removal of the transcriptional stop element and activation of the oncogenic KrasG12D allele. C57BL/6J Plce+/+, Plce−/−, and PlceRAm/RAm mice were crossed with the LSL-KrasG12D mouse and 6-wk-old mice were infected with AdCre by intranasal instillation. Animals were killed 23/24 wk after AdCre infection and histological analysis of the lungs revealed similar tumor burden and tumor grade distribution among all genotypes (Fig. 4 B–E). We quantified tumor burden by analyzing the number of lesions per lung and measuring the tumor-to-lung area ratio, which revealed no significant difference between the genotypes (Fig. 4 B and C). Malignancy was assessed by counting the number of solid nodules and fraction of animals having solid tumors per genotype, which also did not show any significant difference between the genotypes (Fig. 4 D and E).
Fig. 4.

NSCLC: LSL-KrasG12D model and PLCε down-regulation. (A) Evaluation of PLCε expression by qRT-PCR in organs from wild-type mice (n = 3) normalized to the levels of GAPDH; relative values compared with expression in the skin (skin = 1). (B) Plce+/+ (n = 12), Plce−/− (n = 12), and PlceRAm/RAm (n = 11) mice carrying one LSL-KrasG12D allele were treated once with AdenoCre viruses by intranasal instillation. Twenty-three to 24 wk later, mice were killed and the lungs processed for histological analysis. Quantification of the number of lesion per lungs is shown. (C) Quantification of the area of lesion per area of total lung in the indicated genotypes treated as described in B. (D) Quantification of the number of solid tumors of the mice of the indicated genotypes treated as described in B. (E) Assessment of the percentage of animals having solid tumors per indicated genotype treated as described in B. (F) Evaluation of PLCε expression by qRT-PCR in whole lungs from the wild-type nontreated (control) and from treated animals after 26 wk (treated); t test, **P < 0.001 (n = 5). (G) Evaluation of PLCε expression by qRT-PCR in two independent populations of LSL-KrasG12D MEFs infected with Adenovirus expressing either control GFP (AdGFP) or Cre-GFP (AdCreGFP) after 2, 4, and 6 d. Asterisks represent significant differences, t test *P < 0.05. (H) Cancer profiling array comparing lung samples isolated from normal and tumor tissues from the same patient (n = 21). Hybridization with PLCε probe was normalized to hybridization to the ubiquitin probe. (I) Western blot showing the levels of PLCε expression in epithelial lung cancer cell lines A549, A427, H358, H460, and H727 (Left). RT-PCR for expression of PLCε in H358 and H460 cells treated with 15 μM AZA for three days and 400 nM TSA for 18 h (Right).
PLCε expression (assessed by quantitative PCR) was analyzed in the whole, wild-type untreated lungs and lungs from mice 26 wk after AdCre infection showing 38% reduction (Fig. 4F). In vitro analysis of LSL-KrasG12D MEFs showed a rapid down-regulation of PLCε after AdCre infection; 50% of PLCε reduction occurred 6 d after AdCre infection (Fig. 4G). These results indicate that in the NSCLC model, where initiation of KrasG12D expression is synchronized and a rapid down-regulation of PLCε is seen in KrasG12D-expressing MEFs, the Plce−/− genotype does not have an effect on tumor burden in the lung. Effectively, KrasG12D is likely to convert wild-type cells into cells completely lacking PLCε as in Plce−/− genotype.
PLCε Down-Regulation in Human Lung Tumors and Cell Lines.
To investigate whether PLCε would also be down-regulated in human lung tumors, we have probed a commercial cancer-profiling array containing cDNA from 21 pairs of normal/tumor patient samples. Quantitative analysis revealed that in about 73% of tumors there was a decrease in PLCε mRNA compared with the normal tissues (Fig. 4H). The reduction of expression was within a range of 2- to 9.3-fold. Human epithelial carcinoma cell lines were also analyzed for expression of PLCε. Among several nonsmall lung cancer cell lines, H358 and H460 cells showed comparatively low or no PLCε expression as assessed by Western blotting or RT-PCR (Fig. 4I). Notably, TSA treatment of these cell lines resulted in an increase in the level of PLCε (Fig. 4I, Left).
Discussion
Here we provide several lines of experimental evidence that support a tumor suppressor function of PLCε, contrasting a positive role of several other well-defined effectors of Ras in Ras-triggered generation and progression of tumors. We have found an increase in susceptibility to skin tumor formation in Plce−/− mice in response to DMBA/TPA (Fig. 2) and down-regulation of PLCε in skin and lung tumors as well as in cellular models following expression of oncogenic Ras (Figs. 3 and 4). In addition to Ras-driven animal tumors, the reduction in PLCε expression levels was also observed in human lung adenocarcinomas (Fig. 4). The down-regulation of PLCε is likely to account for apparent inconsistencies between the skin (increase in tumors) and lung model (no change in tumor burden) (Figs. 2 and 4) that can be because of an extensive, synchronized, and more rapid down-regulation in the latter.
Although the effect of PLCε-deficiency on tumor formation in mice differs from ablation of several other Ras effectors [Raf, PI3K, or RalGDS (2–4)], it shows similarities with protein kinase Cη (PKCη) knockout strain when analyzed by two-stage chemical carcinogesis (30). This novel PKC isoform, regulated by PLC-generated diacylglycerol, is highly expressed in the skin. As in the case of PLCε-deficiency (Fig. 2), the lack of this enzyme in Prkch−/− mice resulted in an increased susceptibility to skin tumor formation compared with the wild-type. Interestingly, in both cases a suppressive effect on TPA induced epidermal hyperplasia could be one of the factors involved in the control of tumor formation; PKCη-deficient mice have prolonged epidermal hyperplasia (30) and our data suggest that the high proliferative rate of basal cells in the epidermis of the Plce−/− mice may be closely associated with increased tumor growth (Fig. 2). We also note that our data from the application of the two-stage chemical carcinogenesis model differ from previous observations obtained using another Plce1ΔX/ΔX transgene (24); this difference is likely caused by different approaches in interfering with functions of this complex protein.
Analysis of PlceRAm/RAm mice, the strain where binding of a subset of Ras family GTPases to the PLCε RA2 domain is abolished, demonstrated that regulatory interactions mediated by the RA2 domain contribute to tumor suppressive roles of PLCε. An increase in number of skin tumors was observed in Plce−/− and PlceRAm/RAm mice; an increase in tumor volume and epidermal proliferative rate, however, was only seen in Plce−/− mice (Fig. 2). Notably, down-regulation of PLCε was independent of the functional RA2 domain and both the wild-type PLCε and PLCε with RAm mutations were similarly down-regulated (Fig. 3). This finding supports the possibility that tumor suppressive functions of PLCε involve RA2-mediated regulatory interactions—notably with the oncogenic Ras—at least at early stages (that influence tumor generation). However, at later stages in tumorigenesis down-regulation of PLCε becomes prominent.
It has been well established that Ras-driven cancers exhibit a complex picture of up-regulated and down-regulated gene expression compared with normal cells. The best-characterized mechanisms for down-regulation involve epigenetic silencing by promoter hypermethylation (29). Interestingly, this may not be the prevalent mechanism for down-regulation of PLCε as we show that PLCε reexpression in our cellular systems can be achieved by the histone deacetylase inhibitor (TSA) rather than the DNA methylation inhibitor (AZA) (Figs. 3 and 4).
To our knowledge, the expression levels of PLCε have not been previously analyzed in skin or lung human tumors and we provide unique evidence for down-regulation of PLCε in these tumor types. Nevertheless, data from several previous reports demonstrate a great reduction of PLCε expression in another type of human tumor, colorectal cancer (CRC), and suggest some further similarities with observations presented here. Results from Sorli et al. demonstrated significantly reduced mRNA expression levels in colon and rectum cancer samples and several colon cancer cell lines expressing Ras oncogene (21). Wang et al. reported a frequency of 36% loss of heterozygosity of 10q23 (where PLCE1 is located) and down-regulation of PLCε in 21 of 50 colorectal cancer samples compared with matched normal tissue (22, 31). Recently, Danielsen et al. performed a comprehensive statistical analysis of data for CRC and normal mucosa (from different microarray platforms) and subsequent validation of the main findings (23). The authors have demonstrated that PLCε is one of the most significantly down-regulated components, with the expression levels decreasing with more advanced stages, indicating that the repression of PLCE1 gene facilitates cancer progression. Notably, this study also reported strong association between low expression of PLCε and KRAS mutations (P = 0.006) but not with mutations in BRAF, PIK3CA, or PTEN. Furthermore, previous studies of colorectal cell lines and ectopic overexpression of PLCε (in cells with low endogenous levels of this PLC) have reported inhibition of tumor cell proliferation, increased apoptosis, reduced number of colonies formed in cell culture, and reduced tumor formation in a xenograft model in vivo (21, 22), all consistent with a tumor suppressive role for PLCE1 gene.
Taken together with previously published observations, our comprehensive study, including animal models, suggests that PLCε has tumor suppressive functions in the formation of several cancer types (including CRC, lung, and skin), and that its marked down-regulation could be a useful biological marker in their assessment and treatment.
Materials and Methods
Generation of Plce−/− and PlceRAm/RAm Mice.
Generation of PLCε transgenic mice was based on a standard homologous recombination strategy using stem cell manipulation. For details, see SI Material and Methods.
Cancer Models and Analysis of Tumors.
Skin tumor formation was based on DMBA/TPA two-stage carcinogenesis protocol and lung tumors were generated by lung infection with adenovirus (AdCre) on LSL-KrasG12Dbackground. Tumors were analyzed by quantitative RT-PCR (qRT-PCR), histopathology, and immunohistochemistry, in situ hybridization, and cancer profiling array. See SI Material and Methods for details.
Cell Culture.
Generation and culture of MEFs and other cell lines and their further analysis was carried out as described in SI Material and Methods.
Supplementary Material
Acknowledgments
We thank Georgia Zoumpoulidou and Sibylle Mittnacht for regents, Bradley Spencer-Dene for help with in situ hybridization, and Chris Marshall for helpful discussions. Work in the M.K. laboratory has been funded by Cancer Research UK and the Wellcome Trust.
Footnotes
The authors declare no conflict of interest.
This article is a PNAS Direct Submission. S.G.R. is a guest editor invited by the Editorial Board.
This article contains supporting information online at www.pnas.org/lookup/suppl/doi:10.1073/pnas.1311500111/-/DCSupplemental.
References
- 1.Pylayeva-Gupta Y, Grabocka E, Bar-Sagi D. RAS oncogenes: Weaving a tumorigenic web. Nat Rev Cancer. 2011;11(11):761–774. doi: 10.1038/nrc3106. [DOI] [PMC free article] [PubMed] [Google Scholar]
- 2.González-García A, et al. RalGDS is required for tumor formation in a model of skin carcinogenesis. Cancer Cell. 2005;7(3):219–226. doi: 10.1016/j.ccr.2005.01.029. [DOI] [PubMed] [Google Scholar]
- 3.Gupta S, et al. Binding of ras to phosphoinositide 3-kinase p110alpha is required for Ras-driven tumorigenesis in mice. Cell. 2007;129(5):957–968. doi: 10.1016/j.cell.2007.03.051. [DOI] [PubMed] [Google Scholar]
- 4.Blasco RB, et al. c-Raf, but not B-Raf, is essential for development of K-Ras oncogene-driven non-small cell lung carcinoma. Cancer Cell. 2011;19(5):652–663. doi: 10.1016/j.ccr.2011.04.002. [DOI] [PMC free article] [PubMed] [Google Scholar]
- 5.Zimmermann G, et al. Small molecule inhibition of the KRAS-PDEδ interaction impairs oncogenic KRAS signalling. Nature. 2013;497(7451):638–642. doi: 10.1038/nature12205. [DOI] [PubMed] [Google Scholar]
- 6.Kumar MS, et al. The GATA2 transcriptional network is requisite for RAS oncogene-driven non-small cell lung cancer. Cell. 2012;149(3):642–655. doi: 10.1016/j.cell.2012.02.059. [DOI] [PubMed] [Google Scholar]
- 7.Peschard P, et al. Genetic deletion of RALA and RALB small GTPases reveals redundant functions in development and tumorigenesis. Curr Biol. 2012;22(21):2063–2068. doi: 10.1016/j.cub.2012.09.013. [DOI] [PubMed] [Google Scholar]
- 8.Puyol M, et al. A synthetic lethal interaction between K-Ras oncogenes and Cdk4 unveils a therapeutic strategy for non-small cell lung carcinoma. Cancer Cell. 2010;18(1):63–73. doi: 10.1016/j.ccr.2010.05.025. [DOI] [PubMed] [Google Scholar]
- 9.Barbie DA, et al. Systematic RNA interference reveals that oncogenic KRAS-driven cancers require TBK1. Nature. 2009;462(7269):108–112. doi: 10.1038/nature08460. [DOI] [PMC free article] [PubMed] [Google Scholar]
- 10.O’Hagan RC, Heyer J. KRAS mouse models: Modeling cancer harboring KRAS mutations. Genes Cancer. 2011;2(3):335–343. doi: 10.1177/1947601911408080. [DOI] [PMC free article] [PubMed] [Google Scholar]
- 11.Pérez-Mancera PA, Guerra C, Barbacid M, Tuveson DA. What we have learned about pancreatic cancer from mouse models. Gastroenterology. 2012;142(5):1079–1092. doi: 10.1053/j.gastro.2012.03.002. [DOI] [PubMed] [Google Scholar]
- 12.Tommasi S, et al. Tumor susceptibility of Rassf1a knockout mice. Cancer Res. 2005;65(1):92–98. [PubMed] [Google Scholar]
- 13.Bunney TD, Katan M. Phospholipase C epsilon: Linking second messengers and small GTPases. Trends Cell Biol. 2006;16(12):640–648. doi: 10.1016/j.tcb.2006.10.007. [DOI] [PubMed] [Google Scholar]
- 14.Bunney TD, Katan M. PLC regulation: Emerging pictures for molecular mechanisms. Trends Biochem Sci. 2011;36(2):88–96. doi: 10.1016/j.tibs.2010.08.003. [DOI] [PubMed] [Google Scholar]
- 15.Bunney TD, et al. Structural and mechanistic insights into ras association domains of phospholipase C epsilon. Mol Cell. 2006;21(4):495–507. doi: 10.1016/j.molcel.2006.01.008. [DOI] [PubMed] [Google Scholar]
- 16.Smrcka AV, Brown JH, Holz GG. Role of phospholipase Cε in physiological phosphoinositide signaling networks. Cell Signal. 2012;24(6):1333–1343. doi: 10.1016/j.cellsig.2012.01.009. [DOI] [PMC free article] [PubMed] [Google Scholar]
- 17.Bunney TD, Katan M. Phosphoinositide signalling in cancer: Beyond PI3K and PTEN. Nat Rev Cancer. 2010;10(5):342–352. doi: 10.1038/nrc2842. [DOI] [PubMed] [Google Scholar]
- 18.Ikuta S, Edamatsu H, Li M, Hu L, Kataoka T. Crucial role of phospholipase C epsilon in skin inflammation induced by tumor-promoting phorbol ester. Cancer Res. 2008;68(1):64–72. doi: 10.1158/0008-5472.CAN-07-3245. [DOI] [PubMed] [Google Scholar]
- 19.Li M, Edamatsu H, Kitazawa R, Kitazawa S, Kataoka T. Phospholipase Cepsilon promotes intestinal tumorigenesis of Apc(Min/+) mice through augmentation of inflammation and angiogenesis. Carcinogenesis. 2009;30(8):1424–1432. doi: 10.1093/carcin/bgp125. [DOI] [PubMed] [Google Scholar]
- 20.Oka M, et al. Enhancement of ultraviolet B-induced skin tumor development in phospholipase Cε-knockout mice is associated with decreased cell death. Carcinogenesis. 2010;31(10):1897–1902. doi: 10.1093/carcin/bgq164. [DOI] [PubMed] [Google Scholar]
- 21.Sorli SC, Bunney TD, Sugden PH, Paterson HF, Katan M. Signaling properties and expression in normal and tumor tissues of two phospholipase C epsilon splice variants. Oncogene. 2005;24(1):90–100. doi: 10.1038/sj.onc.1208168. [DOI] [PubMed] [Google Scholar]
- 22.Wang X, et al. Phospholipase C epsilon plays a suppressive role in incidence of colorectal cancer. Med Oncol. 2012;29(2):1051–1058. doi: 10.1007/s12032-011-9981-1. [DOI] [PubMed] [Google Scholar]
- 23.Danielsen SA, et al. Phospholipase C isozymes are deregulated in colorectal cancer—Insights gained from gene set enrichment analysis of the transcriptome. PLoS ONE. 2011;6(9):e24419. doi: 10.1371/journal.pone.0024419. [DOI] [PMC free article] [PubMed] [Google Scholar]
- 24.Bai Y, et al. Crucial role of phospholipase Cepsilon in chemical carcinogen-induced skin tumor development. Cancer Res. 2004;64(24):8808–8810. doi: 10.1158/0008-5472.CAN-04-3143. [DOI] [PubMed] [Google Scholar]
- 25.Finch JS, Albino HE, Bowden GT. Quantitation of early clonal expansion of two mutant 61st codon c-Ha-ras alleles in DMBA/TPA treated mouse skin by nested PCR/RFLP. Carcinogenesis. 1996;17(12):2551–2557. doi: 10.1093/carcin/17.12.2551. [DOI] [PubMed] [Google Scholar]
- 26.Hennings H, et al. FVB/N mice: An inbred strain sensitive to the chemical induction of squamous cell carcinomas in the skin. Carcinogenesis. 1993;14(11):2353–2358. doi: 10.1093/carcin/14.11.2353. [DOI] [PubMed] [Google Scholar]
- 27.Fujiwara K, Wie B, Elliott R, Nagase H. New outbred colony derived from Mus musculus castaneus to identify skin tumor susceptibility loci. Mol Carcinog. 2010;49(7):653–661. doi: 10.1002/mc.20635. [DOI] [PMC free article] [PubMed] [Google Scholar]
- 28.Angel JM, Caballero M, DiGiovanni J. Identification of novel genetic loci contributing to 12-O-tetradecanoylphorbol-13-acetate skin tumor promotion susceptibility in DBA/2 and C57BL/6 mice. Cancer Res. 2003;63(11):2747–2751. [PubMed] [Google Scholar]
- 29.Gazin C, Wajapeyee N, Gobeil S, Virbasius CM, Green MR. An elaborate pathway required for Ras-mediated epigenetic silencing. Nature. 2007;449(7165):1073–1077. doi: 10.1038/nature06251. [DOI] [PMC free article] [PubMed] [Google Scholar]
- 30.Chida K, et al. Disruption of protein kinase Ceta results in impairment of wound healing and enhancement of tumor formation in mouse skin carcinogenesis. Cancer Res. 2003;63(10):2404–2408. [PubMed] [Google Scholar]
- 31.Wang X, et al. Screening of new tumor suppressor genes in sporadic colorectal cancer patients. Hepatogastroenterology. 2008;55(88):2039–2044. [PubMed] [Google Scholar]
Associated Data
This section collects any data citations, data availability statements, or supplementary materials included in this article.