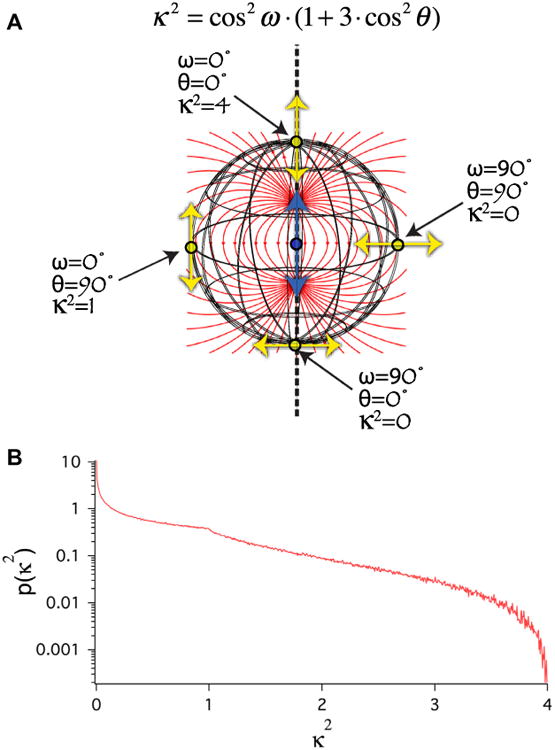
Fig. 1.

Isotropic κ2 distribution. (A) Cartoon illustrating how the dipole orientation factor κ2 is determined by 2 angles, θ and ω (see Eq. (5)). Blue arrow depicts the position and orientation of the donor emission dipole. Yellow arrows depict the position and orientation of four possible acceptor absorption dipoles, each the same distance from the donor. Red lines depict the local orientation of the electric field created by the excited state of the donor emission dipole. (B) Monte Carlo simulation of the κ2 probability distribution assuming that θ and ω are randomly distributed (isotropic). Note that the mode of this distribution is 0 and the average is 2/3.
