

Abstract
Purpose
To compare a double-excitation combined arterial-spin labeling/blood-oxygenation level dependent (ASL/BOLD) functional imaging method to a double-echo method. ASL provides a useful complement to standard BOLD functional imaging, to map effects of cerebral hemodynamics. Whole-brain imaging is necessary to properly characterize large functional networks. A challenge of whole-brain ASL/BOLD is that images for ASL functional contrast must be acquired before significant longitudinal relaxation of the inverted spins occurs; however a longer TE is required for optimal BOLD functional contrast, lengthening the acquisition time. Thus, existing combined ASL/BOLD studies have only partial-brain coverage.
Materials and Methods
The proposed method allows acquisition of images for ASL contrast within a short period after the ASL labeling pulse and post-inversion delay, then subsequent acquisition of images with longer TE for BOLD contrast. The technique is demonstrated using a narrative comprehension task in 35 normal children, and the double-excitation method is empirically compared to the double-echo method in 7 normal adults.
Results
Compared to a double-echo sequence, simulations show the double-excitation method improves ASL contrast-to-noise ratio (CNR) (~50 %) in later-acquired slices with minimal (< 1 %) reduction in BOLD CNR in earlier-acquired slices if reduced excitation flip angles for the ASL acquisitions are used. Empirical results from adult data are in agreement with the simulations. Group analyses from the narrative comprehension task also show greater inter-subject sensitivity in BOLD versus ASL.
Conclusion
Our method simultaneously optimizes ASL and BOLD acquisitions for CNR while economizing acquisition time.
Keywords: Arterial Spin Labeling, BOLD functional imaging, pediatric neuroimaging
Introduction
Observed changes in BOLD activity associated with age during development are the result of developmental changes in hemodynamics as well as neuronal activity (1). This confound is of particular concern for functional MRI studies of brain development, where neurocognitive changes may occur simultaneously with neurophysiological changes in cerebral perfusion. Indeed, this issue could influence future research involving the “child connectome” – the developing structural and functional connectivity underlying the development of higher-order cognitive function (2). Developmental changes in hemodynamics must be dissociated from neurocognitive development to properly interpret data from intrinsic-connectivity (resting-state) as well as task-based BOLD fMRI studies investigating functional connectivity.
A possible solution could be a “calibrated fMRI” technique, involving either a hypercapnic or hyperoxic challenge (3), which allows a direct estimate of cerebral metabolic rate of oxygen (CMRO2) by accounting for signal effects due to changes in blood flow. However such measurements may not be practical or feasible, especially in pediatric populations. Alternatively, one could rely exclusively on functional contrast or connectivity found from arterial spin labeling (ASL) techniques, which focus on cerebral perfusion, since perfusion has been shown to be linearly related to CMRO2 (4). However, the coupling constant between blood flow and CMRO2 likely varies significantly over the developmental period, making developmental inferences difficult. Moreover, functional ASL provides significantly less intra-subject CNR than standard BOLD (5, 6) unless the stimulation paradigm is very long. Moreover, the shortest TR possible with ASL is more than twice as long as in standard BOLD, because of the additional time allocated to labeling and the need to obtain both labeled and control images.
Alternatively, one could acquire ASL perfusion contrast and BOLD contrast simultaneously. These acquisitions can be designed as single-excitation single-echo, single-excitation double-echo, or double-excitation, depending on the number of excitation pulses per slice and the number of echoes per slice following the ASL labeling pulse. In the single-excitation single-echo approach, the same acquisition is used both for BOLD and ASL contrast. This results in a tradeoff between BOLD and ASL contrast depending on the TE. Short TE, optimal for ASL acquisitions, is sub-optimal for BOLD contrast but using a longer TE to increase BOLD weighting, reduces the ASL contrast-to-noise (CNR) due to increased attenuation of the baseline signal. Double-echo techniques (7–9) are therefore an attractive alternative. This approach allows a short-TE acquisition for ASL contrast (first echo) followed by a second echo with a TE optimized for BOLD contrast. With this method, however, each slice takes twice as long to acquire. Because of the additional time spent per slice, the method suffers from reduced ASL CNR for later-acquired slices as compared to the single-echo approach, since the labeled spins will have had more time for longitudinal relaxation. As a result, the number of slices one can acquire per time point before the label clears out from the brain is reduced by half (the single-echo single-excitation approach with a longer TE also suffers from this limitation, although to a lesser extent).
A different approach is a double-excitation strategy (Figure 1) which allows for simultaneous optimization of both ASL and BOLD CNR. The first excitation is used to collect the ASL slices at a short TE, and the second excitation occurs immediately afterwards in order to collect the BOLD slices at a longer TE. In this configuration the ASL slices can be acquired as fast as possible after the labeling pulse and inflow delay to maximize contrast from the label. This approach has been utilized in a few previous studies (e.g. (10–12)) although none of them permitted whole-brain coverage. Kastrup et al. (10) acquired a single slice using a flow-sensitive alternating inversion recovery (FAIR) labeling technique. St. Lawrence et al. (12) used a pulsed labeling technique with attenuating the static signal in arterial spin tagging (ASSIST) background suppression (13). This strategy necessitated a long 180-degree pulse in between clusters of slices for the ASL acquisitions in order to maintain suppression of the background signal, again reducing the CNR available at the later-acquired slices. Stefanovic et al. (11) also used a similar technique, limiting the number of slices acquired to 6.
Figure 1.
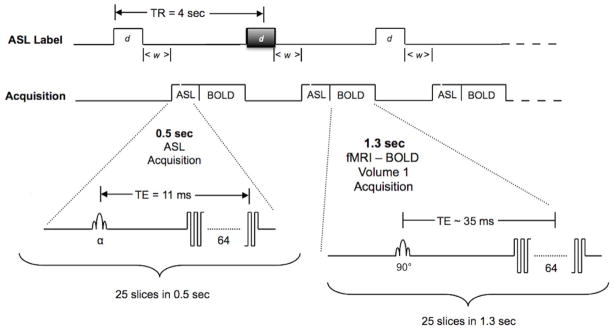
Diagram of the proposed double-excitation sequence for simultaneous ASL/BOLD imaging of brain activity. Grey shaded ASL labeling block indicates a control label that produces no inversion but identical magnetization transfer effects as the pCASL inversion block.
The limited number of slices and therefore, brain coverage, is of particular importance for studies involving brain connectivity mapping. Both task-based and intrinsic-connectivity fMRI studies have revealed networks covering the entire reach of the brain, even from the earliest periods in development (14–18). Therefore, while partial-brain coverage is useful for elucidating local relationships between neuronal function and hemodynamics (e.g. (11)) whole-brain coverage is essential to properly characterize the development and complex interplay of functional brain networks. However, until now the considerations outlined above have limited combined ASL/BOLD imaging to partial brain coverage (typically between 6 to 12 slices are acquired) rendering it a novel curiosity for a few specialists but limiting its value in brain connectivity mapping. Here we introduce a new method for simultaneous ASL/BOLD functional imaging that yields full brain coverage with adequate spatial and temporal resolution for whole brain mapping. The method we have implemented utilizes standard hardware configuration delivered by the manufacturer with RF body coil for transmission and 32-channel head coil for echo detection with SENSE reconstruction. Limitations related to a pulsed labeling strategy are overcome by utilizing either continuous (CASL) or pseudo-continuous (pCASL) labeling. pCASL labeling may be performed using the body coil without the need for separate hardware (e.g. a separate neck coil) as utilized for CASL.
A possible drawback of the double-excitation strategy could be reduced CNR available for the BOLD acquisitions because of partial saturation from the excitation pulses of the preceding ASL acquisition. However, functional ASL CNR is lower overall and thus it is advantageous to trade off BOLD CNR for ASL CNR. Moreover, for typical voxel sizes (e.g. 4 × 4 × 4 mm) physiological noise dominates over thermal noise (19), which will lessen the overall CNR reduction from the reduced effective TR (in this paper, we use the term “effective TR” to refer to the period of time available for recovery of longitudinal magnetization, and “actual TR” to refer to the actual repetition time). Following the approach of (19) which demonstrated minimal CNR reduction in BOLD acquisitions for excitation flip angles much below the Ernst angle, we also investigate the potential of lessening the BOLD CNR reduction by reducing the excitation flip angles for the ASL acquisitions. In a multi-slice sequence, the time between the ASL and BOLD acquisitions and hence the effective TR will be shorter in the first-acquired slices, since the BOLD acquisitions have a longer TE and therefore longer slice acquisition time.
Methods
ASL/BOLD Theory and Simulations
We simulated the ASL and BOLD signals obtained using three different methods: 1) the proposed (double-excitation) technique, 2) a single-excitation single-echo acquisition, and 3) a double-echo acquisition. This allows comparison between the SNR and CNR of the proposed acquisition scheme in relation to the other two. Simulations using a continuous ASL (CASL) sequence were performed using IDL (Exelis, Boulder, CO). The signal change due to application of the CASL tagging pulse was estimated using a theoretical model derived from a general kinetic model (20) as
| [1] |
where ; λ = blood-brain partition coefficient; f = cerebral blood flow; w = post-inversion delay; τ = labeling duration; R1a = arterial R1; α = labeling efficiency, R1app = apparent tissue R1; δ = tissue transit time; δa = arterial transit time. This model does not assume all spins have flowed into the voxel or that all spins have traversed from the arterial compartment into the tissue compartment. This model however does assume a single transit time for all spins; differences in signal change between a single transit time model and a distributed transit time model have been shown to be negligible (21).
The temporal SNR (tSNR) is a function both of physiological and thermal noise (19). Thermal noise is independent of MR signal strength, while physiological noise is proportional to MR signal strength. tSNR is related to image SNR (19) by
| [2] |
where λ is the proportionality constant between physiological noise (σp) and MR signal strength (SS): σp = λ SS. Image SNR is only a function of thermal noise and will be linearly related to MR signal strength: where SNR0 is the SNR for a baseline signal strength (SS0) and SS is the actual signal strength, which will be attenuated from SS0 by factors such as varying flip angle or varying effective TR.
Parameter values chosen for the simulation are either typical literature values or typical values used for implementation of the sequence at 3T and are listed in Table 1 (22–24). For the ASL acquisitions, labeling efficiencies of 0.8 and above are routinely achieved on a Philips Achieva 3T system using a pCASL labeling technique. A value of 700 ms for post-inversion delay was chosen (21) as a compromise between maximizing ASL functional contrast due to increased CBF while minimizing spurious contrast due to decreased transit time during functional activation. As the approximate time of peak ASL CNR occurs when the post-inversion delay is equal to the arterial transit time, using this value is only slightly sub-optimal for the first slices.
Table 1.
Parameter values used for the simulations. References are given for parameters taken from the literature.
| δa (arterial transit time) | 500 ms (24) |
| δ (tissue transit time) | 1500 ms (23) |
| τ (labeling duration) | 1500 ms (Typical value in our laboratory) |
| w (post-inversion delay) | 700 ms (21) |
| CBF (baseline) | 60 ml/(100g min) (20) |
| CBF (increase over baseline) | 50% (20) |
| BOLD signal (increase over baseline) | 2% at TE = 35 ms (Typical value in our laboratory) Corresponds to ΔR2* = 0.566 s−1 |
| λ (blood-brain partition coefficient) | 0.9 ml blood/g brain |
| α (labeling efficiency) | 0.8 (Typical value in our laboratory) |
| T1a (T1 of arterial blood) | 1660 ms (22) |
| T1app (apparent T1 in gray matter) | 1300 ms (43) |
| T2* of gray matter at 3 Tesla | 40 ms (43) |
| # slices | 30 |
| TE | Double-Excitation: 11 ms for ASL, 35 ms for BOLD Double-Echo: 11 ms for ASL, 35 ms for BOLD Single-Excitation Single-Echo: 15 ms, 20 ms, 25 ms, 30 ms |
| Time to Acquire Each Slice | TE + 7 ms |
| TR | Double-Excitation: 3958 ms Double-Echo: 3418 ms Single-Excitation Single-Echo: 2838 ms, 2983 ms 3128 ms, 3273 ms |
| SNR0 (Image SNR at TE = 30 ms) | 866 (19) |
| λ (physiological noise constant at TE = 30–35 ms) | 0.0092 (19, 25) |
| λ (physiological noise constant at TE = 25 ms) | 0.0083 (25) |
| λ (physiological noise constant at TE = 20 ms) | 0.0075 (25) |
| λ (physiological noise constant at TE = 15 ms) | 0.0067 (25) |
| λ (physiological noise constant at TE = 10–11 | 0.0059 (25) |
For our simulated double-excitation or double-echo scans we used the following parameters as typical values for use of the sequence at 3T: TEASL = 11 ms; TEBOLD = 35 ms; TA (time to acquire a slice) = TE + 7 ms; # slices acquired = 30; TR = minimum, T2* = 40 ms. For the simulated single-excitation single-echo scan, the echo time was allowed to vary; we used echo times of 15 ms, 20 ms, 25 ms, and 30 ms.
For the estimation of BOLD tSNR, we used published values (19) of λ = .0092, SNR0 = 866 (resulting in tSNR0 of approximately 100) for gray matter at 3 T for an echo time of 30 ms and voxel resolution of 3.75 × 3.75 × 4 mm. For the estimation of ASL tSNR (with a shorter TE), we used the data of (25) to estimate an appropriate value for λ (which is TE-dependent). The physiological noise σP is expressed as where σB is related to the physiological fluctuation in R2* and is thus TE dependent, while σNB is related to contributions with no TE dependency. Using the published values of
| [3] |
where σ0 is the thermal noise and S is the mean signal, we computed σP = 0.314 and λ = σP/S = 0.0059. For the single-excitation single-echo sequences, as σB varies approximately linearly in the range from TE = 10 ms to TE = 30 ms, the value of σB was estimated via linear interpolation and λ computed as above (values listed in Table 1).
Image SNR was adjusted from SNR0 for the effective TR (e.g. available relaxation time from previous excitation pulse) and for the difference in TE (SNR0 was given for TE = 30 ms). tSNR was calculated as in Eq. (2), using the appropriate values of image SNR and λ.
To estimate BOLD CNR, we used a typical value at 3T for BOLD signal increase over baseline of 2% at TE = 35 ms and thus BOLD CNR was estimated as
| [4] |
where for the single-excitation single-echo sequences which use shorter TEs, BOLDCONTRAST was adjusted from the 2% value used at TE = 35 ms.
To estimate ASL CNR, the following procedure was used. The functional contrast in ASL is given by
| [5] |
where fASL and bASL are the ASL acquisitions occurring during the functional and baseline conditions, respectively. The CNRs of the functional and baseline conditions are:
| [6] |
where tSNR represents the temporal SNR of the ASL images (assuming this does not vary significantly between baseline and functional acquisitions).
The fractional signal difference between label and control acquisitions is given by Eq. (1) and is linearly proportional to CBF. For the difference between the functional and the baseline condition, we used a typical value of CBF increase of 50% over baseline, and thus
| [7] |
| [8] |
The ASL CNR is therefore given by
| [9] |
where ΔM/M0 is given from Eq. (1), using the CBF value for the baseline condition (the factor of square root of 2 in the denominator is due to the overall contrast being the difference between functional and baseline).
We computed the BOLD CNR and the ASL CNR for the double-excitation, the double-echo, and the single-excitation single-echo sequences for the parameters above as a function of slice number. For the single-excitation single-echo sequence, we varied the TE, using values used of 15 ms, 20 ms, 25 ms, and 30 ms. We also computed maximum CNR per unit square root of time, as the different strategies allow for different minimum TRs (listed in Table 1).
Additional Simulations
For the double-excitation sequence, we also investigated the effect of reducing the excitation flip angle for the ASL acquisitions; we varied the flip angle from 90 degrees to 30 degrees in increments of 10 degrees. We also simulated the effect of physiological noise reduction via techniques such as cardiac and respiratory cycle monitoring (26), assuming that such techniques are capable of reducing physiological noise to approximately 40% of its pre-correction magnitude.
ASL/BOLD fMRI Experiments in Human Subjects
Narrative Comprehension Task in Children
The double-excitation technique described above was implemented on a Philips 3T Achieva system. Gradient-echo EPI imaging parameters were: TEASL = 11 ms; TEBOLD = 32 ms; # slices acquired = 24; TR = 4000 ms; EPI matrix = 64 × 64; in-plane resolution = 3.75 mm × 3.75 mm; slice thickness = 5 mm. A balanced pCASL sequence was used with: label duration = 1500 ms; post-inversion delay = 700 ms; mean B1 = 1 μT; pulse duration = 500 μs; time between pulses = 1500 μs; max gradient = 0.6 mT/m; mean gradient = 0.1 mT/m. For this study, the excitation flip angle for the ASL acquisitions was 90 degrees.
Participants were 35 typically-developing healthy children ages 5–18 years performing a narrative comprehension task. The study was approved by the local Institutional Review Board (IRB); informed consent and assent (where appropriate) were obtained from a parent/guardian and the participant, respectively.
The narrative comprehension task uses a 64-second alternating block design in which a different story, read by an adult female speaker, is presented during each active block. Each story was designed by a speech-language pathologist to be appropriate for young children. During the control blocks, to control for sublexical auditory processing, broadband noise in the frequency range of speech is presented in a gradual sweep across frequencies (500–4000 Hz). The duration of each sweep varies from 0.5 to 4 seconds. Five 64-second active blocks and five 64-second control blocks are presented in an alternating sequence for a total scan time of 10 min. 40 sec. This comparison between naturalistic speech and non-speech auditory processing is designed to engage multiple aspects of language processing while controlling for purely auditory stimulation.
Data was post-processed using routines written in IDL (Exelis, Boulder, CO) incorporated into the LONI post-processing pipeline (UCLA) (27, 28). The ASL (short TE) and BOLD (long TE) images were separated and post-processed separately. Data was motion-corrected using a pyramid iterative algorithm (29), sequentially using each of the acquired volumes as the reference. Using an intensity-based cost function (30) as the metric of comparison the optimal reference volume for motion correction was then selected. After motion correction, data were transformed into the MNI space using a non-linear transformation derived from the T1-weighted anatomical image, a pediatric template (31) and the coregistration routine available in SPM8 (Wellcome Dept. of Cognitive Neurology, London, UK). Data were spatially filtered using a Gaussian filter with σ = 7 mm. BOLD functional activation was computed using a general linear model (GLM) with design matrix including task condition as the regressor of interest; linear and quadratic drift terms, parameters from the motion correction, and whether the image was acquired during the label or control pCASL tagging condition were included as covariates of no interest. For the ASL data, as is typically done, surround subtraction (32, 33) was performed prior to the GLM on both the data and the design matrix. ASL functional activation was computed using a GLM and a similar design matrix as for the BOLD analysis but with a pCASL tagging condition by task interaction as the regressor of interest and no drift terms included as covariates.
For the second-level (group) analysis, a one-sample t-test was used. A Monte Carlo simulation was used to find an intensity (t ≥3.25) and spatial-extent threshold (50 contiguous voxels) corresponding to a significance value of p < 0.01 with family-wise error correction. We made a comparison of overall within-group sensitivity between the ASL and BOLD images acquired using our double excitation experiment. The mean Z-score for all voxels with significant group activation for both the BOLD analysis and the ASL analysis was computed for all participants. To account for the expected greater intra-subject BOLD sensitivity (5, 6) leading to higher Z-scores for the BOLD analysis, we normalized the Z-scores for each analysis to unity mean and compared the variances, after regressing out age and sex.
Estimation of Physiological Noise Parameter at TE = 11 ms
A slight discrepancy between the physiological noise parameter at TE = 11 ms estimated by Kruger et al. (25) and our sequence as actually implemented is expected for two reasons (34). First we used a 32-channel coil, as opposed to a single channel transmit-receive. In addition we used parallel imaging with an acceleration factor of 2 (which is necessary to reduce the total readout time to achieve a TE as short as 11 ms). However, (34) have shown minimal dependence of λ on number of coil elements, and on parallel imaging with a low (2) acceleration factor at the lower spatial resolution we are using here. To validate the choice of physiological noise parameter λ at TE = 11 ms empirically, we used baseline CBF data available from ASL measurements in the same 30 children at rest. These are the same participants who also performed the narrative processing task described above during ASL/BOLD fMRI. The resting state ASL data can be used to compute CBF maps, including pairs of label-control acquisitions (with no functional task). T1 maps were also computed in the same subjects based on an inversion-recovery EPI sequence with the same voxel size, acquired during the same session as the CBF and ASL/BOLD image data.
Scan parameters for the baseline CBF scans were identical to the narrative processing task with the exception that there was no BOLD acquisition following the ASL acquisitions, and the post-inversion delay was lengthened to 1500 ms. Scan parameters for the T1 maps were also identical with the exception that the ASL labeling was omitted, and inversion-recovery (180-degree) pulses preceded each slice: TI values used were 100, 200, 300, 500, 750, 1000, 2000, and 3000 ms. T1 maps were constructed by fitting the inversion-recovery curve using routines written in IDL.
For estimation of λ, we used the technique similar to that of (19), detailed as follows:
Motion-correction of the CBF data, using the technique detailed in the previous section;
Visual inspection of the data for residual motion artifacts which would artifactually reduce the calculated tSNR and inflate the value of λ: two datasets with apparent visual motion were rejected;
Restricting analysis to voxels in gray matter by using only voxels with 1.2 s < T1 < 1.5 s;
Estimation of image noise by selection of an ROI far away from the head, computing the spatial standard deviation, and multiplying by a factor of (35) to account for the non-Gaussianity of the magnitude signal; noise estimates were averaged across all volumes;
Estimate of average image signal by averaging the signal across all gray matter voxels and across all acquired volumes, computed separately for labeled and control acquisitions;
Computation of spatial SNR as mean image signal/image noise (i.e. (5)/(4);
Estimation of temporal SNR for each voxel, after linear and quadratic de-trending, as signal mean divided by standard deviation, computed separately for labeled and control acquisitions;
Computation of tSNR as the mean over all voxels and over all acquisitions (labeled or control);
Computation of λ by solving Eq. (2).
In SENSE reconstruction (unlike sum-of-squares reconstruction without parallel acceleration) the real and imaginary data from each coil are linearly summed separately (with weighting factors from the unfolding matrix) and afterwards the image magnitude is computed. Therefore, estimation of SNR via use of background signal, as we are doing in step 4), is subject to some bias and should not be performed if the goal of such measurements is to compare coils or pulse sequences (36). However, the amount of such bias is not very large for the technique of estimating spatial standard deviation, which overestimates SNR by approximately only 17%, as found empirically (36), and thus we deem it sufficiently accurate for our purposes of estimating the physiological noise constant λ, which is not sensitive to slight misestimation of SNR when SNR ≫ tSNR.
Empirical Comparison of Double-Excitation versus Double-Echo Sequence
The narrative comprehension paradigm was also performed by a cohort of 7 normal adults (1 M, 6 F, age = 39.3 ± 13.6 years). IRB approval was also obtained for this study and informed consent obtained from all participants. The paradigm was also implemented using the double-echo acquisition technique with the same TEs and TR as used for the double-excitation approach. For the double-excitation approach, the excitation flip angle used for the ASL acquisitions was 60 degrees. Technique order was counterbalanced across participants.
FMRI data processing was carried out using FSL (FMRIB’s Software Library, www.fmrib.ox.ac.uk/fsl). Data were first motion corrected using MCFLIRT (37). The timeseries were high pass filtered at a period of 128 seconds and 6 mm isotropic spatial smoothing was applied. The general linear model was set up for use with unsubtracted ASL data using the approach described by Mumford et al. (38). This approach was used to enable a more accurate comparison between BOLD and ASL CNR. There are three primary regressors in the design matrix: 1.) An alternating control/tag regressor to represent the baseline ASL signal, 2.) A BOLD task regressor created by convolving the block design with a gamma variate hemodynamic response function, and 3.) An ASL task regressor formed as the modulation of regressors 1 and 2. The six motion correction timecourses output by MCFLIRT were included as nuisance regressors in the design. Time-series statistical analysis was carried out using FILM with local autocorrelation correction (39). Affine registration of the functional volumes to the subject’s T1 structural image was followed by a nonlinear warping to MNI space using symmetric diffeomorphic image registration as implemented in the Advanced Normalization Tools (ANTs) software package (40).
Empirical comparison between the double-excitation and the double-echo sequence was performed as follows. A fixed-effects analysis was performed in order to define ROIs for each technique (double-excitation versus double-echo). Regions were deemed significant at T > 4, 100 contiguous voxels for ASL; T > 8, 100 contiguous voxels for BOLD. The ROIs were defined as the union of all voxels meeting significance for either technique. The average T-score in the ROI was computed for each participant. Results were compared using a paired t-test; in addition, the percentage loss in CNR of the worse-performing technique was estimated as
| [10] |
Results
Theoretical Simulations
Comparisons of the double-excitation vs. the double-echo and single-excitation single-echo techniques for ASL CNR and CNR per unit time as a function of slice number are plotted in Figure 2. Our results clearly show that the advantage in double-excitation approach is that it preserves the ASL CNR remaining in the brain in the later slices much better than the other acquisition schemes. At the 24th slice, the ASL CNR obtained using the double-excitation method shows an almost 50% improvement over that obtained using the double-excitation method (Figure 2, top). The double-excitation method also out-performs all the single-excitation single-echo methods. Accounting for the differences in minimum TR between the sequences (Figure 2, bottom), the double-excitation sequence outperforms all the other sequences except for the single-excitation single-echo with TE = 15ms (for which performance is comparable), and the first five slices in the double-echo sequence. However, the ASL CNR per unit time still shows a 40% improvement over the double-echo method at the 24th slice, and only suffers approximately a 7% reduction in CNR per unit time for the first slice acquired.
Figure 2.

Diagram of ASL CNR (top) and CNR per unit time (bottom) at TR = minimum as a function of slice number for the proposed double-excitation acquisition, a double-echo acquisition, and single-excitation single-echo acquisitions at varying TEs.
Comparisons of the double-excitation vs. the double-echo and single-excitation single-echo techniques for BOLD CNR and CNR per unit time are plotted in Figure 3 as a function of slice number. In the earlier slices, the double-excitation sequence suffers some CNR loss (~7%) as a result of the reduced effective TR (which is more pronounced in the earlier-acquired slices) as compared to the double-echo sequence (Figure 3, top). Both the double-excitation and the double-echo sequences clearly outperform the single-excitation single-echo sequences due to the longer TE. Accounting for the differences in minimum TR between the sequences (Figure 3, bottom), the double-excitation sequence suffers an approximately 13% reduction in CNR per unit time (in the earliest slices) compared to the double-echo sequence, but overall outperforms all the single-excitation single-echo sequences.
Figure 3.

Diagram of BOLD CNR (top) and CNR per unit time (bottom) as a function of slice number for the proposed double-excitation acquisition, a double-echo acquisition, and single-excitation single-echo acquisitions at varying TEs.
The effect of reducing the ASL excitation flip angle is plotted in Figure 4. A minimal reduction in ASL CNR is seen even for reducing the flip angle to 30 degrees (Figure 4, top; intermediate values of flip angle not plotted), due to the very weak dependence of CNR on flip angle in the regime where physiological noise dominates (19). However, approximately a 10% relative improvement in BOLD CNR is available (Figure 4, bottom) when the flip angle is reduced to 60 degrees, with minimal improvements obtained from reducing the flip angle further.
Figure 4.

Diagram of ASL CNR (top) and BOLD CNR (bottom) for the double-excitation acquisition as a function of slice number, using different excitation flip angles for the ASL acquisitions (excitation flip angle for the BOLD acquisitions remains at 90 degrees).
The effect of physiological noise reduction to 40% of pre-correction magnitude, in agreement with published values (26), using an ASL excitation flip angle of 60 degrees, is plotted in Figure 5. The relative performance of the sequences is very similar for ASL (Figure 5, top); for BOLD (Figure 5, bottom), the double-excitation sequence performs slightly worse, although the reduction in BOLD CNR as compared to the double-echo sequence still only ranges between 3%–6%.
Figure 5.

Diagram of ASL CNR (top) and BOLD CNR (bottom) as a function of slice number for the double-excitation acquisition, a double-echo acquisition, and single-excitation single-echo acquisitions at varying TEs, assuming that techniques for physiological noise reduction are successful in reducing the physiological noise to 40% of its pre-correction magnitude.
Narrative Comprehension Task (Child Study)
The group BOLD and group ASL activation patterns (Figure 6) both show activation in superior and middle temporal gyrus (BA 21/22) bilaterally, as shown previously for a BOLD-only version of this task in normal children (17, 41). Z-scores (averaged over all voxels with significant group activation for both tasks) were 1.28 +/− 0.73 for the BOLD data and 0.644 +/− 0.67 for the ASL data. Normalizing to unity mean yielded an inter-subject variance of 1.08 for the ASL data and 0.33 for the BOLD data. This difference is significant (F(34,34) = 3.32, p < 0.001). In order to remove the effect the age range and sex distribution of our subject population might have on the BOLD and ASL signals, we regressed out age and sex and recomputed the variances. In this case the inter-subject variance was 0.99 for the ASL data and 0.29 for the BOLD data; this difference is also significant (F(32,32) = 3.36, p < 0.001). These results indicate significantly less inter-group variability and thus greater sensitivity for within-group analyses in the BOLD data.
Figure 6.
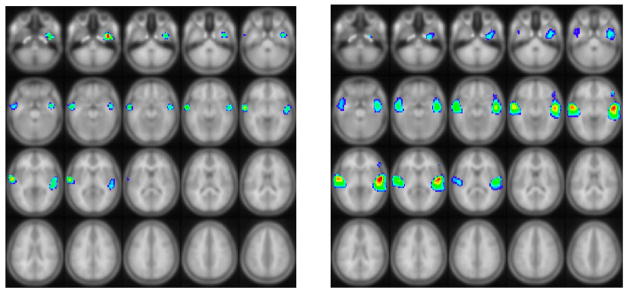
Group functional activation (Left: ASL activation; Right: BOLD activation) from a cohort of 35 normal children ages 5–18 performing a narrative comprehension task using the double-excitation acquisition technique, demonstrating greater inter-group sensitivity in BOLD compared to ASL. All regions are significant at FWE corrected p < 0.01. Images in radiologic orientation (Slice locations: Z = −47 mm to Z = +48 mm, MNI coordinate space).
Estimation of Physiological Noise Parameter at TE = 11 ms
Results (Table 2) show our results of λ = .00596 ± 0.0023 in good agreement with our assumed theoretical value of λ = .0059. The physiological noise constant was higher (λ = .00617 ± 0.0023) during the control acquisitions than during the labeled acquisitions (λ = .00579 ± 0.0023) and this result was statistically significant (p < 0.01, paired t-test). As would be expected, the image SNR was higher during the control acquisition (p < 0.001, paired t-test), while the temporal SNR was lower (p < 0.001, paired t-test), as there is more signal during the control acquisitions from blood, a major contributor to physiological noise.
Table 2.
Image SNR, Temporal SNR, and physiological noise parameter λ for each of 28 children with usable data and the group average, calculated from baseline CBF data. Values are: averaged over control and tagged acquisitions (left), averaged over control acquisitions (center), and averaged over tagged acquisitions (right).
| COMBINED | CONTROL ACQUISITIONS ONLY | TAGGED ACQUISITIONS ONLY | |||||||
|---|---|---|---|---|---|---|---|---|---|
| Subject | Temporal SNR | Image SNR | λ | Temporal SNR | Image SNR | λ | Temporal SNR | Image SNR | λ |
| 1 | 176.330 | 824.260 | 0.00553988 | 169.592 | 828.933 | 0.00577179 | 183.069 | 819.587 | 0.00532440 |
| 2 | 159.696 | 677.948 | 0.00608569 | 158.747 | 679.955 | 0.00612523 | 160.644 | 675.941 | 0.00604658 |
| 3 | 150.552 | 531.756 | 0.00637045 | 164.965 | 534.298 | 0.00576573 | 136.139 | 529.214 | 0.00709823 |
| 4 | 113.984 | 527.537 | 0.00856595 | 107.588 | 529.982 | 0.00910120 | 120.379 | 525.092 | 0.00808583 |
| 5 | 155.234 | 705.653 | 0.00628410 | 152.620 | 708.801 | 0.00639853 | 157.847 | 702.504 | 0.00617324 |
| 6 | 108.237 | 461.438 | 0.00898126 | 97.1675 | 463.295 | 0.0100626 | 119.306 | 459.580 | 0.00809449 |
| 7 | 232.070 | 684.594 | 0.00405390 | 216.686 | 687.609 | 0.00437983 | 247.455 | 681.579 | 0.00376540 |
| 8 | 87.9514 | 534.047 | 0.0112147 | 90.9384 | 536.777 | 0.0108375 | 84.9645 | 531.316 | 0.0116182 |
| 9 | 134.017 | 423.561 | 0.00707838 | 129.461 | 424.935 | 0.00735712 | 138.573 | 422.187 | 0.00681661 |
| 10 | 219.887 | 550.070 | 0.00416863 | 211.533 | 552.004 | 0.00436652 | 228.241 | 548.135 | 0.00398344 |
| 11 | 202.709 | 657.368 | 0.00469279 | 185.251 | 660.194 | 0.00518120 | 220.166 | 654.542 | 0.00427737 |
| 12 | 94.2682 | 586.468 | 0.0104701 | 95.1375 | 589.834 | 0.0103735 | 93.3989 | 583.101 | 0.0105685 |
| 13 | 131.727 | 447.202 | 0.00725466 | 123.762 | 448.146 | 0.00776580 | 139.692 | 446.258 | 0.00679884 |
| 14 | 225.451 | 423.510 | 0.00375484 | 222.621 | 425.943 | 0.00382959 | 228.281 | 421.077 | 0.00368094 |
| 15 | 132.646 | 544.530 | 0.00731178 | 136.778 | 546.554 | 0.00707847 | 128.513 | 542.506 | 0.00755981 |
| 16 | 135.673 | 421.654 | 0.00697869 | 132.729 | 423.306 | 0.00715423 | 138.617 | 420.001 | 0.00680988 |
| 17 | 199.746 | 368.273 | 0.00420599 | 191.200 | 369.889 | 0.00447720 | 208.293 | 366.657 | 0.00395103 |
| 18 | 182.954 | 600.827 | 0.00520630 | 174.472 | 603.259 | 0.00548663 | 191.435 | 598.394 | 0.00494918 |
| 19 | 189.182 | 646.624 | 0.00505461 | 183.336 | 648.456 | 0.00523194 | 195.029 | 644.793 | 0.00488726 |
| 20 | 95.3438 | 773.090 | 0.0104083 | 88.5095 | 773.933 | 0.0112241 | 102.178 | 772.246 | 0.00970078 |
| 21 | 188.208 | 501.113 | 0.00492429 | 178.348 | 503.312 | 0.00524320 | 198.068 | 498.914 | 0.00463387 |
| 22 | 203.448 | 421.969 | 0.00430624 | 198.167 | 422.858 | 0.00445782 | 208.729 | 421.080 | 0.00416087 |
| 23 | 266.063 | 695.047 | 0.00347223 | 256.693 | 697.469 | 0.00362227 | 275.433 | 692.625 | 0.00333123 |
| 24 | 225.196 | 459.657 | 0.00387115 | 217.565 | 461.018 | 0.00405229 | 232.826 | 458.296 | 0.00369951 |
| 25 | 205.452 | 417.969 | 0.00423870 | 194.440 | 419.892 | 0.00455832 | 216.464 | 416.047 | 0.00394519 |
| 26 | 162.629 | 538.454 | 0.00586179 | 158.339 | 538.519 | 0.00603641 | 166.920 | 538.389 | 0.00569569 |
| 27 | 264.014 | 581.416 | 0.00337465 | 254.355 | 583.349 | 0.00353811 | 273.674 | 579.483 | 0.00322081 |
| 28 | 278.714 | 644.642 | 0.00323522 | 272.573 | 646.435 | 0.00332665 | 284.856 | 642.849 | 0.00314708 |
| Average | 175.764 | 558.953 | 0.00596304 | 170.128 | 561.034 | 0.00617156 | 181.400 | 556.871 | 0.00578658 |
Empirical Comparison of Double-Excitation vs. Double-Echo Method (Adult Study)
Qualitatively, results look quite similar for the narrative comprehension task for the two techniques for BOLD (Figure 7, top); however, there was much less activation detected with ASL using the double-echo technique (Figure 7, bottom). Average T-scores for each technique along with the CNR loss for the worse technique are listed in Table 3. A statistically significant difference was seen with ASL (paired t-test; T = 4.82, p < 0.003). For BOLD, the CNR loss is very insignificant at one percent or less, as expected from the simulation results. The ASL CNR loss for the double-echo technique (at around 40%) is somewhat larger than expected from the simulation (for slices acquired midway through the acquisition). However, in practice the CNR loss would be expected to be larger since the actual time needed for slice acquisition for the double-echo technique was greater than the value of TE + 7 ms assumed in the simulations. Complete agreement between experimental results and the simulations is also not expected due to differences in parameters such as tissue transit time, arterial transit time, and physiological noise constant.
Figure 7.

Results (fixed-effects analysis) from a cohort of 7 normal adults performing a narrative comprehension task, comparing the double-excitation acquisition technique to the double-excitation acquisition technique, showing minimal differences in BOLD sensitivity, but large differences in ASL sensitivity. Images in radiologic orientation (Slice locations: Z = −4 mm to Z = +18 mm, MNI coordinate space).
Table 3.
Empirical comparison of double-excitation acquisition technique to double-echo technique: Average T-scores and CNR loss for the worse-performing technique for ASL and BOLD contrasts for the narrative comprehension task in a cohort of 7 normal adults, across the ROIs shown in Figure 7. P-values obtained using paired t-test.
| Contrast | T-Score (Mean ± SEM), Double-Excitation | T-Score (Mean ± SEM), Double-Echo | p | CNR Loss, % (Mean ± SEM) |
|---|---|---|---|---|
| ASL | 2.75 ± 0.38 | 1.66 ± 0.43 | .003 | 42.51 ± 8.25 |
| BOLD | 4.44 ± 0.86 | 4.57 ± 0.82 | n.s. | 0.54 ± 16.03 |
Discussion
A technique that simultaneously acquires ASL and BOLD with full-brain coverage using standard RF hardware has immediate applications for studies of brain development in children as well as for studying the developing child connectome. Future work will use this method to map growth trajectories of specific cognitive functions, with the goal to understand the relationship between developmental changes in perfusion and changes in neuronal activity associated with neurocognitive development. It is clearly necessary to image the whole brain in order to be able to understand the dynamics within and between brain networks and their impact on the developing brain, as is being investigated in the adult “Human Connectome” project, and to investigate the complex relationship between blood flow dynamics and neuronal function. In addition, this technique may also be useful in disease conditions where cerebral bloodflow is atypical, such as stroke or cardiac disease.
The simulation results clearly show that the proposed double-excitation technique results in improved ASL functional contrast in whole-brain simultaneous BOLD/ASL acquisitions compared to previously described methods such as a double-echo method. By the time the 24th slice is acquired using a double-echo method, significant longitudinal recovery has occurred, resulting in only about 66% of the CNR remaining for ASL as compared to the double-excitation method. While, theoretically, the CNR available for the BOLD acquisition will be reduced as the effective TR is decreased, our simulations show that this cost is not great (only around 7%) and can be reduced even further (to only 1%) by using reduced excitation flip angles for the ASL acquisitions, with minimal cost in terms of ASL CNR.
In practice, our method may even provide slightly greater improvements in ASL CNR and smaller reductions in BOLD CNR compared to the double-echo sequence. Our simulations did not take into account that for the double-echo sequence to acquire all the necessary data in the available time, it might be necessary to either increase acquisition bandwidth, or resort to partial k-space techniques, either of which will reduce the actual CNR. In fact, in actual practice we were not able to acquire slices as fast for the double-echo technique as was assumed in the simulations, for the same acquisition parameters as used for the double-excitation technique.
A different potential approach for simultaneous ASL/BOLD whole-brain imaging is to employ the single-excitation single-echo technique. However, our results show this strategy to be suboptimal, as using a single TE necessitates a compromise between BOLD CNR and ASL CNR. Physiological noise effects significantly reduce ASL CNR if a longer TE is used since the physiological noise constant λ increases with TE. This technique does benefit from a shorter minimum TR, and similar ASL CNR per unit time is available using TE = 15 ms compared to the double-excitation approach (Figure 3, bottom); however, using this short TE results in a large reduction in BOLD CNR per unit time. Moreover, there may be practical limitations to this approach in pediatric populations and when pCASL labeling is accomplished using a body coil. The minimum TRs for the single-excitation single-echo sequences with TE = 15 ms and TE = 20 ms are under 3 seconds, and SAR limitations may render this short of a TR (with over half the time in each TR used for labeling) unfeasible in practice.
Our simulations also demonstrate the benefit of using reduced excitation flip angles for the ASL acquisitions. Our approach takes advantage of the fact that the physiological noise dominates the thermal noise for EPI acquisitions at these voxel sizes and TEs. This fact has also been used to show that minimal reduction in CNR for BOLD fMRI occurs when excitation flip angles much less than the Ernst angle are used (19). Imaging at a lower flip angle may provide advantages such as enhanced tissue contrast and reduced inflow effects. Similarly, our approach reduces the excitation flip angles for the ASL acquisition, with minimal cost in terms of ASL CNR. This provides more longitudinal magnetization available for the BOLD scans.
We note however that the effect of changing the effective TR is not identical to that of changing the flip angle. Unlike fully-relaxed spins sampled with a reduced flip angle, the proportion of signal coming from the blood will change if the effective TR is changed, since the T1 of the blood (which is the major contributor to the physiological noise) is different from the T1 of the surrounding gray matter. This will result in a non-linear relationship between signal magnitude and physiological noise. However, the T1 of both arterial (20) and of venous blood (42), approximately 1600 ms, is slightly longer than the T1 of gray matter at 3 Tesla (43), approximately 1300 ms. This effect will make the amount of physiological noise lower than what would be predicted by the linear relationship used in our simulations. Thus, our simulations represent a lower bound of the actual BOLD CNR from the double-excitation sequence.
Our empirical estimation of the physiological noise parameter at TE = 11 ms of λ = 0.0062 during the control acquisitions and λ = 0.0058 during the labeled acquisitions yields good agreement with the results of (25), supporting our choice to use these published literature values in our CNR simulations. Our estimation is not intended to be a rigorous calculation of this parameter, as the estimation of the signal noise using SENSE reconstruction has some bias associated with it. Our results, however, show that the literature values of physiological noise constants, typically obtained with single-channel coils or using sum-of-squares reconstruction with multi-channel coils (19, 25), are applicable to parallel imaging sequences, at least at larger voxel sizes, supporting the previous results of (34).
Results from the empirical comparison of the double-echo versus the double-excitation sequence (the adult study) agree nicely with our simulations. The results clearly show the loss of ASL signal using the double-echo technique, due to the time delay in acquiring those slices. Also in accordance with the simulations, minimal BOLD CNR loss results from using the double-excitation technique. Greater intra-subject BOLD CNR (~2–3 X) compared to ASL CNR, in agreement with previous studies (5, 6), was also shown. This observation is subject to the caveat that BOLD CNR is not directly comparable to ASL CNR: the BOLD signal is highly autocorrelated due to the 1/f nature of the noise while the ASL control-label pairs approach statistical independence (5). On the other hand with our implementation of the double excitation method there are half as many control-label pairs available to compute functional ASL activation compared to total number of acquisitions used to compute functional BOLD activation. In practice, results will depend on the baseline CBF and CBF change from baseline for ASL contrast, and a range of additional factors including CMRO2 and hematocrit for BOLD contrast, which will vary across populations and cortical regions.
Contrary to what has been suggested in a few previous reports (5, 6), however, we found significantly greater sensitivity for within-group BOLD analyses compared to ASL in the child study. This discrepancy is likely related to methodology, sample size, and possibly activation paradigm. Aguirre (5) found greater group activation with ASL with a sample size of N = 10 in the visual cortex using a visual stimulation paradigm; however, a random-effects statistical test was not employed, limiting generalizability. Moreover, this study used a sub-optimal BOLD scan protocol (TE = 22 ms at 1.5 Tesla) resulting in a BOLD CNR of approximately half of its optimal value. One study (6), using an optimized BOLD protocol, reported greater group activation with ASL, with a sample size of N = 6 adults in the motor cortex using a finger tapping paradigm, but only for task paradigms with greater than 4 minutes alternating on-off task periods. Our study involves a larger sample size of children (N = 35) and involves a different type of task (narrative processing) and activated region (superior temporal gyrus). Whether our results will generalize to different populations, tasks, and cortical regions is a subject for future research. Nevertheless, these results demonstrate the importance of optimizing combined ASL/BOLD acquisitions for ASL contrast.
A possible drawback of the proposed technique is that it is likely to increase inflow effects (44) for the BOLD acquisition in the first slices, due to the decreased effective TR. While inflow effects have the desirable property of increasing overall contrast in BOLD scans, they have the undesirable property that they are located primarily in large arteries and draining veins, away from the sites of neuronal activation. This effect however is likely not of major concern for the voxel sizes typically used on whole-brain ASL/BOLD (~4 × 4 × 4 mm). Moreover, inflow effects for gradient-echo EPI sequences appear to primarily affect the shape and latency of the hemodynamic response function (HRF), as opposed to activation magnitude (45). Nevertheless, if inflow effects are a concern, they can be significantly reduced by lowering the flip angle of the excitation pulses for the BOLD acquisitions, as previously proposed for BOLD-only acquisitions (19), and is a subject for future research.
Additionally, while our ASL acquisitions did not employ crusher gradients to null signal from the arteries and confine it to arterioles and capillaries, such gradients may be deployed if confinement of contrast to the brain parenchyma is desired, with the tradeoff of reduced CNR. Note that ASL contrast is primarily present on the arterial side and in the capillaries, as contrast in the veins is severely reduced due to the short T1 of blood. An alternative strategy to localize contrast to the brain parenchyma is to increase the post-inversion delay such that all spins will have diffused into the tissue compartment; this also comes at the cost of reduced CNR and also of increased TR.
We note that our implementation is not specific to 2D multislice acquisitions, and a possible alternative is a 3-D technique such as single-shot 3-D GRASE (46) or a stack of spirals 3D acquisition (47). As originally proposed, the 3-D GRASE acquisition uses a repeated short (> ~20 ms) 2-D EPI readout for each kz, with refocusing RF pulses between each readout. Like our proposed double-excitation sequence, acquisitions are kept as close to the tagging pulse as possible for optimal ASL contrast. The 3D GRASE acquisition is not optimal for BOLD since the contrast is predominantly T2, not T2*, weighted. However, a T2*-weighted 3-D acquisition such as 3-D PRESTO (48, 49) could follow the GRASE acquisition for optimized BOLD contrast. Similar to what was done in the multislice 2D case, BOLD CNR can be improved by reduction of the ASL excitation flip angle (in order to preserve longitudinal magnetization for the BOLD scan). Readout acquisition time can be shortened via parallel imaging and/or partial k-space techniques (possibly in both phase encoding directions). Comparison of 3-D to multislice acquisition will likely depend on available hardware and a detailed comparison of the two techniques is beyond the scope of this paper.
In conclusion, the ASL/BOLD functional imaging method proposed here will allow nearly simultaneous acquisition of perfusion-weighted and BOLD-weighted functional maps from the same task. We are currently undertaking a large scale study using this method in children ranging in age from birth to 18 years with the goal in mind of mapping developmental trajectories in brain activity and connectivity in this age group. However, we would like to point out that the proposed technique greatly facilitates a broad range of other applications. The quantitative nature of the technique can provide a stable marker of brain activity, unlike BOLD imaging alone, which is hampered by scanner drifts and variance of the BOLD response across subjects and scanners (5, 6, 50, 51). This technique can thus be a very powerful for longitudinal functional MRI studies, multi-center studies or studies comparing subject populations. Such applications could include drug studies, studies of cortical plasticity as a result of cognitive training (52, 53), or examining brain function differences due to psychiatric disorders.
Acknowledgments
Grant Support: National Institute of Child Health and Human Development (NIH - HHSN275200900018C, the Pediatric Functional Imaging Research Network).
References
- 1.Schapiro MB, Schmithorst VJ, Wilke M, Byars AW, Strawsburg RH, Holland SK. BOLD fMRI signal increases with age in selected brain regions in children. Neuroreport. 2004;15(17):2575–8. doi: 10.1097/00001756-200412030-00003. Epub 2004/12/01. [DOI] [PMC free article] [PubMed] [Google Scholar]
- 2.Toga AW, Clark KA, Thompson PM, Shattuck DW, Van Horn JD. Mapping the human connectome. Neurosurgery. 2012;71(1):1–5. doi: 10.1227/NEU.0b013e318258e9ff. Epub 2012/06/19. [DOI] [PMC free article] [PubMed] [Google Scholar]
- 3.Hoge RD. Calibrated FMRI. Neuroimage. 2012;62(2):930–7. doi: 10.1016/j.neuroimage.2012.02.022. Epub 2012/03/01. [DOI] [PubMed] [Google Scholar]
- 4.Hoge RD, Atkinson J, Gill B, Crelier GR, Marrett S, Pike GB. Investigation of BOLD signal dependence on cerebral blood flow and oxygen consumption: the deoxyhemoglobin dilution model. Magnetic resonance in medicine: official journal of the Society of Magnetic Resonance in Medicine/Society of Magnetic Resonance in Medicine. 1999;42(5):849–63. doi: 10.1002/(sici)1522-2594(199911)42:5<849::aid-mrm4>3.0.co;2-z. Epub 1999/11/05. [DOI] [PubMed] [Google Scholar]
- 5.Aguirre GK, Detre JA, Zarahn E, Alsop DC. Experimental design and the relative sensitivity of BOLD and perfusion fMRI. Neuroimage. 2002;15(3):488–500. doi: 10.1006/nimg.2001.0990. Epub 2002/02/19. [DOI] [PubMed] [Google Scholar]
- 6.Wang J, Aguirre GK, Kimberg DY, Roc AC, Li L, Detre JA. Arterial spin labeling perfusion fMRI with very low task frequency. Magnetic resonance in medicine: official journal of the Society of Magnetic Resonance in Medicine/Society of Magnetic Resonance in Medicine. 2003;49(5):796–802. doi: 10.1002/mrm.10437. Epub 2003/04/22. [DOI] [PubMed] [Google Scholar]
- 7.Woolrich MW, Chiarelli P, Gallichan D, Perthen J, Liu TT. Bayesian inference of hemodynamic changes in functional arterial spin labeling data. Magnetic resonance in medicine: official journal of the Society of Magnetic Resonance in Medicine/Society of Magnetic Resonance in Medicine. 2006;56(4):891–906. doi: 10.1002/mrm.21039. Epub 2006/09/12. [DOI] [PubMed] [Google Scholar]
- 8.Liu TT, Wong EC, Frank LR, Buxton RB. Analysis and design of perfusion-based event-related fMRI experiments. Neuroimage. 2002;16(1):269–82. doi: 10.1006/nimg.2001.1038. Epub 2002/04/24. [DOI] [PubMed] [Google Scholar]
- 9.Glielmi CB, Xu Q, Craddock RC, Hu X. Simultaneous acquisition of gradient echo/spin echo BOLD and perfusion with a separate labeling coil. Magnetic resonance in medicine: official journal of the Society of Magnetic Resonance in Medicine/Society of Magnetic Resonance in Medicine. 2010;64(6):1827–31. doi: 10.1002/mrm.22554. Epub 2010/07/22. [DOI] [PMC free article] [PubMed] [Google Scholar]
- 10.Kastrup A, Kruger G, Neumann-Haefelin T, Glover GH, Moseley ME. Changes of cerebral blood flow, oxygenation, and oxidative metabolism during graded motor activation. Neuroimage. 2002;15(1):74–82. doi: 10.1006/nimg.2001.0916. Epub 2002/01/05. [DOI] [PubMed] [Google Scholar]
- 11.Stefanovic B, Warnking JM, Rylander KM, Pike GB. The effect of global cerebral vasodilation on focal activation hemodynamics. Neuroimage. 2006;30(3):726–34. doi: 10.1016/j.neuroimage.2005.10.038. Epub 2005/12/13. [DOI] [PubMed] [Google Scholar]
- 12.St Lawrence KS, Frank JA, Bandettini PA, Ye FQ. Noise reduction in multi-slice arterial spin tagging imaging. Magnetic resonance in medicine: official journal of the Society of Magnetic Resonance in Medicine/Society of Magnetic Resonance in Medicine. 2005;53(3):735–8. doi: 10.1002/mrm.20396. Epub 2005/02/22. [DOI] [PubMed] [Google Scholar]
- 13.Ye FQ, Frank JA, Weinberger DR, McLaughlin AC. Noise reduction in 3D perfusion imaging by attenuating the static signal in arterial spin tagging (ASSIST) Magnetic Resonance in Medicine. 2000;44(1):92–100. doi: 10.1002/1522-2594(200007)44:1<92::aid-mrm14>3.0.co;2-m. [DOI] [PubMed] [Google Scholar]
- 14.de Bie HM, Boersma M, Adriaanse S, Veltman DJ, Wink AM, Roosendaal SD, et al. Resting-state networks in awake five- to eight-year old children. Human brain mapping. 2012;33(5):1189–201. doi: 10.1002/hbm.21280. Epub 2011/04/27. [DOI] [PMC free article] [PubMed] [Google Scholar]
- 15.Karunanayaka P, Schmithorst VJ, Vannest J, Szaflarski JP, Plante E, Holland SK. A group independent component analysis of covert verb generation in children: a functional magnetic resonance imaging study. Neuroimage. 2010;51(1):472–87. doi: 10.1016/j.neuroimage.2009.12.108. Epub 2010/01/09. [DOI] [PMC free article] [PubMed] [Google Scholar]
- 16.Rubia K. Functional brain imaging across development. European child & adolescent psychiatry. 2012 doi: 10.1007/s00787-012-0291-8. Epub 2012/06/26. [DOI] [PMC free article] [PubMed] [Google Scholar]
- 17.Schmithorst VJ, Holland SK, Plante E. Cognitive modules utilized for narrative comprehension in children: a functional magnetic resonance imaging study. Neuroimage. 2006;29(1):254–66. doi: 10.1016/j.neuroimage.2005.07.020. [DOI] [PMC free article] [PubMed] [Google Scholar]
- 18.Schmithorst VJ, Holland SK, Plante E. Object identification and lexical/semantic access in children: a functional magnetic resonance imaging study of word-picture matching. Human brain mapping. 2007;28(10):1060–74. doi: 10.1002/hbm.20328. Epub 2006/11/30. [DOI] [PMC free article] [PubMed] [Google Scholar]
- 19.Gonzalez-Castillo J, Roopchansingh V, Bandettini PA, Bodurka J. Physiological noise effects on the flip angle selection in BOLD fMRI. Neuroimage. 2011;54(4):2764–78. doi: 10.1016/j.neuroimage.2010.11.020. Epub 2010/11/16. [DOI] [PMC free article] [PubMed] [Google Scholar]
- 20.Wang J, Alsop DC, Li L, Listerud J, Gonzalez-At JB, Schnall MD, et al. Comparison of quantitative perfusion imaging using arterial spin labeling at 1.5 and 4.0 Tesla. Magn Reson Med. 2002;48(2):242–54. doi: 10.1002/mrm.10211. Epub 2002/09/05. [DOI] [PubMed] [Google Scholar]
- 21.Gonzalez-At JB, Alsop DC, Detre JA. Cerebral perfusion and arterial transit time changes during task activation determined with continuous arterial spin labeling. Magn Reson Med. 2000;43(5):739–46. doi: 10.1002/(sici)1522-2594(200005)43:5<739::aid-mrm17>3.0.co;2-2. Epub 2000/05/09. [DOI] [PubMed] [Google Scholar]
- 22.Lu H, Clingman C, Golay X, van Zijl PCM. Determining the longitudinal relaxation time (T1) of blood at 3.0 Tesla. Magnetic Resonance in Medicine. 2004;52(3):679–82. doi: 10.1002/mrm.20178. [DOI] [PubMed] [Google Scholar]
- 23.Wang J, Alsop DC, Song HK, Maldjian JA, Tang K, Salvucci AE, et al. Arterial transit time imaging with flow encoding arterial spin tagging (FEAST) Magn Reson Med. 2003;50(3):599–607. doi: 10.1002/mrm.10559. Epub 2003/08/27. [DOI] [PubMed] [Google Scholar]
- 24.Yoshiura T, Hiwatashi A, Yamashita K, Ohyagi Y, Monji A, Takayama Y, et al. Simultaneous measurement of arterial transit time, arterial blood volume, and cerebral blood flow using arterial spin-labeling in patients with Alzheimer disease. AJNR American journal of neuroradiology. 2009;30(7):1388–93. doi: 10.3174/ajnr.A1562. Epub 2009/04/04. [DOI] [PMC free article] [PubMed] [Google Scholar]
- 25.Krüger G, Glover GH. Physiological noise in oxygenation-sensitive magnetic resonance imaging. Magnetic Resonance in Medicine. 2001;46(4):631–7. doi: 10.1002/mrm.1240. [DOI] [PubMed] [Google Scholar]
- 26.Glover GH, Li TQ, Ress D. Image-based method for retrospective correction of physiological motion effects in fMRI: RETROICOR. Magnetic resonance in medicine: official journal of the Society of Magnetic Resonance in Medicine/Society of Magnetic Resonance in Medicine. 2000;44(1):162–7. doi: 10.1002/1522-2594(200007)44:1<162::aid-mrm23>3.0.co;2-e. Epub 2000/07/14. [DOI] [PubMed] [Google Scholar]
- 27.Dinov I, Lozev K, Petrosyan P, Liu Z, Eggert P, Pierce J, et al. Neuroimaging study designs, computational analyses and data provenance using the LONI pipeline. PLoS One. 2010;5(9) doi: 10.1371/journal.pone.0013070. Epub 2010/10/12. [DOI] [PMC free article] [PubMed] [Google Scholar]
- 28.Dinov ID, Van Horn JD, Lozev KM, Magsipoc R, Petrosyan P, Liu Z, et al. Efficient, Distributed and Interactive Neuroimaging Data Analysis Using the LONI Pipeline. Front Neuroinform. 2009;3:22. doi: 10.3389/neuro.11.022.2009. Epub 2009/08/04. [DOI] [PMC free article] [PubMed] [Google Scholar]
- 29.Thevenaz P, Ruttimann UE, Unser M. A pyramid approach to subpixel registration based on intensity. IEEE transactions on image processing: a publication of the IEEE Signal Processing Society. 1998;7(1):27–41. doi: 10.1109/83.650848. Epub 2008/02/13. [DOI] [PubMed] [Google Scholar]
- 30.Szaflarski JP, Schmithorst VJ, Altaye M, Byars AW, Ret J, Plante E, et al. A longitudinal functional magnetic resonance imaging study of language development in children 5 to 11 years old. Ann Neurol. 2006;59(5):796–807. doi: 10.1002/ana.20817. [DOI] [PMC free article] [PubMed] [Google Scholar]
- 31.Wilke M, Holland SK, Altaye M, Gaser C. Template-O-Matic: a toolbox for creating customized pediatric templates. Neuroimage. 2008;41(3):903–13. doi: 10.1016/j.neuroimage.2008.02.056. Epub 2008/04/22. [DOI] [PubMed] [Google Scholar]
- 32.Wong EC, Buxton RB, Frank LR. Implementation of quantitative perfusion imaging techniques for functional brain mapping using pulsed arterial spin labeling. NMR in biomedicine. 1997;10(4–5):237–49. doi: 10.1002/(sici)1099-1492(199706/08)10:4/5<237::aid-nbm475>3.0.co;2-x. Epub 1997/06/01. [DOI] [PubMed] [Google Scholar]
- 33.Liu TT, Wong EC. A signal processing model for arterial spin labeling functional MRI. Neuroimage. 2005;24(1):207–15. doi: 10.1016/j.neuroimage.2004.09.047. Epub 2004/12/14. [DOI] [PubMed] [Google Scholar]
- 34.Triantafyllou C, Polimeni JR, Wald LL. Physiological noise and signal-to-noise ratio in fMRI with multi-channel array coils. Neuroimage. 2011;55(2):597–606. doi: 10.1016/j.neuroimage.2010.11.084. Epub 2010/12/21. [DOI] [PMC free article] [PubMed] [Google Scholar]
- 35.Gilbert G. Measurement of signal-to-noise ratios in sum-of-squares MR images. Journal of Magnetic Resonance Imaging. 2007;26(6):1678. doi: 10.1002/jmri.21171. [DOI] [PubMed] [Google Scholar]
- 36.Dietrich O, Raya JG, Reeder SB, Reiser MF, Schoenberg SO. Measurement of signal-to-noise ratios in MR images: Influence of multichannel coils, parallel imaging, and reconstruction filters. Journal of Magnetic Resonance Imaging. 2007;26(2):375–85. doi: 10.1002/jmri.20969. [DOI] [PubMed] [Google Scholar]
- 37.Jenkinson M, Bannister P, Brady M, Smith S. Improved optimization for the robust and accurate linear registration and motion correction of brain images. Neuroimage. 2002;17(2):825–41. doi: 10.1016/s1053-8119(02)91132-8. Epub 2002/10/16. [DOI] [PubMed] [Google Scholar]
- 38.Mumford JA, Hernandez-Garcia L, Lee GR, Nichols TE. Estimation efficiency and statistical power in arterial spin labeling fMRI. Neuroimage. 2006;33(1):103–14. doi: 10.1016/j.neuroimage.2006.05.040. Epub 2006/07/25. [DOI] [PMC free article] [PubMed] [Google Scholar]
- 39.Woolrich MW, Ripley BD, Brady M, Smith SM. Temporal autocorrelation in univariate linear modeling of FMRI data. Neuroimage. 2001;14(6):1370–86. doi: 10.1006/nimg.2001.0931. Epub 2001/11/15. [DOI] [PubMed] [Google Scholar]
- 40.Avants BB, Epstein CL, Grossman M, Gee JC. Symmetric diffeomorphic image registration with cross-correlation: evaluating automated labeling of elderly and neurodegenerative brain. Medical image analysis. 2008;12(1):26–41. doi: 10.1016/j.media.2007.06.004. Epub 2007/07/31. [DOI] [PMC free article] [PubMed] [Google Scholar]
- 41.Vannest JJ, Karunanayaka PR, Altaye M, Schmithorst VJ, Plante EM, Eaton KJ, et al. Comparison of fMRI data from passive listening and active-response story processing tasks in children. Journal of magnetic resonance imaging: JMRI. 2009;29(4):971–6. doi: 10.1002/jmri.21694. Epub 2009/03/24. [DOI] [PMC free article] [PubMed] [Google Scholar]
- 42.Wu WC, Jain V, Li C, Giannetta M, Hurt H, Wehrli FW, et al. In vivo venous blood T1 measurement using inversion recovery true-FISP in children and adults. Magnetic resonance in medicine: official journal of the Society of Magnetic Resonance in Medicine/Society of Magnetic Resonance in Medicine. 2010;64(4):1140–7. doi: 10.1002/mrm.22484. Epub 2010/06/22. [DOI] [PMC free article] [PubMed] [Google Scholar]
- 43.Wansapura JP, Holland SK, Dunn RS, Ball WS., Jr NMR relaxation times in the human brain at 3.0 tesla. Journal of magnetic resonance imaging: JMRI. 1999;9(4):531–8. doi: 10.1002/(sici)1522-2586(199904)9:4<531::aid-jmri4>3.0.co;2-l. Epub 1999/05/08. [DOI] [PubMed] [Google Scholar]
- 44.Gao JH, Liu HL. Inflow effects on functional MRI. Neuroimage. 2012;62(2):1035–9. doi: 10.1016/j.neuroimage.2011.09.088. Epub 2011/10/25. [DOI] [PubMed] [Google Scholar]
- 45.Liu HL, Wei PS, Wai YY, Kuan WC, Huang CM, Wu CW, et al. Inflow effects on hemodynamic responses characterized by event-related fMRI using gradient-echo EPI sequences. Medical physics. 2008;35(10):4300–7. doi: 10.1118/1.2975141. Epub 2008/11/04. [DOI] [PubMed] [Google Scholar]
- 46.Fernandez-Seara MA, Wang Z, Wang J, Rao HY, Guenther M, Feinberg DA, et al. Continuous arterial spin labeling perfusion measurements using single shot 3D GRASE at 3 T. Magnetic resonance in medicine: official journal of the Society of Magnetic Resonance in Medicine/Society of Magnetic Resonance in Medicine. 2005;54(5):1241–7. doi: 10.1002/mrm.20674. Epub 2005/09/30. [DOI] [PubMed] [Google Scholar]
- 47.Nielsen JF, Hernandez-Garcia L. Functional perfusion imaging using pseudocontinuous arterial spin labeling with low-flip-angle segmented 3D spiral readouts. Magnetic resonance in medicine: official journal of the Society of Magnetic Resonance in Medicine/Society of Magnetic Resonance in Medicine. 2012 doi: 10.1002/mrm.24261. Epub 2012/04/11. [DOI] [PubMed] [Google Scholar]
- 48.Golay X, Pruessmann KP, Weiger M, Crelier GR, Folkers PJ, Kollias SS, et al. PRESTO-SENSE: an ultrafast whole-brain fMRI technique. Magnetic resonance in medicine: official journal of the Society of Magnetic Resonance in Medicine/Society of Magnetic Resonance in Medicine. 2000;43(6):779–86. doi: 10.1002/1522-2594(200006)43:6<779::aid-mrm1>3.0.co;2-4. Epub 2000/06/22. [DOI] [PubMed] [Google Scholar]
- 49.van Gelderen P, Duyn JH, Ramsey NF, Liu G, Moonen CT. The PRESTO technique for fMRI. Neuroimage. 2012;62(2):676–81. doi: 10.1016/j.neuroimage.2012.01.017. Epub 2012/01/17. [DOI] [PMC free article] [PubMed] [Google Scholar]
- 50.McGonigle DJ, Howseman AM, Athwal BS, Friston KJ, Frackowiak RS, Holmes AP. Variability in fMRI: an examination of intersession differences. Neuroimage. 2000;11(6 Pt 1):708–34. doi: 10.1006/nimg.2000.0562. Epub 2000/06/22. [DOI] [PubMed] [Google Scholar]
- 51.Smith AM, Lewis BK, Ruttimann UE, Ye FQ, Sinnwell TM, Yang Y, et al. Investigation of low frequency drift in fMRI signal. Neuroimage. 1999;9(5):526–33. doi: 10.1006/nimg.1999.0435. Epub 1999/05/18. [DOI] [PubMed] [Google Scholar]
- 52.Buschkuehl M, Jaeggi SM, Jonides J. Neuronal effects following working memory training. Developmental cognitive neuroscience. 2012;2(Suppl 1):S167–79. doi: 10.1016/j.dcn.2011.10.001. Epub 2012/06/15. [DOI] [PMC free article] [PubMed] [Google Scholar]
- 53.Jaeggi SM, Buschkuehl M, Jonides J, Shah P. Short- and long-term benefits of cognitive training. Proceedings of the National Academy of Sciences of the United States of America. 2011;108(25):10081–6. doi: 10.1073/pnas.1103228108. Epub 2011/06/15. [DOI] [PMC free article] [PubMed] [Google Scholar]