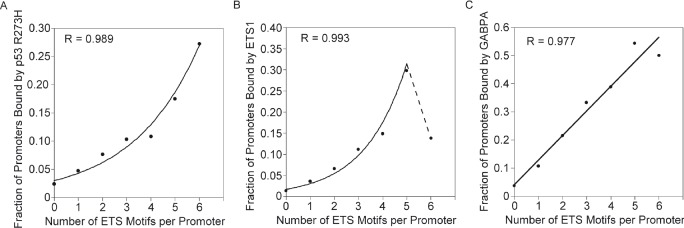
Figure 2. p53 R273H, ETS1 and GABPA, exhibit increased binding probability for promoters with higher number of ETS motifs.

A. Increase in probability of binding for p53 R273H versus an increase in the number of ETS motifs per promoter is shown in this plot. An exponential curve was the best fit for the data, with correlation coefficient, R, shown. B. Increase in probability of binding for ETS1 versus an increase in the number of ETS motifs per promoter is shown in this plot. An exponential curve was the best fit for the data, with correlation coefficient, R, shown for the first 6 points, with additional discontinuous point connected by a dotted line. C. Increase in probability of binding for GABPA versus an increase in the number of ETS motifs per promoter is shown in this plot. A linear curve was the best fit for the data, with correlation coefficient, R, shown. Standard error calculations for this data were not possible because the analysis is based on the intersection between three or two replicates and not on the average of signal.
