Abstract
Background/Aims
Programmed death-1 (PD-1) expression was investigated in CD4+ and CD8+ T cells from hepatitis B virus (HBV)-infected patients at the chronic hepatitis B (CHB) infection, liver cirrhosis (LC), and hepatocellular carcinoma (HCC) stages.
Methods
PD-1 expression in circulating CD4+ and CD8+ T cells was detected by flow cytometry. The correlations between PD-1 expression and HBV viral load, alanine aminotransaminase (ALT) levels and aspartate aminotransferase (AST) levels were analyzed using GraphPad Prism 5.0.
Results
PD-1 expression in CD4+ and CD8+ T cells was significantly increased in both the CHB group and advanced-stage group (LC plus HCC). In the CHB group, PD-1 expression in both CD4+ and CD8+ T cells was positively correlated with the HBV viral load, ALT, and AST levels. However, in the LC plus HCC group, significant correlations between PD-1 expression and the clinical parameters were nearly absent.
Conclusions
PD-1 expression in peripheral CD4+ and CD8+ T cells is dynamic, changes with HBV infection progression, and is related to HBV viral load and liver function, especially in CHB. PD-1 expression could be utilized as a potential clinical indicator to determine the extent of virus replication and liver injury.
Keywords: Programmed death-1; Hepatitis B virus; Hepatitis B, chronic; Liver cirrhosis; Carcinoma, hepatocellular
INTRODUCTION
Mounting data indicated that persistent antigen stimulation during chronic viral infections and tumor development led to T cell exhaustion, a state of dysfunction in which T cells got a progressive loss of effector function.1-5 It was suggested that reversing T cell exhaustion could restore effective immune response, and subsequently control tumor progress and virus amplification.6-10 Exhausted T cells are characterized by expressing multiple inhibitory receptors which dedicated complex layers of negative regulation.11-13 Programmed death-1 (PD-1), T lymphocyte antigen 4 (CTLA-4), and B and T lymphocyte attenuator (BTLA), currently constituting the immunoglobulin superfamily of coinhibitory molecules, play a prominent role in effectively and moderately regulating immune response in collaboration with costimulatory molecules as well as T cell receptor-antigen signals.14-18 However, overexpression of these co-inhibitory receptors may drive excessive inhibitory signals and contribute to T cell exhaustion.19-22 It has demonstrated that these coinhibitory receptors were up-regulated in patients along with chronic viral infections and associated with clinical characteristics.23-25 Some reports further revealed that blocking these coinhibitory molecules could temper the inhibitory signals, partially restore T cell function, and correspondingly relieve virus load and other clinical indicators.26-29 Thereby, blockade of inhibitory molecules could be adopted as a potential therapeutic approach in chronic viral infections.30-32
PD-1 (CD279), of which the intracellular domain contains two tyrosine-based signaling motifs, immunoreceptor tyrosine-based inhibitory motif and immunoreceptor tyrosine-based switch motif, can recruit src homology domain 2-containing protein tyrosine phosphatase-1 (SHP-1) and SHP-2 and subsequently deliver negative signals to modulate activation and proliferation of T cells and production of cytokines dependent on interacting with its ligand PD-L (PD-L1 or PD-L2).33,34 It was identified that PD-1 overexpression not only accounted for exhaustion of T cells of patients infected with hepatitis B virus (HBV), hepatitis C virus (HCV) and human immunodeficiency virus (HIV),35-37 but also played an important role in inhibiting the function of antigen-specific CD8+ T cells in tumor pathogenesis.38 Although a few of reports respectively described that expression levels of PD-1 were elevated on CD4+ or CD8+ T cells of CHB patients or CD8+ T cells of hepatocellular carcinoma (HCC) patients and to some extent related with HBV amplification or liver function, a systematic investigation of PD-1 expression pattern on T cells remains to be further elucidated during HBV infection progress from CHB to liver cirrhosis (LC), and then to HCC. Moreover, to comprehend such variation of PD-1 expression on T cells in the course of HBV infection is to benefit for not only developing valuable clinical indicator, but also estimating the appropriate phases for PD-1 blockade in the prospective therapy. For these reasons, we examined the PD-1 expression on peripheral CD4+ and CD8+ T cells from patients at the stage of CHB, LC, and HCC and analyzed its association with clinical baseline characteristics. Our results suggested that PD-1 expression on T cells presented dynamic change along with HBV infection progressing and its variation was correlated with HBV virus load as well as liver function.
MATERIALS AND METHODS
1. Study participants
The recruited samples include healthy donors (n=20) and patients with CHB (n=34), LC (n=18), and HCC (n=16). All patients were not coinfected with HCV, hepatitis D virus (HDV), HIV, acute hepatitis B infection and excluded from other causes of liver disease. Healthy donors were also negative for HBV, HCV, HDV, and HIV-1 infection and other diseases. CHB was defined by persistent or elevation of alanine aminotransaminase (ALT) levels for 6 months. The diagnosis of LC was dependent on computed tomography (CT) acquiring images and laboratory findings. HCC was diagnosed by histology, α-fetoprotein levels, and CT imaging findings. The study was approved by the ethical committee of the Affiliated Infectious Hospital of Soochow University and informed consent forms were signed by all participants.
2. Serological assays for HBV markers, viral load, and basic clinical features
HBV serological markers, including hepatitis B surface antigen, hepatitis B surface antibody, hepatitis B e antigen (HBeAg), and antihepatitis B e antibody, were detected using the assay kits (Abbott Ireland, Diagnostics Division, Sligo, Ireland). The HBV viral load was determined with HBV LC PCR Kit (Shanghai Shenyou Technology Co., Ltd., Shangahi, China). The routine biochemical assays, including liver function, albumin (ALB), total bilirubin, and so on were also detected.
3. Flow cytometric analysis
Monoclonal antibodies labeled with fluorochrome, CD3-ACP, CD4-PerCP, CD8-PerCP, and PD-1-PE were purchased from BD Pharmingen (San Diego, CA, USA). For each test, 50 µL fresh heparinized whole blood of patients or healthy donors was incubated with indicated antibodies (10 µL) for 15 minutes, then lysed with FACS™ lysing solution (BD Biosciences, San Jose, CA, USA), subsequently washed with phosphate buffered saline, fixed and eventually detected by BD FACSAria with DB FACSDiva software supporting. Data were analyzed using FlowJo (Tree Star Inc., San Carlos, CA, USA).
4. Statistical analysis
The data were analyzed with GraphPad Prism 5.0 software (GraphPad, San Diego, CA, USA), and summarized and presented as mean±standard error of the mean (SEM). For comparisons of the collected data, nonparametric test (Mann-Whitney U test) and the chi-square test were performed and two-tailed p<0.05 was considered statistically significant. Nonparametric correlation test (spearman) was applied for analyzing the correlation between PD-1 expression and virus load, ALT, or aspartate aminotransferase (AST) levels. The bar in every group in figures represents the mean±SEM.
RESULTS
1. Clinical baseline characteristics of study populations
The recruited participants in this study were classified into three groups: healthy controls (HC; n=20), CHB (n=34), and LC plus HCC (n=34). Table 1 demonstrates age, gender, HBeAg serostatus, serum HBV DNA concentrations, liver function, ALB, and total bilirubin. On the basis of Child-Pugh classification,39 eighty LC patients were made up of nine cases at class A, three cases at class B, and six cases at class C. According to the Barcelona Clinic Liver Cancer staging classification,40 six patients at stage A, three patients at stage B, and seven patients at stage C consisted of HCC group.
Table 1.
Clinical Characteristics of the Study Groups
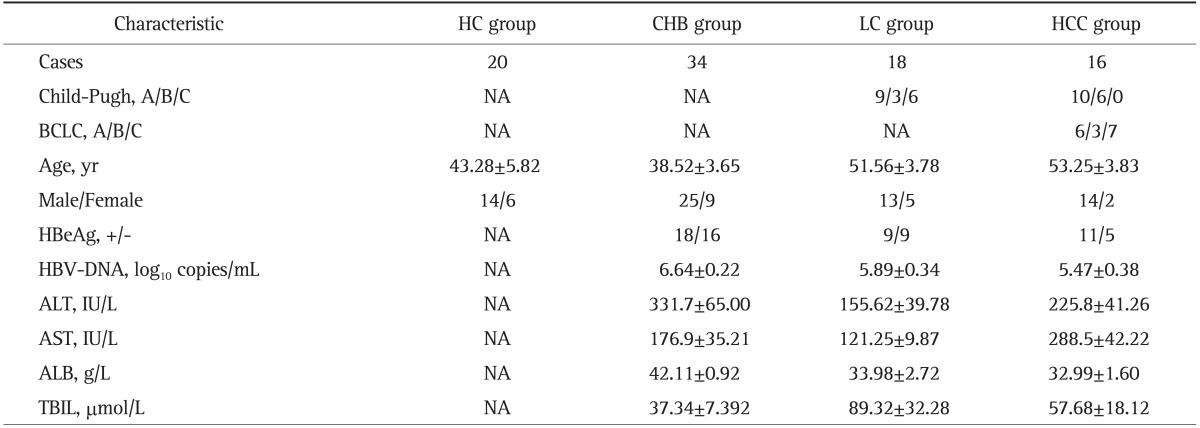
Data are presented as number or mean±SEM. The significance of differences (p-value) in the indicated group is shown.
HC, healthy control; CHB, chronic hepatitis B; LC, liver cirrhosis; HCC, hepatocellular carcinoma; NA, not applicable; BCLC, Barcelona Clinic Liver Cancer; HBeAg, hepatitis B e antigen; HBV, hepatitis B virus; ALT, alanine aminotransaminase; AST, aspartate aminotransferase; ALB, albumin; TBIL, total bilirubin.
2. Investigation of PD-1 expression on peripheral CD4+ and CD8+ T cells from HBV-infected patients
In order to elucidate PD-1 expression pattern on both CD4+ and CD8+ T cells with the disease progressing, CHB, LC, and HCC patients who represented different stages of HBV infection were enrolled and PD-1 expression was investigated by using flow cytometric analysis.
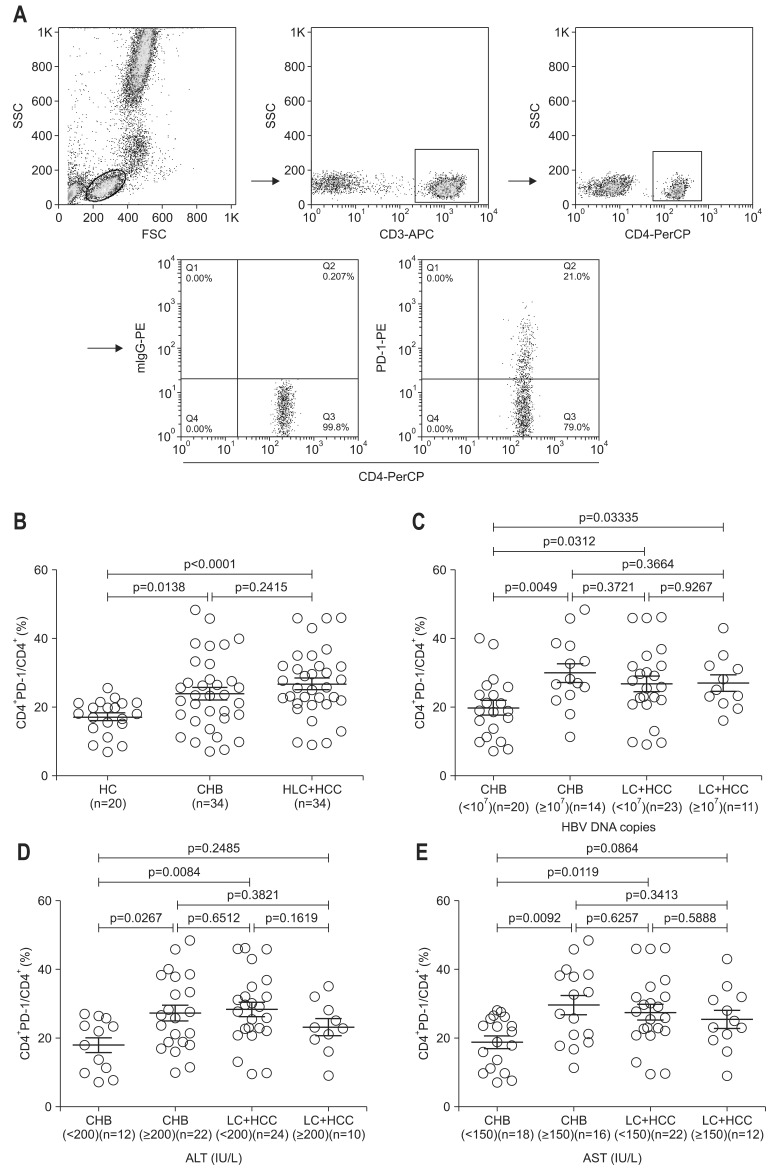
Gating strategies for CD4+ T cell subsets were shown in Fig. 1A. When the study patients were classified into two groups, chronic infection (CHB) and serious progress of disease (LC plus HCC), the results illustrated that compared with HC, the percentage of circulating CD4+ PD-1+ T cells was significantly increased in both of CHB and LC plus HCC, while there was no significant difference between the two patient groups (Fig. 1B). Surprisingly, it was further revealed that when patients were divided into subgroups according to the levels of clinical parameters such as serum HBV DNA levels, ALT and AST, PD-1 expression on CD4+ T cells varied among these sub-groups. The percentages of CD4+ PD-1+ T subsets in CHB patients with low serum HBV load, low ALT level or low AST level were correspondingly lower than those CHB with high serum HBV load, high ALT level or high AST level respectively (Fig. 1C-E). However, there were no significant differences of CD4+ PD-1+ T subsets between LC plus HCC subgroups with low serum HBV load, low ALT level or low AST level, and LC plus HCC subgroups with high serum HBV load, high ALT level or high AST level respectively (Fig. 1C-E). When compared with CHB and LC plus HCC, the significant differences of CD4+ PD-1+ T subsets were observed in subgroups with low serum HBV DNA, low ALT or low AST respectively.
Fig. 1.
Gating strategy and expression profiles of programmed death-1 (PD-1) in peripheral CD4+ T cells of chronic hepatitis B (CHB) virus, liver cirrhosis (LC), and hepatocellular carcinoma (HCC) patients. (A) The gating strategies and representative results of PD-1 expression in CD4+ T cells are shown. (B) Statistical results for PD-1 expression in circulating CD4+ T cells from healthy control (HC), CHB, and LC plus HCC are shown. (C, D, E) The percentages of CD4+ PD-1+ T cells in CHB and LC plus HCC patients are organized according to hepatitis B virus (HBV) DNA load and alanine aminotransaminase (ALT) and aspartate aminotransferase (AST) levels, respectively, as indicated in the figures.
SSC, side scatter; FSC, forward scatter; LC, liver cirrhosis.
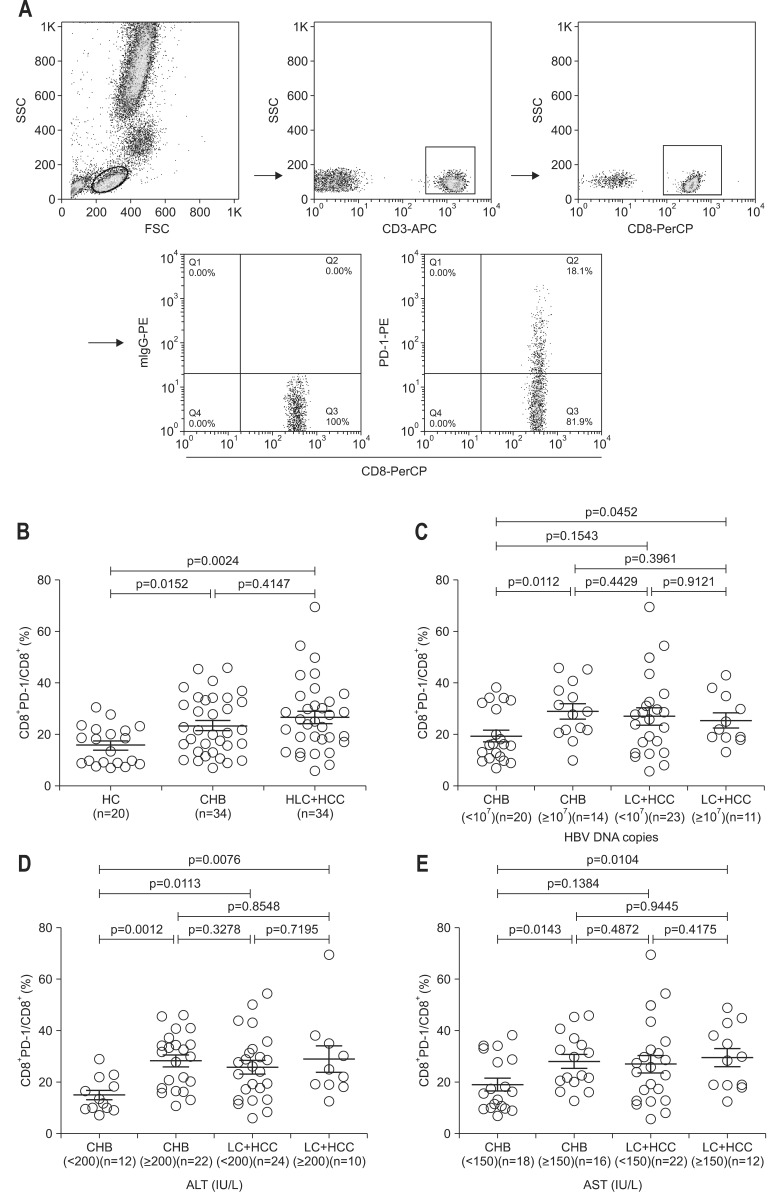
The similar results were showed in CD8+ PD-1+ T subsets. The similar gating strategies were also adopted for detecting CD8+ T cell subsets (Fig. 2A). Compared with HC, the percentage of circulating CD8+ PD-1+ T cells was also significantly increased in both CHB group and LC plus HCC group, while no significant difference was found between the two patient groups (Fig. 2B). The percentage of CD8+ PD-1+ T subsets in CHB patients with low serum HBV load, low ALT level or low AST level was accordingly lower than those CHB with high serum HBV load, high ALT level or high AST level respectively (Fig. 2C-E). However, there were no significant differences of CD8+ PD-1+ T subsets between LC plus HCC subgroups with low serum HBV load, low ALT level or low AST level, and LC plus HCC subgroups with high serum HBV load, high ALT level or high AST level respectively (Fig. 2C-E). When compared with CHB and LC plus HCC, the significant difference of CD8+ PD-1+ T subsets was observed in subgroup with low ALT only.
Fig. 2.
Gating strategy and expression profiles of programmed death-1 (PD-1) in peripheral CD8+ T cells of chronic hepatitis B (CHB) virus, liver cirrhosis (LC), and hepatocellular carcinoma (HCC) patients. (A) The gating strategies and representative results of PD-1 expression in CD8+ T cells are shown. (B) Statistical results for PD-1 expression in circulating CD8+ T cells from healthy control (HC), CHB, and LC plus HCC are shown. (C, D, E) The percentages of CD8+ PD-1+ T cells in CHB and LC plus HCC patients are organized according to the hepatitis B virus (HBV) DNA load and alanine aminotransaminase (ALT) and aspartate aminotransferase (AST) levels, respectively, as indicated in the figures.
SSC, side scatter; FSC, forward scatter; LC, liver cirrhosis.
3. Analysis of correlations between PD-1 expression on circulating CD4+ and CD8+ T cells from HBV-infected patients and clinic indicators
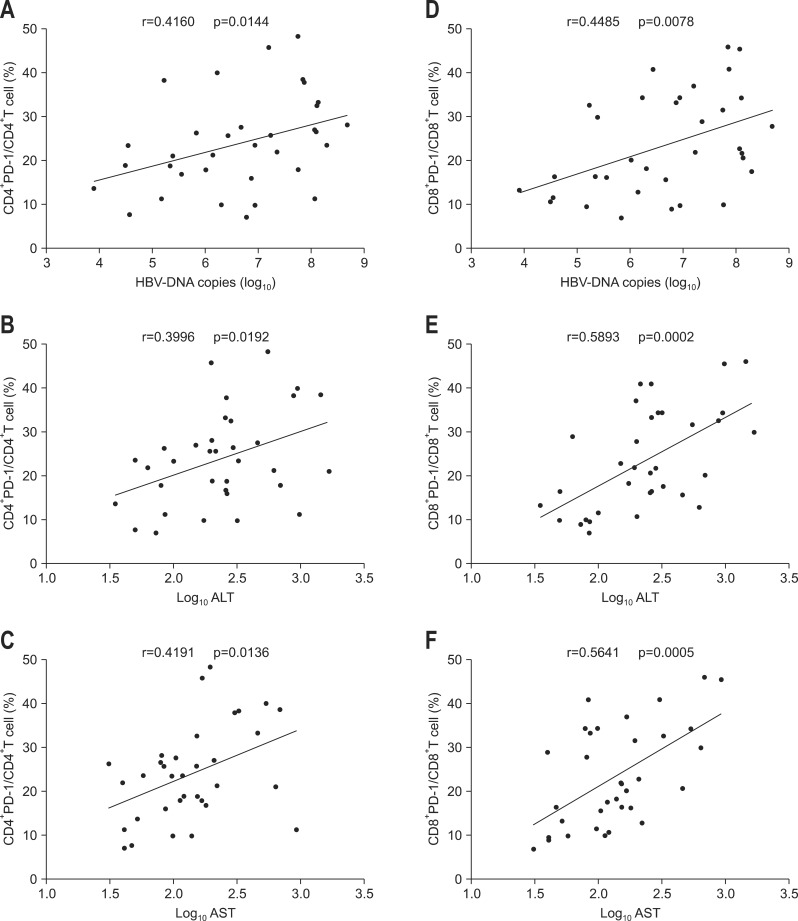
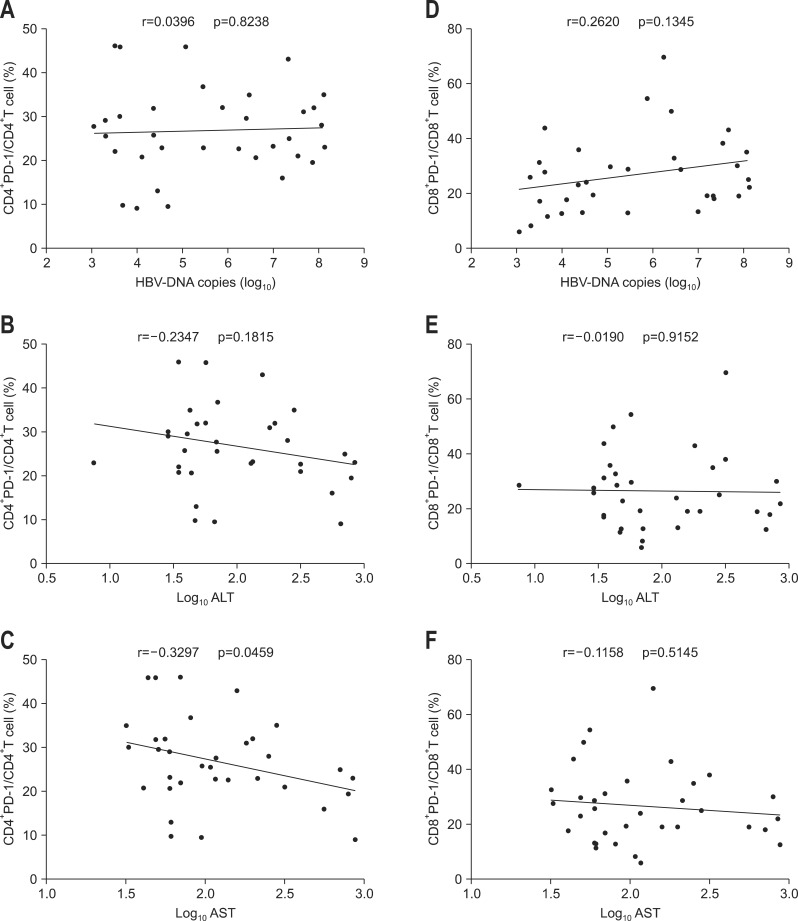
Correlations between PD-1 expression on CD4+ and CD8+ T cells from CHB, LC plus HCC subjects and serum HBV viral load, ALT or AST level were further analyzed respectively. The results showed that PD-1 expression on CD4+ and CD8+ T cells of CHB patients was all positively correlated with serum HBV viral load, ALT, and AST levels (Fig. 3). However, in LC plus HCC group, except that PD-1 expression on CD4+ T cells was surprisingly found to be negatively correlated with AST, no other correlations were discovered between PD-1 expression and those clinical parameters (Fig. 4).
Fig. 3.
Analysis of the correlation between programmed death-1 (PD-1) expression in CD4+ and CD8+ T cells of chronic hepatitis B virus patients and hepatitis B virus (HBV) DNA load or alanine aminotransaminase (ALT) or aspartate aminotransferase (AST) levels. (A, B, C) Correlations between PD-1 expression by CD4+ T cells and HBV DNA load or ALT or AST levels. (D, E, F) Correlations between PD-1 expression in CD8+ T cells and HBV DNA load and ALT or AST levels.
Fig. 4.
Analysis of the correlation between the expression of programmed death-1 (PD-1) in CD4+ and CD8+ T cells of liver cirrhosis and hepatocellular carcinoma patients and hepatitis B virus (HBV) DNA load or alanine aminotransaminase (ALT) or aspartate aminotransferase (AST) levels. (A, B, C) Correlations between PD-1 expression in CD4+ T cells and HBV DNA load or ALT or AST levels. (D, E, F) Correlations between PD-1 expression in CD8+ T cells and HBV DNA load or ALT or AST levels.
DISCUSSION
As an important axis of coinhibitory receptor/ligand, PD-1/PD-L, together with CTLA-4/B7 and BTLA/HVEM,41 exerts considerable effect on keeping T cell from excessive activation and regulating T cell tolerance. In the course of normal immune response, PD-1 is up-regulated following T cell activation, then interacts with PD-L1 and PD-L2 to deliver negative signals, and eventually leads to the apoptosis of activated T lymphocytes.34 In our study as well as other reports,25,42-44 it was demonstrated that the higher percentage of CD4+ PD-1+ and CD8+ PD-1+ T persistently existed in the patients with chronic infections, suggesting that PD-1 overexpression contributes to T cell exhaustion by providing negative signals.
In the present study, it was further clarified that PD-1 expression on T cells showed dynamic change in different stages of HBV infection. Although it was up-regulated at the stages of both chronic infection and deterioration with increasing tendency compared with HC, PD-1 expression on CD4+ and CD8+ T cells did not present continuous up-regulation significantly along with disease progression, suggesting that not only PD-1 overexpression possibly exerts its role in the whole course of disease development, but also its up-regulation pattern is influenced to some extent by the disease progress.
PD-1 expressions on both CD4+ and CD8+ T cells of patients with low serum HBV DNA load, low ALT, or low AST level were correspondingly lower than those of patients with high levels of these clinical parameters in CHB stage, but not in LC plus HCC stage. Further analysis demonstrated that PD-1 expression present positively correlations with serum HBV DNA load, AST and ALT levels in CHB stage but not in LC plus HCC stage. These data indicate that during HBV chronic infection, the increasing percentages of CD4+ PD-1+ and CD8+ PD-1+ T depend on the stimulation of virus antigens and associated with the extent of liver cell injury in CHB stage. The results accorded with some previous reports in which the dynamic variations of PD-1 expression on CD4+ or CD8+ T cells were separately revealed in CHB patients.25,42 In advanced stage of HBV infection such as LC or HCC, these findings were disappeared. It suggests that high viral antigenic stimulation or severe hepatocyte injury are not significant factors any more for PD-1 expression on CD4+ or CD8+ T cells in advanced fibrosis stage. When chronic infection develops into serious deterioration, characterized by LC and HCC, the percentages of CD4+ PD-1+ and CD8+ PD-1+ T were increased slightly without significance. Also, at this stage, both of the frequencies of CD4+ PD-1+ and CD8+ PD-1+ T cells had no significant differences between sub-groups with different clinical parameters and were not found to correlate with serum HBV DNA load, which accorded with the results reported by Zeng et al.45
Interestingly, according to subgroup analysis, significant differences of PD-1 expression on CD4+ T cells could be found between CHB and LC plus HCC with low HBV DNA load, low ALT, or low AST respectively, but not between those subgroups with high levels of clinical parameters. These findings suggest that high serum HBV DNA, high ALT, and high AST conditions debilitate the difference of PD-1 expression on CD4+ T cells between CHB and LC plus HCC by increasing of PD-1 expression on CD4+ T cells in CHB.
In summary, our study further systematically and fully revealed PD-1 expression pattern on CD4+ and CD8+ T cells and its association with clinical baseline characteristics in the whole course of HBV infection including CHB, LC, and HCC though it enrolled a small population and can only partially reflect PD-1 expression on T cells in HBV infection progressing and its correlation with the clinical parameters such as serum HBV DNA, ALT, and AST. The exposure of dynamic change of PD-1 expression and its correlations with clinical parameters not only makes PD-1 itself another valuable clinical parameter, but also provides an important theoretic base for PD-1/PD-L1 blockade in chronic HBV infection.
ACKNOWLEDGEMENTS
The research was supported by the Foundation of Science and Technology Project of Suzhou City (SYS201155, SYS201101, and SS201246) and the Open Foundation of Jiang Su Province for Promoting the Development of Health and Medicine Based on Science and Education (KF200974).
Footnotes
No potential conflict of interest relevant to this article was reported.
References
- 1.Wherry EJ. T cell exhaustion. Nat Immunol. 2011;12:492–499. doi: 10.1038/ni.2035. [DOI] [PubMed] [Google Scholar]
- 2.Mueller SN, Ahmed R. High antigen levels are the cause of T cell exhaustion during chronic viral infection. Proc Natl Acad Sci U S A. 2009;106:8623–8628. doi: 10.1073/pnas.0809818106. [DOI] [PMC free article] [PubMed] [Google Scholar]
- 3.Bucks CM, Norton JA, Boesteanu AC, Mueller YM, Katsikis PD. Chronic antigen stimulation alone is sufficient to drive CD8+ T cell exhaustion. J Immunol. 2009;182:6697–6708. doi: 10.4049/jimmunol.0800997. [DOI] [PMC free article] [PubMed] [Google Scholar]
- 4.Han S, Asoyan A, Rabenstein H, Nakano N, Obst R. Role of antigen persistence and dose for CD4+ T-cell exhaustion and recovery. Proc Natl Acad Sci U S A. 2010;107:20453–20458. doi: 10.1073/pnas.1008437107. [DOI] [PMC free article] [PubMed] [Google Scholar]
- 5.Crespo J, Sun H, Welling TH, Tian Z, Zou W. T cell anergy, exhaustion, senescence, and stemness in the tumor microenvironment. Curr Opin Immunol. 2013;25:214–221. doi: 10.1016/j.coi.2012.12.003. [DOI] [PMC free article] [PubMed] [Google Scholar]
- 6.Barber DL, Wherry EJ, Masopust D, et al. Restoring function in exhausted CD8 T cells during chronic viral infection. Nature. 2006;439:682–687. doi: 10.1038/nature04444. [DOI] [PubMed] [Google Scholar]
- 7.Raghuraman S, Park H, Osburn WO, Winkelstein E, Edlin BR, Rehermann B. Spontaneous clearance of chronic hepatitis C virus infection is associated with appearance of neutralizing antibodies and reversal of T-cell exhaustion. J Infect Dis. 2012;205:763–771. doi: 10.1093/infdis/jir835. [DOI] [PMC free article] [PubMed] [Google Scholar]
- 8.Berinstein NL. Strategies to enhance the therapeutic activity of cancer vaccines: using melanoma as a model. Ann N Y Acad Sci. 2009;1174:107–117. doi: 10.1111/j.1749-6632.2009.04935.x. [DOI] [PubMed] [Google Scholar]
- 9.Fourcade J, Sun Z, Pagliano O, et al. CD8(+) T cells specific for tumor antigens can be rendered dysfunctional by the tumor microenvironment through upregulation of the inhibitory receptors BTLA and PD-1. Cancer Res. 2012;72:887–896. doi: 10.1158/0008-5472.CAN-11-2637. [DOI] [PMC free article] [PubMed] [Google Scholar]
- 10.Nebbia G, Peppa D, Schurich A, et al. Upregulation of the Tim-3/galectin-9 pathway of T cell exhaustion in chronic hepatitis B virus infection. PLoS One. 2012;7:e47648. doi: 10.1371/journal.pone.0047648. [DOI] [PMC free article] [PubMed] [Google Scholar]
- 11.Blackburn SD, Shin H, Haining WN, et al. Coregulation of CD8+ T cell exhaustion by multiple inhibitory receptors during chronic viral infection. Nat Immunol. 2009;10:29–37. doi: 10.1038/ni.1679. [DOI] [PMC free article] [PubMed] [Google Scholar]
- 12.Wherry EJ, Ha SJ, Kaech SM, et al. Molecular signature of CD8+ T cell exhaustion during chronic viral infection. Immunity. 2007;27:670–684. doi: 10.1016/j.immuni.2007.09.006. [DOI] [PubMed] [Google Scholar]
- 13.Yamamoto T, Price DA, Casazza JP, et al. Surface expression patterns of negative regulatory molecules identify determinants of virus-specific CD8+ T-cell exhaustion in HIV infection. Blood. 2011;117:4805–4815. doi: 10.1182/blood-2010-11-317297. [DOI] [PMC free article] [PubMed] [Google Scholar]
- 14.Leibson PJ. The regulation of lymphocyte activation by inhibitory receptors. Curr Opin Immunol. 2004;16:328–336. doi: 10.1016/j.coi.2004.03.006. [DOI] [PubMed] [Google Scholar]
- 15.Fife BT, Bluestone JA. Control of peripheral T-cell tolerance and autoimmunity via the CTLA-4 and PD-1 pathways. Immunol Rev. 2008;224:166–182. doi: 10.1111/j.1600-065X.2008.00662.x. [DOI] [PubMed] [Google Scholar]
- 16.Carreno BM, Collins M. BTLA: a new inhibitory receptor with a B7-like ligand. Trends Immunol. 2003;24:524–527. doi: 10.1016/j.it.2003.08.005. [DOI] [PubMed] [Google Scholar]
- 17.Keir ME, Butte MJ, Freeman GJ, Sharpe AH. PD-1 and its ligands in tolerance and immunity. Annu Rev Immunol. 2008;26:677–704. doi: 10.1146/annurev.immunol.26.021607.090331. [DOI] [PMC free article] [PubMed] [Google Scholar]
- 18.Alegre ML, Frauwirth KA, Thompson CB. T-cell regulation by CD28 and CTLA-4. Nat Rev Immunol. 2001;1:220–228. doi: 10.1038/35105024. [DOI] [PubMed] [Google Scholar]
- 19.Schurich A, Khanna P, Lopes AR, et al. Role of the coinhibitory receptor cytotoxic T lymphocyte antigen-4 on apoptosis-Prone CD8 T cells in persistent hepatitis B virus infection. Hepatology. 2011;53:1494–1503. doi: 10.1002/hep.24249. [DOI] [PubMed] [Google Scholar]
- 20.Day CL, Kaufmann DE, Kiepiela P, et al. PD-1 expression on HIV-specific T cells is associated with T-cell exhaustion and disease progression. Nature. 2006;443:350–354. doi: 10.1038/nature05115. [DOI] [PubMed] [Google Scholar]
- 21.Blank C, Mackensen A. Contribution of the PD-L1/PD-1 pathway to T-cell exhaustion: an update on implications for chronic infections and tumor evasion. Cancer Immunol Immunother. 2007;56:739–745. doi: 10.1007/s00262-006-0272-1. [DOI] [PMC free article] [PubMed] [Google Scholar]
- 22.Haymaker C, Wu R, Bernatchez C, Radvanyi L. PD-1 and BTLA and CD8(+) T-cell "exhaustion" in cancer: "Exercising" an alternative viewpoint. Oncoimmunology. 2012;1:735–738. doi: 10.4161/onci.20823. [DOI] [PMC free article] [PubMed] [Google Scholar]
- 23.Peng G, Luo B, Li J, et al. Hepatitis B e-antigen persistency is associated with the properties of HBV-specific CD8 T cells in CHB patients. J Clin Immunol. 2011;31:195–204. doi: 10.1007/s10875-010-9483-5. [DOI] [PubMed] [Google Scholar]
- 24.Zhang JY, Zhang Z, Wang X, et al. PD-1 up-regulation is correlated with HIV-specific memory CD8+ T-cell exhaustion in typical progressors but not in long-term nonprogressors. Blood. 2007;109:4671–4678. doi: 10.1182/blood-2006-09-044826. [DOI] [PubMed] [Google Scholar]
- 25.Nan XP, Zhang Y, Yu HT, et al. Circulating CD4+CD25high regulatory T cells and expression of PD-1 and BTLA on CD4+ T cells in patients with chronic hepatitis B virus infection. Viral Immunol. 2010;23:63–70. doi: 10.1089/vim.2009.0061. [DOI] [PubMed] [Google Scholar]
- 26.Sakuishi K, Apetoh L, Sullivan JM, Blazar BR, Kuchroo VK, Anderson AC. Targeting Tim-3 and PD-1 pathways to reverse T cell exhaustion and restore anti-tumor immunity. J Exp Med. 2010;207:2187–2194. doi: 10.1084/jem.20100643. [DOI] [PMC free article] [PubMed] [Google Scholar]
- 27.Nakamoto N, Cho H, Shaked A, et al. Synergistic reversal of intrahepatic HCV-specific CD8 T cell exhaustion by combined PD-1/CTLA-4 blockade. PLoS Pathog. 2009;5:e1000313. doi: 10.1371/journal.ppat.1000313. [DOI] [PMC free article] [PubMed] [Google Scholar]
- 28.Kaufmann DE, Walker BD. PD-1 and CTLA-4 inhibitory cosignaling pathways in HIV infection and the potential for therapeutic intervention. J Immunol. 2009;182:5891–5897. doi: 10.4049/jimmunol.0803771. [DOI] [PMC free article] [PubMed] [Google Scholar]
- 29.Jin HT, Anderson AC, Tan WG, et al. Cooperation of Tim-3 and PD-1 in CD8 T-cell exhaustion during chronic viral infection. Proc Natl Acad Sci U S A. 2010;107:14733–14738. doi: 10.1073/pnas.1009731107. [DOI] [PMC free article] [PubMed] [Google Scholar]
- 30.Watanabe T, Bertoletti A, Tanoto TA. PD-1/PD-L1 pathway and T-cell exhaustion in chronic hepatitis virus infection. J Viral Hepat. 2010;17:453–458. doi: 10.1111/j.1365-2893.2010.01313.x. [DOI] [PubMed] [Google Scholar]
- 31.Tzeng HT, Tsai HF, Liao HJ, et al. PD-1 blockage reverses immune dysfunction and hepatitis B viral persistence in a mouse animal model. PLoS One. 2012;7:e39179. doi: 10.1371/journal.pone.0039179. [DOI] [PMC free article] [PubMed] [Google Scholar]
- 32.Fisicaro P, Valdatta C, Massari M, et al. Antiviral intrahepatic Tcell responses can be restored by blocking programmed death-1 pathway in chronic hepatitis B. Gastroenterology. 2010;138:682–693. doi: 10.1053/j.gastro.2009.09.052. [DOI] [PubMed] [Google Scholar]
- 33.Okazaki T, Iwai Y, Honjo T. New regulatory co-receptors: inducible co-stimulator and PD-1. Curr Opin Immunol. 2002;14:779–782. doi: 10.1016/s0952-7915(02)00398-9. [DOI] [PubMed] [Google Scholar]
- 34.Sharpe AH, Wherry EJ, Ahmed R, Freeman GJ. The function of programmed cell death 1 and its ligands in regulating autoimmunity and infection. Nat Immunol. 2007;8:239–245. doi: 10.1038/ni1443. [DOI] [PubMed] [Google Scholar]
- 35.Gehring AJ, Ho ZZ, Tan AT, et al. Profile of tumor antigen-specific CD8 T cells in patients with hepatitis B virus-related hepatocellular carcinoma. Gastroenterology. 2009;137:682–690. doi: 10.1053/j.gastro.2009.04.045. [DOI] [PubMed] [Google Scholar]
- 36.Golden-Mason L, Palmer B, Klarquist J, Mengshol JA, Castelblanco N, Rosen HR. Upregulation of PD-1 expression on circulating and intrahepatic hepatitis C virus-specific CD8+ T cells associated with reversible immune dysfunction. J Virol. 2007;81:9249–9258. doi: 10.1128/JVI.00409-07. [DOI] [PMC free article] [PubMed] [Google Scholar]
- 37.Norris S, Coleman A, Kuri-Cervantes L, Bower M, Nelson M, Goodier MR. PD-1 expression on natural killer cells and CD8(+) T cells during chronic HIV-1 infection. Viral Immunol. 2012;25:329–332. doi: 10.1089/vim.2011.0096. [DOI] [PubMed] [Google Scholar]
- 38.Zhou Q, Munger ME, Veenstra RG, et al. Coexpression of Tim-3 and PD-1 identifies a CD8+ T-cell exhaustion phenotype in mice with disseminated acute myelogenous leukemia. Blood. 2011;117:4501–4510. doi: 10.1182/blood-2010-10-310425. [DOI] [PMC free article] [PubMed] [Google Scholar]
- 39.Albers I, Hartmann H, Bircher J, Creutzfeldt W. Superiority of the Child-Pugh classification to quantitative liver function tests for assessing prognosis of liver cirrhosis. Scand J Gastroenterol. 1989;24:269–276. doi: 10.3109/00365528909093045. [DOI] [PubMed] [Google Scholar]
- 40.Llovet JM, Brú C, Bruix J. Prognosis of hepatocellular carcinoma: the BCLC staging classification. Semin Liver Dis. 1999;19:329–338. doi: 10.1055/s-2007-1007122. [DOI] [PubMed] [Google Scholar]
- 41.Sedy JR, Gavrieli M, Potter KG, et al. B and T lymphocyte attenuator regulates T cell activation through interaction with herpesvirus entry mediator. Nat Immunol. 2005;6:90–98. doi: 10.1038/ni1144. [DOI] [PubMed] [Google Scholar]
- 42.Liang XS, Zhou Y, Li CZ, Wan MB. Natural course of chronic hepatitis B is characterized by changing patterns of programmed death type-1 of CD8-positive T cells. World J Gastroenterol. 2010;16:618–624. doi: 10.3748/wjg.v16.i5.618. [DOI] [PMC free article] [PubMed] [Google Scholar]
- 43.Moorman JP, Zhang CL, Ni L, et al. Impaired hepatitis B vaccine responses during chronic hepatitis C infection: involvement of the PD-1 pathway in regulating CD4(+) T cell responses. Vaccine. 2011;29:3169–3176. doi: 10.1016/j.vaccine.2011.02.052. [DOI] [PMC free article] [PubMed] [Google Scholar]
- 44.Ye P, Weng ZH, Zhang SL, et al. Programmed death-1 expression is associated with the disease status in hepatitis B virus infection. World J Gastroenterol. 2008;14:4551–4557. doi: 10.3748/wjg.14.4551. [DOI] [PMC free article] [PubMed] [Google Scholar]
- 45.Zeng Z, Shi F, Zhou L, et al. Upregulation of circulating PD-L1/PD-1 is associated with poor post-cryoablation prognosis in patients with HBV-related hepatocellular carcinoma. PLoS One. 2011;6:e23621. doi: 10.1371/journal.pone.0023621. [DOI] [PMC free article] [PubMed] [Google Scholar]


