

Summary
Advances in stem cell manufacturing methods have made it possible to produce stem cell-derived cardiac myocytes at industrial scales for in vitro muscle physiology research purposes. Although FDA-mandated quality assurance metrics address safety issues in the manufacture of stem cell-based products, no standardized guidelines currently exist for the evaluation of stem cell-derived myocyte functionality. As a result, it is unclear whether the various stem cell-derived myocyte cell lines on the market perform similarly, or whether any of them accurately recapitulate the characteristics of native cardiac myocytes. We propose a multiparametric quality assessment rubric in which genetic, structural, electrophysiological, and contractile measurements are coupled with comparison against values for these measurements that are representative of the ventricular myocyte phenotype. We demonstrated this procedure using commercially available, mass-produced murine embryonic stem cell- and induced pluripotent stem cell-derived myocytes compared with a neonatal mouse ventricular myocyte target phenotype in coupled in vitro assays.
Highlights
-
•
Comprehensive evaluation of stem cell-derived cardiac myocyte form and function
-
•
A multifactorial rubric for stem cell-derived myocyte quality assurance
-
•
Direct comparison of stem cell-derived myocytes and isolated cardiac myocytes
Techniques for differentiating pluripotent stem cells into cardiac myocytes have advanced to the point that such cells are now mass produced for commercial distribution. However, little effort has been made to ensure that these mass-produced myocytes exhibit the functional performance characteristics of the healthy, mature myocardium. Parker and colleagues have a developed a tissue engineering test bed for stem cell-derived myocytes that allows multifactorial evaluation of cardiac myocyte form and function, as well as comparison against a target cardiac phenotype.
Introduction
In response to widespread efforts to commercialize differentiated stem cells (Brower, 1999), the U.S. Food and Drug Administration (FDA) established a set of regulations and guidelines for manufacturing and quality-control evaluations of human cellular and tissue-based products derived from stem cells (FDA, 2011). The recommendations outlined for evaluating differentiated stem cell phenotypes were developed specifically to address patient safety concerns such as tumorigenicity and immunologic incompatibility, due to the initial focus of the industry on regenerative-medicine applications (Fink, 2009). Concerns about patient safety may have slowed the commercialization of regenerative therapies (Fox, 2011), but the use of industrial stem cell-based products for in vitro research, particularly pharmaceutical screening applications (Placzek et al., 2009; Rubin, 2008; Thomson, 2007; Wobus and Löser, 2011), is a promising goal that can potentially be reached in the near term. Due to the mandate to test all drug compounds for potential adverse effects on the heart, in vitro cardiac toxicity screening is a particularly important application that has prompted the development of commercial stem cell-derived cardiac myocytes by a number of companies (Webb, 2009). In this context, the focus of quality assurance shifts from patient safety concerns to the development and adoption of measures that ensure these cells reliably mimic cardiac myocytes found in vivo.
In order to develop quality assurance standards for assessing stem cell-derived myocyte differentiation, it is necessary to first establish the set of characteristics that reliably define cardiac myocyte identity. We reasoned that the most effective way to delineate these standards was to comprehensively evaluate the aspects of form and function that give rise to the contractile properties of cardiac myocytes in the healthy, postnatal heart (Sheehy et al., 2012). No standardized approach currently exists for evaluating cardiac differentiation. Basic characterization involves the use of one or more assays with stringencies ranging from the observation of spontaneous beating activity to electrophysiological recordings, and one of the most commonly used approaches is gene-expression profiling (Mummery et al., 2012). In addition to measuring the expression of cardiac biomarker genes (Bruneau, 2002; Ng et al., 2010), we also examined the organizational characteristics of the contractile myofibrils (Feinberg et al., 2012), the electrical activity that regulates myofibril contraction (Kléber and Rudy, 2004), and contractile force output directly (Alford et al., 2010). Since human ventricular myocytes are not readily available, we utilized commercially available murine embryonic stem cell (mESC)- and induced pluripotent stem cell (miPSC)-derived myocytes and compared them against ventricular myocytes freshly isolated from neonatal mice (neonate). Although humans and mice exhibit differences in cardiac physiology, our goal was to determine the utility of comparing industrially manufactured stem cell-derived myocytes and isolated cardiac myocytes that possess the desired phenotype, using a multifactorial comparison of high-level myocardial tissue architectural and functional characteristics.
Results
Gene-Expression Profiling of mESC, miPSC, and Neonate Engineered Tissues
We previously reported the influence of tissue architecture on the contractile performance of engineered myocardium in vitro, so we began our characterization of commercially available mESC and miPSC myocytes by evaluating their response to geometric cues encoded in the extracellular matrix (ECM) (Feinberg et al., 2012) and measuring the expression of genes that are commonly used to delineate the cardiac myocyte lineage (Maltsev et al., 1994; Sartiani et al., 2007). Culturing the mESC (Figure 1Ai) and miPSC (Figure 1Aii) myocytes on a substrate coated uniformly with fibronectin (FN) gave rise to monolayers with an isotropic cellular arrangement similar to the arrangement observed when neonate ventricular myocytes (Figure 1Aiii) were cultured in a similar manner. Moreover, mESC (Figure S1Ai available online), miPSC (Figure S1Aii), and neonate (Figure S1Aiii) myocytes all assumed a pleomorphic morphology when cultured sparsely on isotropic FN (Figure S1B), even though the neonate cardiac myocytes displayed a smaller surface area than the mESC and miPSC myocytes (Figure S1C). A comparison of the expression profiles for isotropic mESC- (Figure 1Bi) and miPSC- (Figure 1Bii) derived tissues versus the neonate tissues revealed a number of significant differences associated with ion channel subunits and components of the sarcomere. In particular, the mESC tissues exhibited significantly higher expression of the L-type Ca2+ channel subunit Cacna1d (4.9-fold, p < 0.05), as well as the T-type subunits Cacna1g (9.0-fold, p < 0.05) and Cacna1h (42.2-fold, p < 0.05) versus neonate tissues. Isotropic mESC tissues also showed significantly lower expression of Irx4 (−9.1-fold, p < 0.001), Myl2 (−3.2-fold, p < 0.05), and Myl3 (−3.8-fold, p < 0.01), which are commonly associated with the ventricular myocyte phenotype (Ng et al., 2010), and significantly higher expression of the atrial marker genes Myl4 (40.2-fold, p < 0.001) and Myl7 (24.5-fold, p < 0.01) than the neonate isotropic tissues. In contrast, the miPSC isotropic tissues showed significant differences in expression for Cacna1d (5.7-fold, p < 0.05), Cacna1h (27.9-fold, p < 0.001), Myl4 (14.1-fold, p < 0.05), and Myl7 (11.1, p < 0.05) versus the neonate isotropic tissues. These observations suggest that compared with the mESC-derived myocytes, the miPSC-derived myocytes exhibited an expression profile that more closely resembled the profile of the neonate ventricular myocytes.
Figure 1.
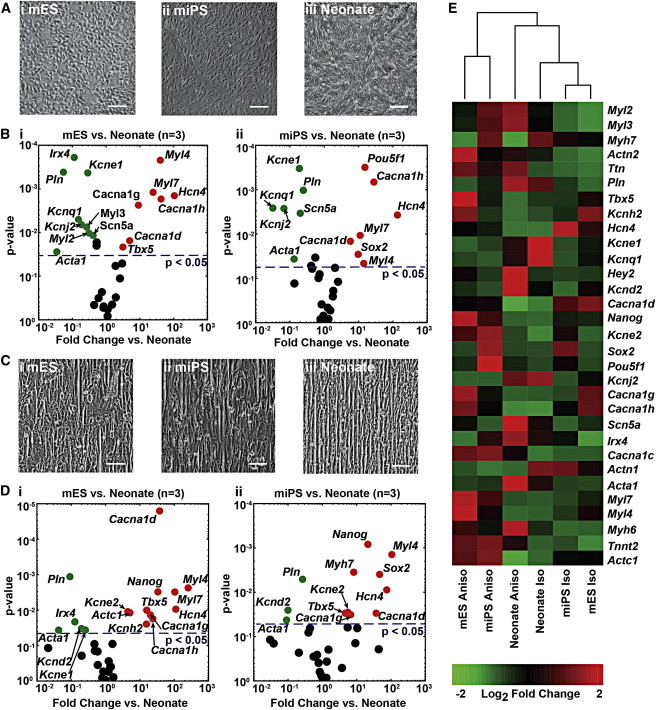
Comparison of mESC, miPSC, and Neonate Gene-Expression Profiles on Isotropic and Anisotropic ECM Substrates
(A) Culturing (i) mESC, (ii) miPSC, and (iii) neonate myocytes on substrates with a uniform coating of FN resulted in isotropic cellular arrangement.
(B) Volcano plots showing the negative log of p values (two-tailed t test, n = 3 for all conditions) versus log fold-change values for comparison of qPCR measurements of cardiac genes (i) between mESC and neonate isotropic monolayers, and (ii) between miPSC and neonate isotropic monolayers reveal significant differences for a number of genes (points on the plot colored green or red represent genes with p < 0.05).
(C) Culturing (i) mESC, (ii) miPSC, and (iii) neonate myocytes on substrates with microcontact-printed lines of FN that were 20 μm wide and spaced 4 μm apart resulted in anisotropic cellular arrangement in all three cell types.
(D) Volcano plots showing the negative log of p values (two-tailed t test, n = 3 for all conditions) versus log fold-change values for comparison of qPCR measurements of cardiac genes (i) between mESC and neonate anisotropic monolayers, and (ii) between miPSC and neonate anisotropic monolayers reveal slightly fewer genes demonstrating significant differences than in the isotropic cultures (points on the plot colored green or red represent genes with p < 0.05).
(E) Hierarchical clustering of mean 2-ΔCt values for a select panel of cardiac genes reveals that the isotropic and anisotropic neonate tissue expression profiles cluster together in the center columns of the heatmap, whereas the anisotropic mESC and miPSC expression profiles form a separate cluster on the right sides of the heatmap, and the isotropic mESC and miPSC profiles cluster together on the left side of the heatmap. Scale bars, 100 μm.
Based on previous studies, we recognized that the gene-expression profile of cardiac myocytes changes as a function of the tissue architecture within which they are embedded (McCain et al., 2013). We engineered laminar, anisotropic myocardium from mESC (Figure 1Ci), miPSC (Figure 1Cii), and neonate cardiac myocytes by culturing them on microcontact-printed FN, where the cells spontaneously formed cell-cell junctions and aligned with the geometric cues within the matrix to form a contiguous tissue of high-aspect-ratio cells (Figures S1D and S1E). After several days of tissue culture, we measured and compared the expression profiles of these engineered tissues. A comparison of the expression profiles for anisotropic neonate and mESC tissues (Figure 1Di) revealed a number of differences associated with Ca2+ channel subunits, such as the L-type Ca2+ channel subunit Cacna1d (37.5-fold, p < 0.0001), as well as the T-type subunits Cacna1g (20.2-fold, p < 0.05) and Cacna1h (23.8-fold, p < 0.05). Additionally, the mESC anisotropic tissues showed significantly lower expression of the ventricular marker Irx4 (−7.7-fold, p < 0.05) and significantly higher expression of the atrial markers Myl4 (254.8-fold, p < 0.01) and Myl7 (104.0-fold, p < 0.01) versus the neonate tissues.
In contrast, the miPSC anisotropic tissues exhibited significant differences from the neonate tissues (Figure 1Dii) for the Ca2+ channel subunits Cacna1d (36.9-fold, p < 0.05) and Cacna1g (6.6-fold, p < 0.05), as well as the atrial myosin light chain kinase gene Myl4 (105.5-fold, p < 0.01). Hierarchical clustering of neonate, mESC, and miPSC gene-expression measurements revealed a distinct separation of the expression profiles for isotropic and anisotropic tissues, regardless of myocyte type (Figure 1E). Moreover, the expression profiles for mESC and miPSC myocytes in both the isotropic and anisotropic cellular configurations clustered closer to each other than to the neonate tissues. This suggests that the mESC and miPSC myocytes exhibited global transcriptional profiles that were distinct from the neonate expression pattern, despite differences in the relative expression profiles between the mESC and miPSC tissues.
Characterization of Myofibril Architecture and Global Sarcomere Alignment
One of the defining features of the ventricular myocardium is the laminar arrangement of cardiac myocytes, which serves to organize and orient the contractile sarcomeres to facilitate efficient pump function (McCain and Parker, 2011). We evaluated the ability of the mESC and miPSC engineered tissues to self-assemble myofibrils with alignment comparable to that of neonate ventricular myocytes by using custom image analysis software developed in our lab. Immunofluorescence micrographs of sarcomeric α-actinin allowed us to visualize the orientations of the z lines outlining the lateral edges of sarcomeres, and to quantitatively assess sarcomere organization in our engineered tissues (Figure S2Bi–S2Bii). Visualization of global z-line registration in isotropic monolayers of mESC (Figure 2Ai), miPSC (Figure 2Aii), and neonate (Figure 2Aiii) myocytes revealed random orientation patterns. In contrast, the anisotropic mESC (Figure 2Bi), miPSC (Figure 2Bii), and neonate (Figure 2Biii) tissues demonstrated a greater degree of uniaxial z-line registration. To quantify the differences in global sarcomere organization between the mESC and miPSC tissues versus the neonate tissues (Figure 2C), we utilized a metric known as the orientational order parameter (OOP), which is commonly used to characterize the alignment of liquid crystals (Kuczynski et al., 2002) and ranges from zero (random organization) to one (perfect alignment). It was previously shown that this metric can be successfully adapted to measure and compare z-line registration in engineered cardiac tissues, and that it provides insight into the contractile strength of the tissues (Feinberg et al., 2012). The anisotropic neonate tissues exhibited a significantly higher OOP value than both the mESC and miPSC tissues, suggesting that both types of stem cell-derived cardiac myocytes were unable to generate myofibrils with the same degree of global sarcomere alignment as the neonate myocytes. Isotropic tissues had low OOP values due to the random organization of the cardiac myocytes. Measurement of registered z-line spacing also revealed that the anisotropic mESC and miPSC tissues displayed significantly shorter sarcomere lengths than the neonate tissues (Figure 2D). Moreover, quantification of “sarcomere packing density” (i.e., the proportion of α-actinin localized to z lines indicative of the presence of fully formed sarcomeres) showed that the anisotropic neonate tissues exhibited significantly higher sarcomere packing density than the mESC and miPSC tissues. Taken together, these analyses revealed that the mESC- and miPSC-derived myocytes responded to ECM cues in a manner similar to that observed for the neonate myocytes, but exhibited sarcomere organization reminiscent of immature premyofibrils observed in embryonic cardiac myocytes (Dabiri et al., 1997; Grosberg et al., 2011b; LoRusso et al., 1997).
Figure 2.
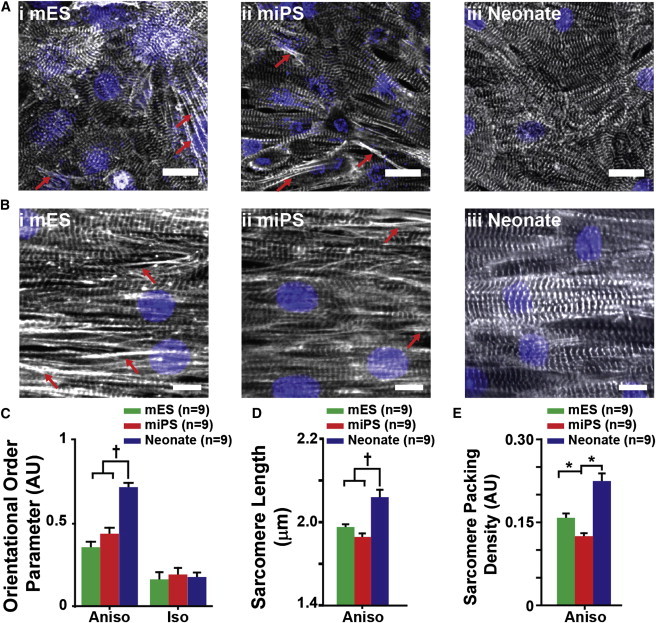
Comparison of Myofibril Architecture in mESC, miPSC, and Neonate Engineered Tissues
(A and B) Immunofluorescence visualization of sarcomeric α-actinin in (A) isotropic monolayers of (i) mESC, (ii) miPSC, and (iii) neonate myocytes, and (B) anisotropic monolayers of (i) mESC, (ii) miPSC, and (iii) neonate myocytes reveals the pattern of sarcomere organization adopted by each cell type in response to geometric cues encoded in the ECM. Immature premyofibrils (red arrows) were observed exclusively in mESC and miPSC engineered tissues. Quantitative evaluation of sarcomeric α-actinin immunofluorescence micrographs allowed statistical comparison of sarcomere organization and architecture.
(C) The OOP was used as a metric of global sarcomere alignment within the engineered tissues and showed that anisotropic neonate tissues exhibited significantly greater overall sarcomere alignment than the mESC and miPSC anisotropic tissues. No significant differences in global sarcomere alignment were observed among the isotropic mESC, miPSC, and neonate tissues.
(D) Comparison of z-line spacing revealed that the neonate anisotropic tissues exhibited significantly greater sarcomere length than both the mESC and miPSC anisotropic tissues.
(E) From the measurements of sarcomere length, the sarcomere packing density was calculated for anisotropic tissues of each cell type. All three cell types exhibited significantly different sarcomere packing densities. The statistical tests used were ANOVA (∗p < 0.05) and ANOVA on ranks (†p < 0.05). Data are presented as mean ± SEM. Scale bars, 10 μm.
See also Figure S2.
Measurement of mESC, miPSC, and Neonate Electrophysiological Performance
The electrical activity of cardiac myocytes regulates the initiation of myofibril contraction and is commonly measured as an indicator of myocyte identity and functionality (Kléber and Rudy, 2004; Maltsev et al., 1994; Weinberg et al., 2010). We used planar patch-clamp recordings to compare and contrast the action potential (AP) characteristics of isolated mESC, miPSC, and neonate myocytes. We identified two different demographics of cell types as demonstrated by AP morphology (Maltsev et al., 1994). Neonate myocytes primarily demonstrated ventricular-like APs (Figure 3Ai), whereas mESC- and miPSC-derived myocytes exhibited APs that were evenly distributed between ventricular-like and atrial-like morphologies (Figure 3Aii). Both the mESC- and miPSC-derived myocytes primarily exhibited APs, as shown in Figure 3Aii, whereas the neonate ventricular myocytes demonstrated APs, as illustrated in Figure 3Ai. Analysis of AP characteristics, such as maximum voltage (Vmax), AP duration at 50% repolarization (APD50), and AP duration at 90% repolarization (APD90), revealed that the mESC and miPSC myocytes exhibited roughly equal incidences of atrial-like and ventricular-like APs, whereas the neonate cardiac myocytes displayed ventricular-like AP characteristics (Figure 3B). In addition to AP characterization, we also measured the electrical conduction properties of the anisotropic mESC (Figure 3Ci), miPSC (Figure 3Cii), and neonate (Figure 3Ciii) tissues using optical mapping and the voltage-sensitive fluorescent dye RH-237 (Bursac et al., 2002; Thomas et al., 2000; Weinberg et al., 2010) to evaluate the ability of the stem cell-derived myocytes to form the electromechanical syncytium that typifies the myocardium (Kléber and Rudy, 2004). We did not observe any significant differences in the longitudinal (LCV) or transverse (TCV) conduction velocities between the mESC, miPSC, and neonate tissues (Figure 3D). However, we did observe substantial differences in the cellular dimensions (l × w) of mESC (72.04 μm × 12.07 μm) and miPSC (82.30 μm × 11.25 μm) versus neonate (44.93 μm × 11.35 μm) cardiac myocytes that may influence the magnitude of the LCV and TCV in engineered tissues comprised of these cells, making them appear faster than they actually are. AP duration measurements revealed no significant differences at 50% repolarization (APD50), but a significant (p < 0.05) difference was observed at 90% repolarization (APD90) between the neonate and mESC anisotropic tissues (Figure 3E).
Figure 3.
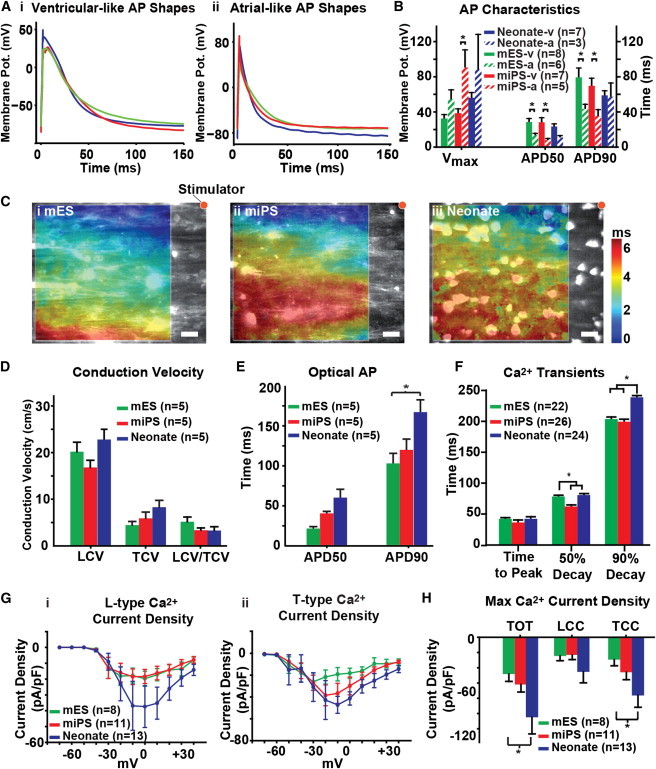
Comparison of Electrical Activity in mESC, miPSC, and Neonate Engineered Tissues
(A) Patch-clamp recordings from isolated mESC, miPSC, and neonate myocytes exhibited APs with both (i) ventricular-like and (ii) atrial-like profiles.
(B) Characterization of the AP traces revealed no significant differences between the three cell types, but the mESC and miPSC myocytes exhibited an equal proportion of ventricular-like (mESC-v, miPSC-v) and atrial-like (mESC-a, miPSC-a) AP traces, whereas the neonates exhibited primarily ventricular-like (neonate-v) AP profiles.
(C) The electrophysiological characteristics of anisotropic (i) mESC, (ii) miPSC, and (iii) neonate tissues were assessed using optical mapping and the photovoltaic dye RH237.
(D) Comparison of conduction properties between the mESC, miPSC, and neonate tissues revealed no significant differences in either LCV or TCV.
(E) Evaluation of optical AP duration in anisotropic tissues revealed no significant differences in APD50, but a significant difference in APD90 between the mESC and neonate tissues was observed.
(F) Comparison of Ca2+ transients measured in anisotropic tissues revealed that the 50% decay time of the miPSC tissues was significantly lower than that of both the mESC and neonate tissues, but the 90% decay time of both the mESC and miPSC tissues was significantly lower than that of the neonate tissues.
(G) Patch-clamp recordings were collected on isolated mESC, miPSC, and neonate myocytes to measure and compare (i) LCC and (ii) TCC elicited at various holding potentials.
(H) Patch-clamp recordings of maximum Ca2+ current density in isolated mESC, miPSC, and neonate myocytes revealed a significant difference in TOT between the neonate and mESC myocytes. No significant differences in LCC were observed, but a significant difference in TCC was observed between the neonate and mESC myocytes. The statistical test used was ANOVA (∗p < 0.05). Data are presented as mean ± SEM. Scale bars, 20 μm.
See also Figure S3.
Ca2+ plays a crucial role in coupling myocyte excitation and contractile activity (Bers, 2002). We measured Ca2+ transient activity in engineered anisotropic tissues, as well as the Ca2+ current profiles of isolated mESC, miPSC, and neonate myocytes. Ca2+ transients measured in anisotropic tissues revealed a significantly (p < 0.05) shorter 50% decay time in the miPSC, but not the mESC, tissues as compared with the neonate tissues, and significantly (p < 0.05) shorter 90% decay time in both the mESC and miPSC tissues versus the neonate tissues (Figure 3F). Planar patch-clamp recordings of L-type (LCC; Figure 3Gi) and T-type (TCC; Figure 3Gii) Ca2+ current profiles revealed significantly (p < 0.05) higher total (TOT) and TCC maximum Ca2+ current densities in the neonate myocytes versus the mESC-derived, but not the miPSC-derived, myocytes (Figure 3H). Taken together, these data suggest that the mESC and miPSC myocytes possessed electrophysiological properties similar to those of neonate cardiac myocytes, aside from differences in funny current and voltage-gated Ca2+ channel subunit expression (illustrated in Figure 1).
Measurement of mESC, miPSC, and Neonate Engineered Tissue Contractile Performance
With the muscular thin film (MTF) contractility assay, it is now possible to assess the diastolic (Figure 4Ai) and systolic (Figure 4Aii) functions of engineered myocardium directly (Alford et al., 2010; Feinberg et al., 2007; Grosberg et al., 2011a). Using the “heart-on-a-chip” MTF assay (Grosberg et al., 2011a), we measured the stress generation profiles of anisotropic mESC, miPSC, and neonate tissues (Figure 4B), and compared their contractile performance. The anisotropic neonate tissues generated significantly (p < 0.05) higher diastolic, peak systolic, and twitch stress than both the mESC and miPSC tissues (Figure 4C), with the observed values for the neonate tissues being within the range measured for isolated murine papillary muscle strips (Gao et al., 1998; Stuyvers et al., 2002). The results of the contractility measurements clearly show a functional deficit in the mESC- and miPSC-derived myocytes that was not apparent in the electrophysiological measurements. We used the combined output of our electrophysiological, calcium transient, and contractile force experimental measurements to create graphical representations of the excitation-contraction coupling profiles of the mESC (Figure 4Di), miPSC (Figure 4Dii), and neonate (Figure 4Diii) engineered tissues that clearly illustrate the similarities and differences in the excitation-contraction coupling among the cell types. These data show that the miPSC-derived myocytes are qualitatively more similar to the neonate myocytes than are the mESC-derived myocytes.
Figure 4.
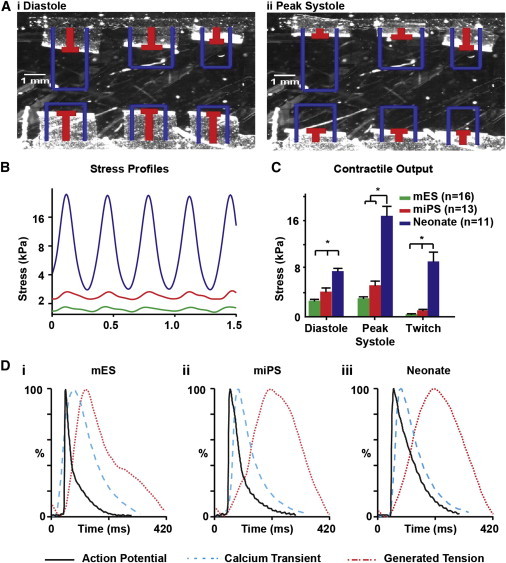
Comparison of Contractile Performance in mESC, miPSC, and Neonate Engineered Tissues
(A) The contractile performance of anisotropic mESC, miPSC, and neonate tissues was assessed using the MTF assay, and the radius of curvature of the MTFs at (i) diastole and (ii) peak systole were used to calculate contractile stress.
(B) The radius of curvature of the MTFs was used to calculate and compare the temporal contractile strength profiles of anisotropic mESC (green), miPSC (red), and neonate (blue) tissues.
(C) Comparison of MTF contractile output revealed that neonate anisotropic tissues generated significantly greater diastolic, peak systolic, and twitch stress than both the mESC and miPSC tissues.
(D) Graphical representation of AP morphology (black solid line), Ca2+ transient morphology (blue dotted line), and contractility profile (red dotted line) during a typical excitation-contraction cycle of the mESC, miPSC, and neonate engineered anisotropic tissues. The statistical test used was ANOVA (∗p < 0.05). Data are presented as mean ± SEM.
Integration of Experimental Measurements to Evaluate the Stem Cell-Derived Myocyte Cardiac Phenotype
To determine how closely the mESC- and miPSC-derived myocytes matched the phenotype of the neonate ventricular myocytes, we computationally integrated the set of gene-expression, morphology, electrophysiology, and contractility experimental measurements collected from each cell population, and calculated the difference between the unknown and target cell populations. For this purpose, we evaluated measures of effect size, such as the z factor and strictly standardized mean difference (SSMD), that have previously been used to quantify biological population differences in high-throughput screening applications (Birmingham et al., 2009). We chose to use the SSMD instead of the z factor in this case study because the SSMD is more robust to outliers, is not dependent on sample size, and can be used to evaluate non-normal data (Zhang, 2007). For each type of experimental measurement, we normalized the mean (μnorm) values to the interval [0,1] by identifying the maximum (μmax) and minimum (μmin) mean values observed for that measurement from all three cardiac myocyte sources, and calculating as follows:
| (Equation 1) |
Using these normalized values, we calculated the SSMD (β) and quantified the differences between each unknown population (i.e., mESC and miPSC) and the neonate target population as follows:
| (Equation 2) |
where μ represents the mean and σ represents the SD. We used the results to evaluate the magnitude of difference, taking into account the variance in the measurements, between the stem cell-derived myocytes and the neonate cardiac myocytes (Figure 5). This allowed us to identify the parameters that showed the greatest degree of similarity to and difference from the target neonate ventricular myocyte tissues. We then used the β values from each experimental measurement for the mESC and miPSC tissues, and calculated the mean squared error (MSE) versus the neonate tissues as follows:
| (Equation 3) |
where n is the total number of experimental measurement β values included in the calculation. We then used these results to evaluate the differences observed for each measurement category (i.e., the β values for gene expression, morphology, electrical activity, contractility used to calculate category-specific MSE values), as well as to define a single MSE value calculated from all of the experimental measurements from all categories combined that represents the total difference between the stem cell-derived and neonate cardiac myocytes based on the measurements performed (Table 1). A lower MSE value indicates a better match to the neonate target phenotype, with an MSE value of zero indicating a perfect match.
Figure 5.
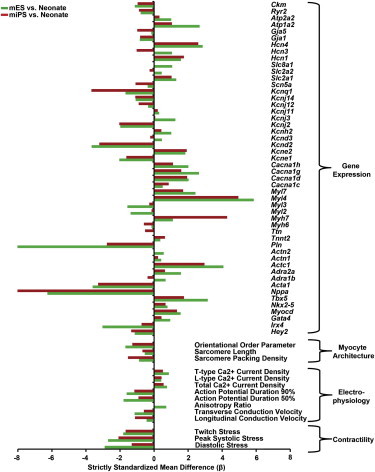
Integrated Visual Comparison of mESC, miPSC, and Neonate Experimental Measurements
SSMD (β) values were computed for mESC- and miPSC-derived myocytes relative to the neonate cardiac myocytes from the mean and sample SDs collected for each experimental measurement. These β values were organized by measurement type (i.e., gene expression, myocyte architecture, electrophysiology, and contractility) and plotted to allow comparison. Negative β values indicate measurements with higher relative magnitude in the neonate cardiac myocytes, whereas positive β values indicate measurements that were higher in the mES/miPSC myocytes relative to the neonate cardiac myocytes.
See also Table S2.
Table 1.
MSE Values Calculated for Each Group of Measurements in the Comparison of mESC- and miPSC-Derived Myocytes with Neonate Ventricular Myocytes
| Measurement Category | MSEmES | MSEmiPS |
|---|---|---|
| Gene expression | 5.69 | 4.25 |
| Morphology | 1.30 | 1.48 |
| Electrophysiology | 1.16 | 0.57 |
| Contractility | 6.32 | 2.95 |
| All measurements | 4.95 | 3.60 |
The SSMD (β) values computed for each experimental measurement were used to calculate MSE values for each major measurement category (see Table S2), as well as all of the measurements combined, in comparisons of the mESC (MSEmES), and miPSC (MSEmiPS) engineered tissues with the neonate engineered tissues.
We found that the miPSC tissues exhibited lower MSE values than the mESC tissues in every measurement category except morphology. In addition, the overall MSE values calculated from all of the experimental measurements combined revealed a lower MSE for the miPSC engineered tissues than for those comprised of mESC-derived myocytes. This suggests that the miPSC-derived myocytes exhibited a global phenotype that was slightly closer to the neonate cardiac myocytes than the mESC-derived myocytes, although both the mESC- and miPSC-derived myocytes demonstrated substantial differences from the neonate cardiac myocytes for a number of characteristics.
Discussion
The goal of this study was to define a quality-control standard rubric for assessing stem cell-derived cardiac myocytes. We chose a set of experimental measurements that provide insight into not only the expression profile of the cells but also morphological and functional characteristics that are intimately tied to the contractile function of cardiac tissues (Bursac et al., 2002; Feinberg et al., 2012; Kléber and Rudy, 2004). We utilized ventricular myocytes isolated from postnatal mouse hearts to serve as our reference standard for defining the target phenotype. However, an inherent limitation to using these cells is the presence of noncardiomyocytes, such as fibroblasts, endothelial cells, and smooth muscle cells, that may confound the interpretation of some experimental measurements, such as gene-expression profiling. It should also be noted that the mESC- and miPSC-derived cardiac myocytes used in this study were produced using a differentiation protocol that gives rise to a heterogeneous population of atrial, ventricular, and pacemaker-like cells, which may also make interpretation of certain measurements challenging. However, the proposed quality-assessment strategy is not dependent on any particular set of measurements and allows researchers the flexibility to choose the set of experimental measurements that best suits their needs.
Using the experimental measurements described above and isolated neonatal ventricular myocytes as our reference phenotype, we developed a “quality index” that utilizes the magnitude and variance of these measurements to provide a numeric score indicating how closely the stem cell-derived myocytes match the characteristics of the neonatal cardiac myocytes. The combination of gene-expression, morphological, electrophysiological, and contractility measurements employed allowed us to pinpoint specific differences in the structural and functional properties of the mESC and miPSC engineered tissues versus the neonate tissues that have important implications for their utility in in vitro assays. Additional studies of the relationships between these measurements and the response of engineered cardiac tissues to compounds that have known effects on heart function may provide valuable insight into the combination of measurements that can most reliably determine the ability of stem cell-derived cardiac myocytes to adopt the desired phenotype. With a carefully chosen set of experimental parameters, this quality-assessment rubric may provide a reliable means to evaluate strategies for improving the differentiation of cardiac myocytes from stem cells and drive them toward a more mature phenotype (Cassino et al., 2012). Further, this quality index will not only allow researchers to identify the commercial stem cell-derived myocyte product lines that are most suitable for their needs, it may also serve the stem cell industry as a quality-assurance system for ensuring that batches released to customers faithfully recapitulate the desired phenotype.
Experimental Procedures
Stem Cell-Derived Myocyte Culture
Cor.At mESC-derived myocytes (lot# CS25CL_V_SN_1M, production date: 2010-02-16) and iPSC-derived myocytes (lot# CS02CL-i, production date: 2010-11-15; CS07CL-i, production date: 2011-05-09) were cultured according to instructions and with culture reagents supplied by the manufacturer (Axiogenesis). Briefly, cells were cultured in T25 flasks precoated with 0.01 μg/ml FN (BD Biosciences) in puromycin-containing culture media at 37°C and 5% CO2 for 72 hr to eliminate undifferentiated stem cells from the culture. After 72 hr, cells were dissociated with 0.25% trypsin and seeded onto microcontact-printed substrates at densities of 100,000/cm2. Cells were cultured for 2 days on microcontact-printed substrates to allow formation of a functional syncytium while preserving the proportion of myocytes that exhibited ventricular characteristics prior to experimentation.
Neonatal Mouse Ventricular Myocyte Culture
Neonatal mouse ventricular myocytes were isolated from 2-day-old neonatal Balb/c mice using procedures approved by the Harvard University Animal Care and Use Committee. Briefly, excised ventricular tissue was incubated in a 0.1% (w/v) trypsin (USB) solution cooled to 4°C for approximately 12 hr with agitation. Trypsinized ventricular tissue was dissociated into cellular constituents via serial exposure to a 0.1% (w/v) solution of collagenase type II (Worthington Biochemical) at 37°C for 2 min. Isolated myocytes were maintained in a culture medium consisting of Medium 199 (Invitrogen) supplemented with 10% (v/v) heat-inactivated fetal bovine serum (FBS), 10 mM HEPES, 20 mM glucose, 2 mM L-glutamine, 1.5 μM vitamin B-12, and 50 U/ml penicillin, and seeded at a density of 200,000 cells/cm2. From the second day of culture onward, the FBS concentration was reduced to 2% (v/v) and the medium was exchanged every 48 hr. Myocytes were cultured for 4 days on microcontact-printed substrates prior to experimentation.
Fabrication of Microcontact-Printed Substrates
Silicone stamps designed for microcontact printing were prepared as previously described. Photolithographic masks were designed in AutoCAD (Autodesk), and consisted of 20 μm wide lines separated by 4 μm gaps to impose a laminar organization on the myocytes. Polydimethylsiloxane (PDMS, Sylgard 184; Dow Corning) was used to fabricate stamps with the specified pattern. Stamps were incubated with 50 μg/ml FN (BD Biosciences) for 1 hr. Glass coverslips were spin-coated with PDMS and treated in a UV-ozone cleaner (Jelight) immediately prior to stamping with FN. After the FN pattern was transferred to the surface of the PDMS-coated coverslips, they were incubated in 1% (w/v) Pluronic F-127 (BASF) to block cell adhesion to unstamped regions.
Heart-on-a-Chip Substrate Fabrication
Engineered cardiac tissue contractile performance was measured using a custom MTF based platform (Alford et al., 2010; Feinberg et al., 2007; Grosberg et al., 2011a). Briefly, the heart-on-a-chip substrates consisted of glass coverslips selectively coated with a thermosensitive sacrificial polymer, poly(N-isopropylacrylamide) (PiPAAm; Polysciences), and with a second layer of PDMS. The thickness of the PDMS layer was found to be in the range of 10–18 μm for all “heart chips” used in this study (Dektak 6M; Veeco Instruments).
Heart-on-a-Chip Contractility Experiments
During contractility experiments, samples were submerged in Tyrode’s solution (mM, 5.0 HEPES, 5.0 glucose, 1.8 CaCl2, 1.0 MgCl2, 5.4 KCl, 135.0 NaCl, and 0.33 NaH2PO4, pH 7.4). All reagents were purchased from Sigma-Aldrich. Rectangular films were cut with a razor blade, and the bath temperature was decreased below the PiPAAm transition temperature, making possible for the MTF to bend away from the glass. Video recordings of the deformation of each film were processed to obtain the time course (Alford et al., 2010) of the tissue-generated stresses. The peak systolic and diastolic stresses were calculated as the average of the maxima and minima of the stress profile during 10 cycles at a pacing of 3 Hz, and twitch stress was defined as the difference between peak systolic and diastolic stresses.
Immunohistochemical Labeling
Samples were fixed in 4% (v/v) paraformaldehyde with 0.05% (v/v) Triton X-100 in PBS at room temperature for 10 min. Cells were incubated in a solution containing 1:200 dilutions of monoclonal anti-sarcomeric α-actinin antibody (A7811, clone EA-53; Sigma-Aldrich), polyclonal anti-FN antibody (F3648; Sigma-Aldrich), DAPI (Invitrogen), and Alexa Fluor 633-conjugated phalloidin (Invitrogen) for 1 hr at room temperature. Samples were then incubated in 1:200 dilutions of Alexa Fluor 488-conjugated goat anti-mouse IgG and Alexa Fluor 546-conjugated goat anti-rabbit IgG secondary antibodies (Invitrogen) for 1 hr at room temperature. Labeled samples were imaged with a Zeiss LSM confocal microscope (Carl Zeiss Microscopy).
Quantitative Evaluation of Sarcomere Structure
Confocal Z stacks of sarcomeric α-actinin fluorescence micrographs were deconvolved with Mediacy Autoquant (MediaCybernetics). Analysis of sarcomeric structural characteristics was conducted using custom-designed ImageJ (Abramoff et al., 2004) and MATLAB (The MathWorks) software (Figure S2A). The orientations of sarcomeric α-actinin positive pixels were determined using an adapted structure-tensor method (Rezakhaniha et al., 2012) and the orientational order parameter (OOP), a measure of the global alignment of the sarcomeres, was calculated from the observed orientation values. The orientations observed in the micrographs were color-coded using the HSV digital image representation (Figure S2Bi) where the Hue channel was used for orientation, the Saturation channel for pixel coherency (i.e., a measure of local contrast), and the Value channel for the preprocessed image. The normalized occurrence of orientations that demonstrated a coherency higher than a given threshold could then be displayed in a histogram (Figure S2Bii). The sarcomere length and the overall regularity of the z lines were determined by processing the images with a 2D fast Fourier transform algorithm. The power spectrum (Figure S2Ci) was then radially integrated and normalized by the total area under the 1D curve. The sarcomere packing density was defined as the area under the periodic component (shaded red in Figure S2Cii).
Planar Patch-Clamp Electrophysiological Recordings
Planar patch-clamp experiments were conducted as previously described (Weinberg et al., 2010). Briefly, cells were cultured on FN (BD Biosciences) coated T25 flasks for 5 days, isolated using 0.25% trypsin (Invitrogen), resuspended in extracellular buffer solution (EBS [mM]: 140 NaCl, 4 KCl, 1 MgCl2, 2 CaCl2, 5 D-glucose monohydrate, 10 HEPES, pH 7.4) to a final concentration of 1,000 cells/μl, and allowed to equilibrate for 5 min in EBS. The electronics were calibrated in the presence of EBS and intracellular buffer solution (IBS [mM]: 50 KCl, 10 NaCl, 60 KF, 20 EGTA, 10 HEPES, pH 7.2) prior to flowing cells into the chamber. Then 5 μl of the cell suspension was introduced into the chip and the negative pressure was automatically adjusted to produce a final seal resistance greater than 1 GOhm. During current-clamp experiments, cells were subjected to ten trains of ten current pulses at 3 Hz; the current amplitude was set to 1.5 times the threshold for AP generation. When the signal reached steady state, ten APs were averaged, yielding a representative trace for the calculation of AP duration indicators. During voltage-clamp experiments, cells were kept in buffers containing tetrodotoxin (10 μM), nifedipine (10 μM), 4-AP (1 mM), and tetraethylammonium (20 mM) purchased from Sigma-Aldrich. The membrane potential was subjected to two voltage-clamp protocols: First, the membrane potential was held to a value of −90 V for 250 ms and then stepped from −70 to +40 mV in 10 mV steps for 250 ms, thus eliciting the total Ca2+ current (TOT). Second, from the same holding potential, cells were stepped from −40 to +40 mV, a range in which mostly the LCC is active. The TCC was then calculated as the difference between the TOT and LCC.
Optical Mapping of Electrophysiological Properties
Samples were incubated in 4 μM RH237 (Invitrogen) for 5 min and washed three times with Tyrode’s solution prior to recording. The temperature of the bath solution was maintained at approximately 35°C using a digital temperature controller (TC-344B; Warner Instruments) for the duration of the experiment. Then 10 μM Blebbistatin (EMD Millipore) was added to minimize motion artifacts during recording of electrical activity (Fedorov et al., 2007; Herron et al., 2012). Samples were paced at 3 Hz with a 10 ms biphasic pulse at 10–15 V delivered using an SD-9 stimulator (Grass Technologies) and a bipolar, platinum point electrode placed approximately 300–500 μm above the sample and 1–2 mm from the top-right corner of the field of view (FOV). Imaging was performed using a Zeiss Axiovert 200 epifluorescence microscope (Carl Zeiss Microscopy) equipped with an X-cite Exacte mercury arc lamp (Lumen Dynamics). Illumination light was passed through a 40X/1.3 NA objective (EC Plan-NEOFLUAR; Zeiss) and a band-pass excitation filter (530–585 nm). Emission light was filtered at 615 nm with a long-pass filter and focused onto the 100 × 100 pixel chip of a high-speed MiCAM Ultima CMOS camera (Scimedia). Images were acquired at 1,000 fps from a 250 × 250 μm FOV. Postprocessing of the raw data included reduction of drift induced by photobleaching by subtracting a linear fit of the baseline, applying a 3 × 3 pixel spatial filter to improve the signal/noise ratio, and excluding saturated pixels. Activation time was calculated as the average maximum upstroke slope of multiple pulses over a 2–4 s recording window. LCVs and TCVs were calculated through a linear fit of the activation times along the horizontal and vertical axes of each FOV, respectively. Optical AP traces were calculated as the average of multiple pulses while adjusting the offset of each pixel caused by different activation times.
Ratiometric Measurement of Cardiac Myocyte Ca2+ Transients
Cardiac tissues were incubated in a 5 μM solution of acetoxymethyl (AM) Fura Red (F-3021; Invitrogen) reconstituted in Pluronic F-127 (P-3000MP; Invitrogen) for 20 min. After dye loading, cells were incubated in Tyrode’s solution for 5 min, rinsed three times, and imaged on a Zeiss LSM LIVE (Carl Zeiss Microscopy) confocal microscope at 40× magnification with an environmental chamber to ensure a constant physiological temperature of 37°C. Tissues were field stimulated at 3 Hz during recordings. Dual-excitation ratiometric recordings were performed by rapidly switching (through an acousto-optical tunable filter) excitation laser lights at 405 nm and 488 nm, and collecting the corresponding emissions through a high-pass filter with cutoff at 546 nm. Recordings were constrained to 20 lines oriented perpendicular to the main axis of the cells and ensuring minimal intersection with nuclei to maintain an acquisition speed of 250 fps (Figure S3A). After background subtraction, two signals were obtained (Figure S3B): one (blue line) that increased with the Ca2+ elevation corresponding to excitation at 405 nm, and one (green line) that showed an opposite trend and corresponded to the 488 nm excitation wavelength. The ratiometric representation of the Ca2+ transient was taken as the ratio of the 405 nm and 488 nm signals (black trace in Figure S3C). Four consecutive transients at steady state were further averaged to create a representative single transient (Figure S3D).
Quantitative RT-PCR Gene-Expression Measurements
Total RNA was collected in triplicate from both isotropic and micropatterned anisotropic samples using the Strategene Absolutely RNA Miniprep kit (Agilent Technologies) according to the manufacturer’s instructions. Genomic DNA contamination was eliminated by incubating the RNA lysates in DNase I digestion buffer at 37°C for 15 min during the RNA purification procedure. The quantity and purity of the RNA lysates were assessed using a Nanodrop spectrophotometer (Thermo Scientific). Purified total RNA lysates with OD 260/280 ratios greater than 1.7 were used for quantitative RT-PCR (qRT-PCR) measurements. cDNA strands were synthesized for genes of interest using an RT2 first-strand synthesis kit (QIAGEN) and custom preamplification primer sets (QIAGEN). For each first-strand synthesis reaction, 500 ng of total RNA from each lysate was used. Expression levels for specific genes of interest (Table S1) were measured using custom RT2 Profiler RT-PCR arrays (QIAGEN) and the Bio-Rad CFX96 RT-PCR detection system. Statistical analysis of qRT-PCR threshold cycle data was carried out with the web-based RT2 Profiler PCR Array Data analysis Suite version 3.5 (QIAGEN) according to published guidelines (Schmittgen and Livak, 2008).
Acknowledgments
We thank Dr. Mark Bray at the Broad Institute, and Professor Hanspeter Pfister and Dr. Alexander Lex, both of Harvard University, for helpful discussions about data analysis. We also thank the Harvard Center for Nanoscale Systems (CNS) for the use of its microfabrication facilities, and Axiogenesis for providing Cor.At mESC- and miPSC-derived myocytes and Cor.At culture media. This work was supported by the NIH/NHLBI for Human Pluripotent Stem Cells and Progenitor Models of Cardiac and Blood Diseases (U01 HL100408-02), and the NIH for a Human Cardio-Pulmonary System on a Chip research grant (UH2 TR000522-01).
Footnotes
This is an open-access article distributed under the terms of the Creative Commons Attribution-NonCommercial-No Derivative Works License, which permits non-commercial use, distribution, and reproduction in any medium, provided the original author and source are credited.
Supplemental Information
References
- Abramoff M.D., Magalhaes P.J., Ram S.J. Image processing with ImageJ. Biophotonics Int. 2004;11:36–42. [Google Scholar]
- Alford P.W., Feinberg A.W., Sheehy S.P., Parker K.K. Biohybrid thin films for measuring contractility in engineered cardiovascular muscle. Biomaterials. 2010;31:3613–3621. doi: 10.1016/j.biomaterials.2010.01.079. [DOI] [PMC free article] [PubMed] [Google Scholar]
- Bers D.M. Cardiac excitation-contraction coupling. Nature. 2002;415:198–205. doi: 10.1038/415198a. [DOI] [PubMed] [Google Scholar]
- Birmingham A., Selfors L.M., Forster T., Wrobel D., Kennedy C.J., Shanks E., Santoyo-Lopez J., Dunican D.J., Long A., Kelleher D. Statistical methods for analysis of high-throughput RNA interference screens. Nat. Methods. 2009;6:569–575. doi: 10.1038/nmeth.1351. [DOI] [PMC free article] [PubMed] [Google Scholar]
- Brower V. Human ES cells: can you build a business around them? Nat. Biotechnol. 1999;17:139–142. doi: 10.1038/6140. [DOI] [PubMed] [Google Scholar]
- Bruneau B.G. Transcriptional regulation of vertebrate cardiac morphogenesis. Circ. Res. 2002;90:509–519. doi: 10.1161/01.res.0000013072.51957.b7. [DOI] [PubMed] [Google Scholar]
- Bursac N., Parker K.K., Iravanian S., Tung L. Cardiomyocyte cultures with controlled macroscopic anisotropy: a model for functional electrophysiological studies of cardiac muscle. Circ. Res. 2002;91:e45–e54. doi: 10.1161/01.res.0000047530.88338.eb. [DOI] [PubMed] [Google Scholar]
- Cassino T.R., Drowley L., Okada M., Beckman S.A., Keller B., Tobita K., Leduc P.R., Huard J. Mechanical loading of stem cells for improvement of transplantation outcome in a model of acute myocardial infarction: the role of loading history. Tissue Eng. Part A. 2012;18:1101–1108. doi: 10.1089/ten.tea.2011.0285. [DOI] [PMC free article] [PubMed] [Google Scholar]
- Dabiri G.A., Turnacioglu K.K., Sanger J.M., Sanger J.W. Myofibrillogenesis visualized in living embryonic cardiomyocytes. Proc. Natl. Acad. Sci. USA. 1997;94:9493–9498. doi: 10.1073/pnas.94.17.9493. [DOI] [PMC free article] [PubMed] [Google Scholar]
- FDA. (2011). Current good tissue practice (CGTP) and additional requirements for manufacturers of human cells, tissues, and cellular and tissue-based products (HCT/Ps) (Food and Drug Administration Center for Biologics Evaluation and Research). http://www.fda.gov/BiologicsBloodVaccines/GuidanceComplianceRegulatoryInformation/Guidances/Tissue/default.htm.
- Fedorov V.V., Lozinsky I.T., Sosunov E.A., Anyukhovsky E.P., Rosen M.R., Balke C.W., Efimov I.R. Application of blebbistatin as an excitation-contraction uncoupler for electrophysiologic study of rat and rabbit hearts. Heart Rhythm. 2007;4:619–626. doi: 10.1016/j.hrthm.2006.12.047. [DOI] [PubMed] [Google Scholar]
- Feinberg A.W., Feigel A., Shevkoplyas S.S., Sheehy S., Whitesides G.M., Parker K.K. Muscular thin films for building actuators and powering devices. Science. 2007;317:1366–1370. doi: 10.1126/science.1146885. [DOI] [PubMed] [Google Scholar]
- Feinberg A.W., Alford P.W., Jin H., Ripplinger C.M., Werdich A.A., Sheehy S.P., Grosberg A., Parker K.K. Controlling the contractile strength of engineered cardiac muscle by hierarchal tissue architecture. Biomaterials. 2012;33:5732–5741. doi: 10.1016/j.biomaterials.2012.04.043. [DOI] [PMC free article] [PubMed] [Google Scholar]
- Fink D.W., Jr. FDA regulation of stem cell-based products. Science. 2009;324:1662–1663. doi: 10.1126/science.1173712. [DOI] [PubMed] [Google Scholar]
- Fox J.L. Human iPSC and ESC translation potential debated. Nat. Biotechnol. 2011;29:375–376. doi: 10.1038/nbt0511-375a. [DOI] [PubMed] [Google Scholar]
- Gao W.D., Perez N.G., Marban E. Calcium cycling and contractile activation in intact mouse cardiac muscle. J. Physiol. 1998;507:175–184. doi: 10.1111/j.1469-7793.1998.175bu.x. [DOI] [PMC free article] [PubMed] [Google Scholar]
- Grosberg A., Alford P.W., McCain M.L., Parker K.K. Ensembles of engineered cardiac tissues for physiological and pharmacological study: heart on a chip. Lab Chip. 2011;11:4165–4173. doi: 10.1039/c1lc20557a. [DOI] [PMC free article] [PubMed] [Google Scholar]
- Grosberg A., Kuo P.-L., Guo C.-L., Geisse N.A., Bray M.-A., Adams W.J., Sheehy S.P., Parker K.K. Self-organization of muscle cell structure and function. PLoS Comput. Biol. 2011;7:e1001088. doi: 10.1371/journal.pcbi.1001088. [DOI] [PMC free article] [PubMed] [Google Scholar]
- Herron T.J., Lee P., Jalife J. Optical imaging of voltage and calcium in cardiac cells & tissues. Circ. Res. 2012;110:609–623. doi: 10.1161/CIRCRESAHA.111.247494. [DOI] [PMC free article] [PubMed] [Google Scholar]
- Kléber A.G., Rudy Y. Basic mechanisms of cardiac impulse propagation and associated arrhythmias. Physiol. Rev. 2004;84:431–488. doi: 10.1152/physrev.00025.2003. [DOI] [PubMed] [Google Scholar]
- Kuczynski W., Zywucki B., Malecki J. Determination of orientational order parameter in various liquid-crystalline phases. Mol. Cryst. Liq. Cryst. 2002;381:1–19. [Google Scholar]
- LoRusso S.M., Rhee D., Sanger J.M., Sanger J.W. Premyofibrils in spreading adult cardiomyocytes in tissue culture: evidence for reexpression of the embryonic program for myofibrillogenesis in adult cells. Cell Motil. Cytoskeleton. 1997;37:183–198. doi: 10.1002/(SICI)1097-0169(1997)37:3<183::AID-CM1>3.0.CO;2-8. [DOI] [PubMed] [Google Scholar]
- Maltsev V.A., Wobus A.M., Rohwedel J., Bader M., Hescheler J. Cardiomyocytes differentiated in vitro from embryonic stem cells developmentally express cardiac-specific genes and ionic currents. Circ. Res. 1994;75:233–244. doi: 10.1161/01.res.75.2.233. [DOI] [PubMed] [Google Scholar]
- McCain M.L., Parker K.K. Mechanotransduction: the role of mechanical stress, myocyte shape, and cytoskeletal architecture on cardiac function. Pflugers Arch. 2011;462:89–104. doi: 10.1007/s00424-011-0951-4. [DOI] [PubMed] [Google Scholar]
- McCain M.L., Sheehy S.P., Grosberg A., Goss J.A., Parker K.K. Recapitulating maladaptive, multiscale remodeling of failing myocardium on a chip. Proc. Natl. Acad. Sci. USA. 2013;110:9770–9775. doi: 10.1073/pnas.1304913110. [DOI] [PMC free article] [PubMed] [Google Scholar]
- Mummery C.L., Zhang J., Ng E.S., Elliott D.A., Elefanty A.G., Kamp T.J. Differentiation of human embryonic stem cells and induced pluripotent stem cells to cardiomyocytes: a methods overview. Circ. Res. 2012;111:344–358. doi: 10.1161/CIRCRESAHA.110.227512. [DOI] [PMC free article] [PubMed] [Google Scholar]
- Ng S.Y., Wong C.K., Tsang S.Y. Differential gene expressions in atrial and ventricular myocytes: insights into the road of applying embryonic stem cell-derived cardiomyocytes for future therapies. Am. J. Physiol. Cell Physiol. 2010;299:C1234–C1249. doi: 10.1152/ajpcell.00402.2009. [DOI] [PubMed] [Google Scholar]
- Placzek M.R., Chung I.M., Macedo H.M., Ismail S., Mortera Blanco T., Lim M., Cha J.M., Fauzi I., Kang Y., Yeo D.C.L. Stem cell bioprocessing: fundamentals and principles. J. R. Soc. Interface. 2009;6:209–232. doi: 10.1098/rsif.2008.0442. [DOI] [PMC free article] [PubMed] [Google Scholar]
- Rezakhaniha R., Agianniotis A., Schrauwen J.T.C., Griffa A., Sage D., Bouten C.V.C., van de Vosse F.N., Unser M., Stergiopulos N. Experimental investigation of collagen waviness and orientation in the arterial adventitia using confocal laser scanning microscopy. Biomech. Model. Mechanobiol. 2012;11:461–473. doi: 10.1007/s10237-011-0325-z. [DOI] [PubMed] [Google Scholar]
- Rubin L.L. Stem cells and drug discovery: the beginning of a new era? Cell. 2008;132:549–552. doi: 10.1016/j.cell.2008.02.010. [DOI] [PubMed] [Google Scholar]
- Sartiani L., Bettiol E., Stillitano F., Mugelli A., Cerbai E., Jaconi M.E. Developmental changes in cardiomyocytes differentiated from human embryonic stem cells: a molecular and electrophysiological approach. Stem Cells. 2007;25:1136–1144. doi: 10.1634/stemcells.2006-0466. [DOI] [PubMed] [Google Scholar]
- Schmittgen T.D., Livak K.J. Analyzing real-time PCR data by the comparative C(T) method. Nat. Protoc. 2008;3:1101–1108. doi: 10.1038/nprot.2008.73. [DOI] [PubMed] [Google Scholar]
- Sheehy S.P., Grosberg A., Parker K.K. The contribution of cellular mechanotransduction to cardiomyocyte form and function. Biomech. Model. Mechanobiol. 2012;11:1227–1239. doi: 10.1007/s10237-012-0419-2. [DOI] [PMC free article] [PubMed] [Google Scholar]
- Stuyvers B.D., McCulloch A.D., Guo J., Duff H.J., ter Keurs H.E.D.J. Effect of stimulation rate, sarcomere length and Ca(2+) on force generation by mouse cardiac muscle. J. Physiol. 2002;544:817–830. doi: 10.1113/jphysiol.2002.024430. [DOI] [PMC free article] [PubMed] [Google Scholar]
- Thomas S.P., Bircher-Lehmann L., Thomas S.A., Zhuang J., Saffitz J.E., Kléber A.G. Synthetic strands of neonatal mouse cardiac myocytes: structural and electrophysiological properties. Circ. Res. 2000;87:467–473. doi: 10.1161/01.res.87.6.467. [DOI] [PubMed] [Google Scholar]
- Thomson H. Bioprocessing of embryonic stem cells for drug discovery. Trends Biotechnol. 2007;25:224–230. doi: 10.1016/j.tibtech.2007.03.003. [DOI] [PubMed] [Google Scholar]
- Webb S. The gold rush for induced pluripotent stem cells. Nat. Biotechnol. 2009;27:977–979. doi: 10.1038/nbt1109-977. [DOI] [PubMed] [Google Scholar]
- Weinberg S., Lipke E.A., Tung L. In vitro electrophysiological mapping of stem cells. Methods Mol. Biol. 2010;660:215–237. doi: 10.1007/978-1-60761-705-1_14. [DOI] [PubMed] [Google Scholar]
- Wobus A.M., Löser P. Present state and future perspectives of using pluripotent stem cells in toxicology research. Arch. Toxicol. 2011;85:79–117. doi: 10.1007/s00204-010-0641-6. [DOI] [PMC free article] [PubMed] [Google Scholar]
- Zhang X.D. A pair of new statistical parameters for quality control in RNA interference high-throughput screening assays. Genomics. 2007;89:552–561. doi: 10.1016/j.ygeno.2006.12.014. [DOI] [PubMed] [Google Scholar]
Associated Data
This section collects any data citations, data availability statements, or supplementary materials included in this article.