

Abstract
Background
The magnitude of the ‘white coat effect’, the alerting rise in blood pressure, is greater for doctors than nurses. This could bias interpretation of studies on nurse-led care in hypertension, and risks overestimating or overtreating high blood pressure by doctors in clinical practice.
Aim
To quantify differences between blood pressure measurements made by doctors and nurses.
Design and setting
Systematic review and meta-analysis using searches of MEDLINE, CENTRAL, CINAHL, Embase, journal collections, and conference abstracts.
Method
Studies in adults reporting mean blood pressures measured by doctors and nurses at the same visit were selected, and mean blood pressures extracted, by two reviewers. Study risk of bias was assessed using modified Cochrane criteria. Outcomes were pooled across studies using random effects meta-analysis.
Results
In total, 15 studies (11 hypertensive; four mixed hypertensive and normotensive populations) were included from 1899 unique citations. Compared with doctors’ measurements, nurse-measured blood pressures were lower (weighted mean differences: systolic −7.0 [95% confidence interval {CI} = −4.7 to −9.2] mmHg, diastolic −3.8 [95% CI = −2.2 to −5.4] mmHg). For studies at low risk of bias, differences were lower: systolic −4.6 (95% CI = −1.9 to −7.3) mmHg; diastolic −1.7 (95% CI = −0.1 to −3.2) mmHg. White coat hypertension was diagnosed more frequently based on doctors’ than on nurses’ readings: relative risk 1.6 (95% CI =1.2 to 2.1).
Conclusions
The white coat effect is smaller for blood pressure measurements made by nurses than by doctors. This systematic difference has implications for hypertension diagnosis and management. Caution is required in pooling data from studies using both nurse- and doctor-measured blood pressures.
Keywords: blood pressure determination, primary health care, white coat hypertension, white coat syndrome
INTRODUCTION
The ‘white coat effect, or syndrome’ describes an elevation in blood pressure above a patient’s normal levels in association with a clinic or surgery visit. It occurs in up to 75% of patients with hypertension in tertiary care settings1,2 and may be universal, being also observed in normotension.3,4 It is distinct from ‘white coat hypertension’, which defines the subset of patients with blood pressures above hypertensive thresholds in the clinic but not in other settings.4,5 The white coat effect is more prevalent with older age, female sex, and is associated with anxiety and dementia.6,7 A large white coat effect (>30 mmHg systolic rise) has been associated with metabolic risk factors and independently predicts total and cardiovascular mortality;8 however all-cause mortality is lower for white coat than for sustained hypertension.9,10
The white coat effect for inpatients is higher when a doctor measures their blood pressure than when a nurse does.2 Systematic reviews have suggested that nurse-led care in hypertension appears to achieve lower outcome blood pressures compared with doctor-led or usual care.11–13 Half of the studies contributing to this finding in a previous review reported outcome blood pressures measured by the doctors or nurses themselves.12 These findings could be biased if the white coat effect is larger for doctors than the nurses. Nurse-led care of hypertension is becoming the predominant model in primary care, despite a limited evidence base.14,15 If blood pressures measured by nurses are indeed systematically lower than doctors’ readings, then that evidence base could be challenged as simply presenting evidence of the white coat effect in action. In clinical practice the risks of overdiagnosis and inappropriately treating hypertension based on such elevated doctors’ measurements must also be considered.16,17 As part of a continuing review of allied health professional-led hypertension care, this review was undertaken to quantify the magnitude of any difference in white coat effect between doctors and nurses.18
METHOD
This systematic review was conducted and reported in accordance with the MOOSE (Meta-analysis Of Observational Studies in Epidemiology) statement.19
Data sources and selection criteria
MEDLINE, CINAHL, Embase, and the Cochrane Central Register of Controlled Trials (CENTRAL) were searched from their respective start dates to 1 September 2011 using the text words ‘white coat’. Additional citations were identified from reference lists of full texts included in the review. Searches of individual journal collections (American Journal of Hypertension, Blood Pressure Monitoring, Hypertension, Journal of Human Hypertension, Journal of Hypertension), conference abstracts, and personal reference archives were also undertaken. No language restrictions were applied. Search updates for new publications were run until 30 September 2013.
How this fits in
Blood pressure measurements are elevated in the presence of a health professional — the ‘white coat effect’ — and this appears to be greater for doctors than for nurses. There is evidence for lower blood pressure outcomes in nurse-led clinics for hypertension compared with usual care by doctors, but the white coat effect is not taken into account in many such studies. This is the first systematic review to compare blood pressure measurements made by doctors and nurses; there is evidence that blood pressures recorded by doctors are systematically higher than those recorded by nurses within the same setting. The findings suggest that studies comparing doctor and nurse interventions require independent outcome measures to avoid bias, and that doctor-measured blood pressures may introduce bias into clinical decision making in hypertension.
Studies were sought reporting blood pressures measured by doctors and nurses during the same clinic visit, for adults aged ≥18 years with or without hypertension. Primary outcome measures were mean systolic and diastolic blood pressures measured by nurses and by doctors or differences between them, and proportions of patients diagnosed with white coat hypertension (defined as clinic blood pressure >20/10 mmHg higher than ambulatory or home-measured blood pressure), according to blood pressure measurements by doctors and nurses.
One author screened retrieved citations and abstracts for potentially relevant studies and a second author checked the selections. Studies assessed as definite or uncertain for inclusion were retrieved in full.
Data extraction and risk of bias assessment
Data were extracted independently by two reviewers using a standardised electronic form (available from the authors on request); treating hypertensive and normotensive subgroups as separate cohorts. Given the observational nature of studies, Cochrane risk of bias criteria20 were modified to assess study risk of bias on the basis of three relevant criteria: random order of doctor and nurse measurement, blinding of doctors and nurses to measurements made by each other, and blinding of outcome assessment by use of automated or random-zero sphygmomanometers. Level of risk of bias was scored as: high (2 points), unclear (1 point), or low (0 points), then summarised as a dichotomous overall risk of bias judgment of ‘high’ (total ≥3 points) or ‘low’ (<3 points).
Statistical analysis
Data were pooled and analysed using RevMan version 5.1 (The Cochrane Collaboration, Copenhagen, 2011). Analyses were undertaken for differences in mean systolic and diastolic blood pressure measurements between doctors and nurses. Because of the paired nature of the data (doctors and nurses measuring the same individuals), the standard errors of the mean differences between doctors’ and nurses’ blood pressure measurements were adjusted for within person correlations using published coefficients (that is, 0.771 for systolic blood pressure and 0.748 for diastolic blood pressure) in accordance with Cochrane Handbook methods.20,21,22 For dichotomous outcome measures effects, relative risks (RR) with 95% confidence intervals (CIs) were calculated. Heterogeneity between study populations was anticipated, therefore a decision was made to pool studies using random effects meta-analysis. A fixed effect model was included as a sensitivity analysis. Where required, standard deviations were calculated from standard errors or CIs presented within papers, and for one study imputed missing standard deviations from matching studies were used according to Cochrane Handbook methods.20 Heterogeneity was quantified using the I2 statistic and the χ2 test of heterogeneity. Heterogeneity was formally explored in stratified analysis by overall risk of bias assessment and by study population. Where possible, study results were pooled separately by subject age and sex subgroups. Small study bias was assessed by visual inspection of Funnel plots, and tested using the method of Egger et al.23,24
RESULTS
Searches identified 1899 unique potential citations and 11 were identified through other sources, 32 were selected for full text assessment, and 15 contributed data to meta-analyses (Figure 1).
Figure 1.
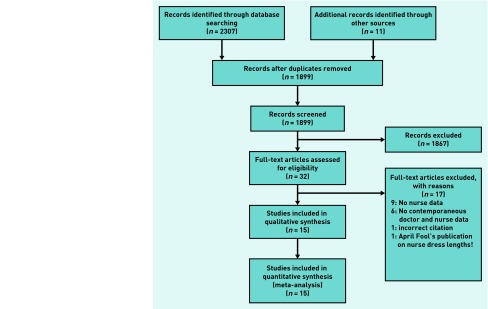
Flow chart of review.
Included studies
Characteristics of included studies are described in Table 1. Eleven studies recruited hypertensive subjects from primary health care25,26 or secondary care clinic settings;27–35 others recruited a combination of normotensive and hypertensive subjects.36–39 Studies excluded after assessment are available from the authors on request.
Table 1.
Characteristics of included studies
| First author and location | Year | Participants Total (male:female), Mean (SD) age | Measurement method | Randomised order of measurement | Blinding of doctors and nurses measurements | Blinding of outcome assessment | Summary risk of bias judgment | Notes |
|---|---|---|---|---|---|---|---|---|
| Bo38 Turin, Italy | 2008 | 224, (96:128) subjects attending lipid clinic, age 59.8 (13.2) years. 110 on antihypertensive treatment | Standard mercury sphygmomanometer and appropriately sized cuff. Mean of three consecutive readings after 5 minutes rest | No | Unclear | No | High | Same protocol for doctors and nurses |
| Bo39 Turin, Italy | 2009 | 273 (109:164) patients age 72.6 (9.7) years. 84.2 on antihypertensive treatment, referred to hospital Alzheimer Evaluation Unit | Nurse readings obtained 15 minutes before and 10 minutes after physician readings using same protocol | No | Unclear | No | High | Nurse before doctor data extracted, nurse after doctor data not significantly different |
| Culleton29 Calgary, Canada | 2006 | 107 (50:57) hypertensives age 57 (12) years referred for ABPM | Nurse measured BP twice, 5 minutes apart, after 5minutes rest, with mercury sphygmomanometer. Patients were seen within 3 hours by own family physician for a usual BP measurement |
No | Yes | No | High | Probably different protocols: Doctors’ ‘usual measurement’ protocol not described |
| de Blok30 Amsterdam, Netherlands | 1991 | 31 (13:17) patients with suspected hypertension age 43 years (range 17–63) referred to specialist hypertension clinic | Three readings collected after 5 minutes resting seated with random zero sphygmomanometer BP measurement by doctor and nurse in random order |
Yes | Unclear | Yes | Low | Same protocol for doctors and nurses. Conference abstract only. Sex data do not = 100%; reported as stated in paper |
| Gerin31 New York US | 2001 | 27 (9:18) patients age 57.6 (11.6) years attending hypertension clinic | Hawkesly random zero sphygmomanometer used by physicians and nurses to measure BP after 5 minutes rest seated. Mean of three measurements recorded at two visits 1 week apart | Unclear | Unclear | Yes | Low | Same protocol for doctors and nurses. Order of measurement was varied at visits; randomisation not described |
| Gil28 Alicante Spain | 1994 | 50 (13:37) hypertensives in hospital clinic age 59.3 (7.9) years and 50 (23:27) years randomly selected non-hypertensive clinic attendees age 47.2 (10.1) years | BP measured by mercury sphygmomanometer after 5 minutes rest. Doctors measured BP first then nurses | No | Unclear | No | High | Same protocol for doctors and nurses. Spanish text English abstract: translated by CEC |
| Kumpusalo25 Kuopio, Finland | 2002 | 148 (64:84) hypertensives age 59.2 years visiting one of six primary healthcare centres | BP measured twice with mercury sphygmomanometer and twice with Omrom HEM 705 (graded B/A by BHS). Means of all readings recorded | Yes | Unclear | Yes | Low | Same protocol for doctors and nurses Only doctor and nurse means from automated recordings extracted for analyses |
| La Batide-Alanore32 Broussais Hospital, Paris | 2000 | 1062 (525:537) patients referred to hypertension clinic (2/3 on treatment). Age 51.8 (13.7) years | Nurses measured three BPs with 5-minute intervals using oscillometric device (Press Mate BP 880 Colin; graded B/B by BHS), patients lying supine. Then physicians measured BP with mercury sphygmomanometer after a mean of 15 minutes lying horizontally | No | Yes | No | High | Different measurement protocols for nurse and doctor |
| Labinson et al.26 Connecticut, US | 2008 | 65 (29:36) African-American hypertensives age 53.6 (12.7) years recruited from primary care centre | Clinic BP measured x3 with mercury sphygmomanometer by white male study physician and white female study nurse. All wore white coats. Mean of three readings for each observer | Yes | Unclear | Unclear | Low | Same protocol for doctors and nurses. BP also measured by African–American male study physician (data not extracted), to assess effect of race of doctor |
| Mansoor et al.33 University of Connecticut, US | 1996 | 64 hypertensives (23:41), mean age 65 (12) years; 59% on treatment referred to health centre for ABPM | Two BP readings with mercury sphygmomanometer, sitting after 10 minutes rest | Yes | Yes | Unclear | Low | Same protocol for doctors and nurses |
| Richardson and Robinson37 London, England | 1971 | 372 men attending clinic for BUPA health screening | Nurses then doctors recorded supine BP within 1 hour with mercury sphygmomanometers | No | Unclear | No | High | Probably the same protocol for doctors and nurses |
| Salvador et al.35 Toulouse, France | 1990 | 28 hypertensives (19:9), mean age 46 (12) years enrolled in study of β blockade on alerting reaction | Nurse measured BP with automated monitor seated after 10 minutes rest. Patients spent 12 minutes on an automated oscillometric monitor (data not extracted) then physician measured BP with mercury sphygmomanometer after 5 minutes rest | No | Unclear | No | High | Different measurement protocols for nurse and doctor. Original article in French; translated by CEC Model of automated sphygmomanometer not stated |
| Sokolovic et al.36 Sarajevo, Bosnia Herzegovina | 2012 | 120 patients (35:85), mean age 47.2 years (No SD) recruited to a prospective clinical trial. Normotensive and hypertensive subgroups | BP first measured by physician then 15 minutes later by nurse | No | Unclear | Unclear | High | Poster abstract only, no further detail available. Authors contacted but no reply. SD imputed from matched studies |
| Veerman and van Montfrans27 Amsterdam, Netherlands | 1992 | 110 consecutive patients with hypertension on treatment (55:55) mean age 46 (range 22–80) referred to specialist clinic for ABPM. | Patients seated quietly for 10 minutes had three readings made within 5 minutes with a Hawkesly random zero sphygmomanometer | Yes | Unclear | Yes | Low | Same protocol for doctors and nurses |
| Yoon et al.34 Korea | 2010 | 1019 treated hypertensives (488:531) mean age 56 (10) from nine hospital clinics | BP measured with Omron HEM 747, mean of two measurements after 2 minutes rest seated | Unclear | Unclear | Yes | Low | Same protocol doctors and nurses. Hypertensives had no change of drugs in previous 6 months |
ABPM = Ambulatory blood pressure monitoring. BP = blood pressure.
Risk of bias in included studies
Most studies used mercury sphygmomanometers;26,27,28–31,33,37–40 three used random zero machines;27,30,31 three used automated sphygmomanometers;32,34,35 and one study averaged mercury and automated readings.25 Methods were not stated for one study,36 and two adopted different measurement methods for doctors and nurses.32,35 Lack of clear blinding of doctors and nurses to readings by each other was a concern for all but three studies.29,32,33 Summary risk of bias judgments were low for seven studies,25–27,30,31,33,34 and high for the remainder (Table 1).28,29,32,35–39
Differences in blood pressure measurements
Differences in blood pressures measured by doctors and nurses could be pooled for 16 cohorts from 14 studies. Overall systolic measurements by nurses were −7.0 (95% CI = −4.7 to −9.2) mmHg lower than those by doctors; diastolic measurements were −3.8 (95% CI = −2.2 to −5.4) mmHg lower. Pooled differences for studies at low risk of bias25,27,30,31,33,34 were significantly lower than for studies at high risk of bias28,29,32,35–39 for systolic readings: −4.6 (95% CI = −1.9 to −7.3) versus −8.4 (95% CI = −6.3 to −10.4; P = 0.03; Figure 2), and for diastolic readings: −1.7 (95% CI = −0.1 to −3.2) versus −5.0 (95% CI = −3.4 to −6.5; P = 0.003; Figure 3). Considerable heterogeneity existed between studies (I2 statistic >50%) that was not explained by individual outlying studies. However, directions of differences across studies were uniform, and inferences from re-analysis using fixed effect meta-analysis were unchanged (Table 2).
Figure 2.

Differences in systolic pressure (mmHg) measurements for doctors and nurses.
Figure 3.

Differences in diastolic pressure (mmHg) measurements for doctors and nurses.
Table 2.
Comparison of random effects and fixed effect findings for primary outcomes
| Comparison | Random effects (95% CI) | P-value | Fixed effect (95% CI) | P-value |
|---|---|---|---|---|
| Systolic differences | −6.96 (−9.22 to −4.70) | <0.001 | −5.42 (−5.81 to −5.04) | <0.001 |
| Low risk | −4.61 (−7.28 to −1.93) | <0.001 | −2.52 (−3.04 to −2.00) | <0.001 |
| High risk | −8.36 (−10.40 to −6.32) | <0.001 | −8.78 (−9.34 to −8.22) | <0.001 |
| 0.030a | <0.001a | |||
|
| ||||
| Diastolic differences | −3.82 (−5.43 to −2.22) | <0.001 | −2.79 (−3.03 to −2.55) | <0.001 |
| Low risk | −1.68 (−3.22 to −0.14) | <0.001 | −0.69 (−1.02 to −0.36) | <0.001 |
| High risk | −4.96 (−6.48 to −3.43) | <0.001 | −5.18 (−5.54 to −4.83) | <0.001 |
| 0.003a | <0.001a | |||
P-value for differences between high and low risk of bias groups.
Prevalence of white coat hypertension
Four studies reported prevalence of white coat hypertension.26,29,38,39 Pooled prevalences for doctors’ and nurses’ clinic measurements suggested a relative risk of 1.6 (95% CI = 1.2 to 2.1) for diagnosis of white coat hypertension based on doctors’ clinic measurements compared with those of nurses. Heterogeneity between studies was explained by the one small study (n = 65) at low risk of bias,27 which did not demonstrate a significant difference (RR 0.8 [95% CI = 0.4 to 1.4]) in contrast with the studies at high risk of bias (RR 1.7 [95% CI =1.5 to 2.0]; P = 0.04).38,39,41
Stratification by overall risk of bias and hypertension/normotension
Three studies, all at high risk of bias, included normotensive cohorts.28,36,37 Pooled systolic blood pressures were −10.1 (95% CI = −8.2 to −12.0) mmHg lower for nurses compared with doctors. Eleven cohorts (nine studies)25,27,29–35 recruited hypertensive cohorts and pooled systolic blood pressure differences were −5.4 (95% CI = −3.2 to −7.6) mmHg lower for nurses compared with doctors, with no difference between the high and low risk of bias subgroups. The difference for the normotensive subgroup was greater than for the hypertensive subgroups; sensitivity analysis according to risk of bias did not alter this finding (Figure 4). For diastolic differences the comparable values were normotensive: −3.8 (95% CI = −2.4 to −5.2) mmHg lower and hypertensive: −3.8 (95% CI = −1.3 to −6.3) mmHg lower overall for nurses and −1.7 (95% CI = −0.1 to −3.2) for studies at low risk of bias. Two studies were judged as being at high risk of bias because of different blood pressure measurement protocols for doctors and nurses.32,35 Sensitivity analyses showed no effect on the above findings on excluding these two studies from the analyses.
Figure 4.

Systolic BP differences (mmHg) for normotensive and hypertensive cohorts.
Subgroup analyses
Data for three cohorts (two studies) were broken down by sex. Doctor-recorded systolic and diastolic pressures were 2.9 (95% CI = 1.3 to 4.6) mmHg and 1.4 (95% CI = 0.1 to 2.8) mmHg higher than nurse-recorded pressures for female subjects compared with males. There was no significant heterogeneity between the studies, one of which was at high risk of bias,32 the other at low risk.25 Mean age of participants for individual studies ranged from 43 to 73 years.30,39 Sensitivity analysis did not demonstrate any age-related influence on the magnitude of difference in white coat effect.
One study reported lower white coat effects in African–American patients when assessed by African–American doctors than by white doctors; no comparative data was found on ethnicity for doctors and nurses.29
Small study bias
No substantive funnel plot asymmetry was observed (available from the authors on request) and Egger’s tests were not significant for either systolic (P = 0.083) or diastolic (P = 0.332) differences in blood pressure measurements between doctors and nurses, suggesting no strong evidence of small study effects or publication bias.
DISCUSSION
Summary
This review shows that systolic and diastolic blood pressure measurements made by nurses are systematically lower compared with doctors’ measurements. A difference is seen with or without hypertension, but is smaller when risk of study bias is accounted for. Differences in these measurements appear to be greater for female than for male study participants. Rates of diagnosis for white coat hypertension based on readings made by doctors are higher compared with nurses.
Strengths and limitations
This is the first systematic review to assess the different effects of doctors and nurses on blood pressure measurement. The aim was to minimise bias and confounding caused by blood pressure variation by excluding studies where doctors’ and nurses’ measurements were not collected contemporaneously.2,8,42–45 The text word search strategy was deliberately simple and designed to be inclusive; however, ‘white coat’ has other clinical connotations such as physician attire or infection control, thus large numbers of citations had to be excluded on initial screening of titles and abstracts. The strategy risked omitting studies employing synonyms for white coat hypertension or effects, therefore extensive hand searching was undertaken to explore this. The small number of additional citations identified through this process (11 out of 1899) suggests that the searches were adequate. Relevant other data from baseline analyses of longitudinal studies not designed to study white coat effects may exist; however, none have been identified in the numerous (almost 200) studies assessed for previous and current intervention reviews of nurse and allied health professional-led hypertension care.12,13,18 Searches for unpublished data were not undertaken; however, no substantive evidence was found of small study or publication bias.23,24,46 No language restrictions applied; included studies reported a range of clinic settings in 10 countries, therefore it is believed that these results can be generalised to any healthcare setting where adult blood pressures are measured. Study selections were checked and agreed by a second author; independent selection by both authors is preferable but was precluded by available resources.
A conservative selection approach was used to minimise erroneous exclusion of potentially relevant studies. Heterogeneity observed between studies for the primary outcomes was not fully explained within the sensitivity analyses. Residual heterogeneity is not uncommon in meta-analyses of observational studies;46 and may reflect the diversity of study populations and settings. Only one study reported lower blood pressures measured by doctors than nurses for each outcome,33,35 Re-analysis using a fixed effect model did not alter the inference of the present findings.
Comparison with existing literature
Different effects of doctors and nurses on the alerting rise in blood pressure have been previously reported,2,47 but not acknowledged as a confounding variable in studies of nurse-led care.11–13,48 The magnitude of difference in blood pressure readings demonstrated here is similar to the improvements in blood pressure that this and other research groups have previously attributed to nurse-led care.11–13 Therefore, it is believed that some caution is needed in interpretation of previous studies reporting outcome blood pressure measurements made by doctors and nurses, as opposed to independently assessed blood pressure outcomes.
Previous studies have associated an increased prevalence of white coat hypertension with female sex,4,49,50 particularly when measured by a male.6,51 This review also associated larger white coat effects with female than with male subjects, although the data did not allow unravelling of the interplay between sex of clinician and patient. Recent work on the physiology of alerting response has demonstrated reduced pressor and tachycardic responses to nurses’ blood pressure measurements in comparison with doctors and attenuated adrenergic responses for nurses.52
Older age has also been associated with an increased prevalence of white coat hypertension;4,6,50 however, essential hypertension is also a condition of older age.53 White coat effect is correlated with higher systolic clinic blood pressures and declining renal function; both also features of ageing.54 No significant trend was found towards higher differences of white coat effect with older age groups. White ethnicity may also be associated with white coat effects;54 however, this review did not identify sufficient data from different ethnic backgrounds to answer this question.
Greater differences were observed between doctors’ and nurses’ readings where study risk of bias was high. Inaccuracies in blood pressure measurement technique are associated with overestimation of white coat effect,29 and adequate randomisation and blinding in blood pressure studies is important in minimising overestimation of effect sizes.55,56
Implications for research and practice
These results suggest that future studies comparing doctor and nurse-led care require an independent outcome assessment to avoid bias caused by a differential white coat effect; this aspect of methodology must be assessed when considering risk of bias.18 Thorough reporting of the protocol for blood pressure measurement for all future publications on hypertension would facilitate this. It is believed that recent guidance regarding the use of ambulatory and automated measurement of blood pressure is likely to improve reliability and consistency of diagnosis of hypertension.57 Further studies are required to fully assess the effects and interaction of clinician and patient sex and ethnic group, and to clarify the independent effect of age on white coat effects.
Nurses’ blood pressure readings are better predictors of early target organ damage in hypertension than doctors’ readings,58 but they do not eliminate the white coat effect compared with home or ambulatory readings.27,31,38,39,42,43 Automated office blood pressure readings may yield readings lower than those obtained in the presence of health professionals by reducing (but not abolishing) white coat effects.59–61 The setting for blood pressure measurement also contributes to the effect,13 as observed in other community settings such as pharmacies.62
Most modern studies on treating hypertension use nurses or ‘trained observers’ to measure blood pressure, and guidelines are based on evidence from such studies.16 Careful use of protocols by trained research staff results in manual blood pressure measurements that correlate much better with ambulatory readings than doctors’measurements.63 Therefore, the relevance of doctors’ measurements to evidence- or guideline-based treatment decisions has been questioned,16,64 and their value debated.16,57,65 Nevertheless, current UK guidelines advocate clinic measurements (by doctors or other healthcare professionals) for monitoring of hypertension, unless white coat hypertension is diagnosed,66 introducing an inherent risk of bias in the light of these findings.
New 2013 European guidelines also still regard office blood pressure measurement as the ‘gold standard’ for screening, diagnosis, and managing hypertension.67 Although the UK 2011 guidelines promote use of home or ambulatory blood pressure readings for diagnosis, entry to the diagnostic pathway for hypertension relies initially on surgery-based readings, thus the risk of misclassification and inappropriate treatment with inaccurate initial blood pressure readings45 remains a clinical concern if doctors are systematically recording higher blood pressures than nurses.68 Little proposed a decade ago that ‘It is time to stop using high blood pressure readings documented by GPs to make treatment decisions’;69 the present findings support this statement.
Acknowledgments
We wish to thank Mrs Joy Choules, and the staff of Exeter Medical Library, for their assistance in obtaining the full text papers for this review. The protocol for this review is registered with the PROSPERO database; record no: CRD42012002677: http://www.crd.york.ac.uk/PROSPERO/display_record.asp?ID=CRD42012002677.
Funding
We acknowledge funding from the National Institute for Health Research Peninsula Collaboration for Leadership in Applied Health Research and Care (PenCLAHRC), NHS Cambridgeshire (research capability funding), and the South West General Practice Trust. The views and opinions expressed in this paper are those of the authors and not necessarily those of the NHS, the NIHR or the Department of Health.
Ethical approval
Not applicable.
Provenance
Freely submitted; externally peer reviewed.
Competing interests
The authors have declared no competing interests.
Discuss this article
Contribute and read comments about this article: www.bjgp.org/letters
REFERENCES
- 1.Myers MG, Reeves RA. White coat phenomenon in patients receiving antihypertensive therapy. Am J Hypertens. 1991;4(10 Pt 1):844–849. doi: 10.1093/ajh/4.10.844. [DOI] [PubMed] [Google Scholar]
- 2.Mancia G, Parati G, Pomidossi G, et al. Alerting reaction and rise in blood pressure during measurement by physician and nurse. Hypertension. 1987;9(2):209–215. doi: 10.1161/01.hyp.9.2.209. [DOI] [PubMed] [Google Scholar]
- 3.Mancia G, Grassi G, Pomidossi G, et al. Effects of blood-pressure measurement by the doctor on patient’s blood pressure and heart rate. Lancet. 1983;322(8352):695–698. doi: 10.1016/s0140-6736(83)92244-4. [DOI] [PubMed] [Google Scholar]
- 4.Pickering TG, Gerin W, Schwartz AR. What is the white-coat effect and how should it be measured? Blood Press Monit. 2002;7(6):293–300. doi: 10.1097/00126097-200212000-00001. [DOI] [PubMed] [Google Scholar]
- 5.Pickering TG, Coats A, Mallion JM, et al. Task Force V: White-coat hypertension. Blood-Press-Monit. 1999;4(6) doi: 10.1097/00126097-199912000-00006. [DOI] [PubMed] [Google Scholar]
- 6.Alves LM, Nogueira MS, Veiga EV, de GS, Carnio EC. White coat hypertension and nursing care. Can J Cardiovasc Nurs. 2003;13(3):29–34. [PubMed] [Google Scholar]
- 7.Dolan E, Stanton A, Atkins N, et al. Determinants of white-coat hypertension... Proceedings from the ‘European Society of Hypertension Working Group on Blood Pressure Monitoring Scientific Workshop: What’s New in Blood Pressure Measurement?’; held June 2004 in Paris, France. Blood-Press-Monit. 2004;9(6):307–310. [Google Scholar]
- 8.Strandberg TE, Salomaa V. White coat effect, blood pressure and mortality in men: prospective cohort study. Eur Heart J. 2000;21(20):1714–1718. doi: 10.1053/euhj.1999.2042. [DOI] [PubMed] [Google Scholar]
- 9.Dawes MG, Bartlett G, Coats AJ, Juszczak E. Comparing the effects of white coat hypertension and sustained hypertension on mortality in a UK primary care setting. Ann Fam Med. 2008;6(5):390–396. doi: 10.1370/afm.865. [DOI] [PMC free article] [PubMed] [Google Scholar]
- 10.Imai Y. Prognostic significance of ambulatory blood pressure. Blood Press Monit. 1999;4(5):249–256. [PubMed] [Google Scholar]
- 11.Glynn LG, Murphy AW, Smith SM, et al. Interventions used to improve control of blood pressure in patients with hypertension. In: Cochrane Collaboration, editor. The Cochrane Library. Oxford: Update Software; 2010. Issue 3. [DOI] [PubMed] [Google Scholar]
- 12.Clark CE, Smith LFP, Taylor RS, Campbell JL. Nurse led interventions to improve control of blood pressure in people with hypertension: systematic review and meta-analysis. BMJ. 2010;341(aug23_1):c3995. doi: 10.1136/bmj.c3995. [DOI] [PMC free article] [PubMed] [Google Scholar]
- 13.Clark CE, Smith LFP, Taylor RS, Campbell JL. Nurse led interventions to improve control of high blood pressure in people with diabetes: a systematic review and meta-analysis. Diabet Med. 2011;28(3):250–261. doi: 10.1111/j.1464-5491.2010.03204.x. [DOI] [PubMed] [Google Scholar]
- 14.Clark CE, Smith LFP, Harding G, et al. Nurse led hypertension clinics: evolving ahead of the evidence? J Hum Hypertens. 2011;25(S1)(10):S6. [Google Scholar]
- 15.Laurant M, Reeves D, Hermens R, et al. Substitution of doctors by nurses in primary care. In: Cochrane Collaboration, editor. The Cochrane Library. Oxford: Update Software; 2004. Issue 4. [DOI] [PubMed] [Google Scholar]
- 16.Graves JW, Sheps SG. Does evidence-based medicine suggest that physicians should not be measuring blood pressure in the hypertensive patient? Am J Hypertens. 2004;17(4):354–360. doi: 10.1016/j.amjhyper.2003.12.007. [DOI] [PubMed] [Google Scholar]
- 17.Lovibond K, Jowett S, Barton P, et al. Cost-effectiveness of options for the diagnosis of high blood pressure in primary care: a modelling study. Lancet. 2011;378(9798):1219–1230. doi: 10.1016/S0140-6736(11)61184-7. [DOI] [PubMed] [Google Scholar]
- 18.Clark CE, Smith LFP, Glynn LG, et al. Allied health professional-led interventions for improving control of blood pressure in patients with hypertension [Protocol] Cochrane Database Syst Rev. 2011;11:CD009410. doi: 10.1002/14651858.CD009410. [DOI] [Google Scholar]
- 19.Stroup DF, Berlin JA, Morton SC, et al. Meta-analysis of observational studies in epidemiology: a proposal for reporting. Meta-analysis Of Observational Studies in Epidemiology (MOOSE) group. JAMA. 2000;283(15):2008–2012. doi: 10.1001/jama.283.15.2008. [DOI] [PubMed] [Google Scholar]
- 20.Higgins JPT, Green S. Cochrane handbook for systematic reviews of interventions. In: Cochrane Collaboration, editor. The Cochrane Library. Oxford: Update Software; 2011. Issue 5.1.0. [Google Scholar]
- 21.Rao JN, Scott AJ. A simple method for the analysis of clustered binary data. Biometrics. 1992;48(2):577–585. [PubMed] [Google Scholar]
- 22.Chapman JM, Clark VA, Coulson AH, Browning GG. Problems of measurement in blood pressure surveys: inter-observer differences in blood pressure determinations. Am J Epidemiol. 1966;84(3):483–494. doi: 10.1093/oxfordjournals.aje.a120661. [DOI] [PubMed] [Google Scholar]
- 23.Sterne JAC, Sutton AJ, Ioannidis JPA, et al. Recommendations for examining and interpreting funnel plot asymmetry in meta-analyses of randomised controlled trials. BMJ. 2011;343 doi: 10.1136/bmj.d4002. [DOI] [PubMed] [Google Scholar]
- 24.Egger M, Davey SG, Schneider M, Minder C. Bias in meta-analysis detected by a simple, graphical test. BMJ. 1997;315(7109):629–634. doi: 10.1136/bmj.315.7109.629. [DOI] [PMC free article] [PubMed] [Google Scholar]
- 25.Kumpusalo E, Teho A, Laitila R, Takala J. Janus faces of the white coat effect: blood pressure not only rises, it may also fall. J Hum Hypertens. 2002;16(10):725–728. doi: 10.1038/sj.jhh.1001475. [DOI] [PubMed] [Google Scholar]
- 26.Labinson PT, Giacco S, Gift H, et al. The importance of the clinical observer in the development of a white-coat effect in African-American patients with hypertension. Blood Press Monit. 2008;13(3):139–142. doi: 10.1097/MBP.0b013e3282f76713. [DOI] [PubMed] [Google Scholar]
- 27.Veerman DP, van Montfrans GA. Nurse-measured or ambulatory blood pressure in routine hypertension care. J Hypertens. 1993;11(3):287–292. doi: 10.1097/00004872-199303000-00009. [DOI] [PubMed] [Google Scholar]
- 28.Gil V, Martinez JL, Lopez N, et al. [Influence of the place of measurement and of the person who performs it on the control and diagnosis of arterial hypertension] Influencia del lugar de la toma y de quien la realiza en el control y diagnostico de la HTA. Rev Clin Esp. 1994;194(3):152–156. [PubMed] [Google Scholar]
- 29.Culleton BF, McKay DW, Campbell NR. Performance of the automated BpTRU measurement device in the assessment of white-coat hypertension and white-coat effect. Blood Press Monit. 2006;11(1):37–42. doi: 10.1097/01.mbp.0000189794.36230.a7. [DOI] [PubMed] [Google Scholar]
- 30.de Blok K, Veerman DP, Hoek F, et al. Relationship between blood pressure, as measured by a nurse, by a doctor and under basal conditions, and micro-albuminuria and left ventricular mass. J Hypertens Suppl. 1991;9(6):S106–S107. [PubMed] [Google Scholar]
- 31.Gerin W, Marion RM, Friedman R, et al. How should we measure blood pressure in the doctor’s office? Blood Press Monit. 2001;6(5):257–262. doi: 10.1097/00126097-200110000-00006. [DOI] [PubMed] [Google Scholar]
- 32.La Batide-Alanore A, Chatellier G, Bobrie G, et al. Comparison of nurse- and physician-determined clinic blood pressure levels in patients referred to a hypertension clinic: implications for subsequent management. J Hypertens. 2000;18(4):391–398. doi: 10.1097/00004872-200018040-00006. [DOI] [PubMed] [Google Scholar]
- 33.Mansoor GA, McCabe EJ, White WB. Determinants of the white-coat effect in hypertensive subjects. J Hum Hypertens. 1996;10(2):87–92. [PubMed] [Google Scholar]
- 34.Yoon HJ, Ahn Y, Park JB, et al. Are metabolic risk factors and target organ damage more frequent in masked hypertension than in white coat hypertension? Clin Exp Hypertens. 2010;32(7):480–485. doi: 10.3109/10641963.2010.496517. [DOI] [PubMed] [Google Scholar]
- 35.Salvador M, Chamontin B, Begasse F, Guittard J. [Outcome of ‘white coat reaction’ induced by nurse and physician in patients with hypertension treated with a beta blockader (bisoprolol)] Devenir sous beta-bloquant (bisoprolol), de l’effet ‘blouse blanche’ induit chez l’hypertendu par l’infirmiere et le medecin. Arch Mal Coeur Vaiss. 1990;83(8):1115–1118. [PubMed] [Google Scholar]
- 36.Sokolovic S, Sabanovic N, Mislimi F, et al. White coat hypertension in normotensive and hypertensive patients: different results by doctors and nurses. J Hypertens. 2012;30(e-∼Supplement A):e495. [Google Scholar]
- 37.Richardson JF, Robinson D. Variations in the measurement of blood pressure between doctors and nurses. An observational study. J R Coll Gen Pract. 1971;21(113):698–704. [PMC free article] [PubMed] [Google Scholar]
- 38.Bo M, Comba M, Canade A, et al. Clinical implications of white-coat effect among patients attending at a lipid clinic. Atherosclerosis. 2008;197(2):904–909. doi: 10.1016/j.atherosclerosis.2007.08.007. [DOI] [PubMed] [Google Scholar]
- 39.Bo M, Massaia M, Merlo C, et al. White-coat effect among older patients with suspected cognitive impairment: prevalence and clinical implications. Int J Geriatr Psychiatry. 2009;24(5):509–517. doi: 10.1002/gps.2145. [DOI] [PubMed] [Google Scholar]
- 40.Gill JM, Al Mamari A, Ferrell WR, et al. Effects of prior moderate exercise on postprandial metabolism and vascular function in lean and centrally obese men. J Am Coll Cardiol. 2004;44(12):2375–2382. doi: 10.1016/j.jacc.2004.09.035. [DOI] [PubMed] [Google Scholar]
- 41.Culleton BF, McKay DW, Campbell NR. Performance of the automated BpTRU measurement device in the assessment of white-coat hypertension and white-coat effect. Blood Press Monit. 2006;11(1):37–42. doi: 10.1097/01.mbp.0000189794.36230.a7. [DOI] [PubMed] [Google Scholar]
- 42.Porchet M, Bussien JP, Waeber B, et al. Unpredictability of blood pressures recorded outside the clinic in the treated hypertensive patient. J Cardiovasc Pharmacol. 1986;8(2):332–335. doi: 10.1097/00005344-198603000-00016. [DOI] [PubMed] [Google Scholar]
- 43.Myers MG, Oh PI, Reeves RA, Joyner CD. Prevalence of white coat effect in treated hypertensive patients in the community. Am J Hypertens. 1995;8(6):591–597. doi: 10.1016/0895-7061(95)00049-U. [DOI] [PubMed] [Google Scholar]
- 44.Paul L, Jane B, Lucy B, et al. Comparison of agreement between different measures of blood pressure in primary care and daytime ambulatory blood pressure. BMJ. 2002;325 doi: 10.1136/bmj.325.7358.254. [DOI] [PMC free article] [PubMed] [Google Scholar]
- 45.Pickering TG, James GD, Boddie C, et al. How common is white coat hypertension? JAMA. 1988;259(2):225–228. [PubMed] [Google Scholar]
- 46.Egger M, Smith GD, Altman DG. Systematic reviews in health care: meta-analysis in context. 2nd edn. London: BMJ; 2001. [Google Scholar]
- 47.White WB, Baker LH. Episodic hypertension secondary to panic disorder. Arch Intern Med. 1986;146(6):1129–1130. [PubMed] [Google Scholar]
- 48.Fahey T, Schroeder K, Ebrahim S, Glynn L. Interventions used to improve control of blood pressure in patients with hypertension. In: Cochrane Collaboration, editor. The Cochrane Library. Oxford: Update Software; 2005. Issue 1. [DOI] [PubMed] [Google Scholar]
- 49.Martinez MA, Garcia-Puig J, Martin JC, et al. Frequency and determinants of white coat hypertension in mild to moderate hypertension: a primary care-based study. Monitorizacion Ambulatoria de la Presion Arterial (MAPA)-Area 5 Working Group. Am J Hypertens. 1999;12(3):251–259. doi: 10.1016/s0895-7061(98)00262-3. [DOI] [PubMed] [Google Scholar]
- 50.Lindbaek M, Sandvik E, Liodden K, et al. Predictors for the white coat effect in general practice patients with suspected and treated hypertension. Br J Gen Pract. 2003;53(495):790–793. [PMC free article] [PubMed] [Google Scholar]
- 51.Millar JA, Accioly JM. Measurement of blood pressure may be affected by an interaction between subject and observer based on gender. J Hum Hypertens. 1996;10(7):449–453. [PubMed] [Google Scholar]
- 52.Grassi G, Seravalle G, Buzzi S, et al. Muscle and skin sympathetic nerve traffic during physician and nurse blood pressure measurement. J Hypertens. 2013;31(6):1131–1135. doi: 10.1097/HJH.0b013e3283605c71. [DOI] [PubMed] [Google Scholar]
- 53.National Centre for Social Research, Department of Epidemiology and Public Health UMS . Health Survey for England: 2010. NHS Information Centre for Health and Social Care; 2012. [Google Scholar]
- 54.Thomas O, Day K, Martin U, et al. White coat hypertension in treated hypertensive patients and factors influencing it. J Hum Hypertens. 2012;26(10):618. [Google Scholar]
- 55.Odgaard Jensen-J, Vist GE, Timmer A, et al. Randomisation to protect against selection bias in healthcare trials. Cochrane Database Syst Rev. 2011;4:MR000012. doi: 10.1002/14651858.MR000012.pub3. [DOI] [PMC free article] [PubMed] [Google Scholar]
- 56.Savovic J, Jones HE, Altman DG, et al. Influence of reported study design characteristics on intervention effect estimates from randomized, controlled trials. Ann Intern Med. 2012;157(6):429–438. doi: 10.7326/0003-4819-157-6-201209180-00537. [DOI] [PubMed] [Google Scholar]
- 57.Mant J, McManus RJ. Measurement of blood pressure in primary care. BMJ. 2011;342:343–344. doi: 10.1136/bmj.d382. [DOI] [PubMed] [Google Scholar]
- 58.Veerman DP, de Blok K, Delemarre BJ, van Montfrans GA. Office, nurse, basal and ambulatory blood pressure as predictors of hypertensive target organ damage in male and female patients. J Hum Hypertens. 1996;10(1):9–15. [PubMed] [Google Scholar]
- 59.Myers MG, Godwin M, Dawes M, et al. Conventional versus automated measurement of blood pressure in primary care patients with systolic hypertension: randomised parallel design controlled trial. BMJ. 2011;342:d286. doi: 10.1136/bmj.d286. [DOI] [PMC free article] [PubMed] [Google Scholar]
- 60.Grossardt BR, Graves JW, Gullerud RE, et al. The occurrence of the alerting response is independent of the method of blood pressure measurement in hypertensive patients. Blood Press Monit. 2006;11(6):321–327. doi: 10.1097/01.mbp.0000218009.03699.46. [DOI] [PubMed] [Google Scholar]
- 61.Vidt D, Lang RS, Seballos R, et al. Taking blood pressure: Too important to trust to humans? Cleveland Clin J Med. 2010;77(10):683–688. doi: 10.3949/ccjm.77a.09155. [DOI] [PubMed] [Google Scholar]
- 62.Sabater-Hernandez D, Sanchez-Villegas P, Garcia-Corp et al. Predictors of the community pharmacy white-coat effect in treated hypertensive patients. The MEPAFAR study. Int J Clin Pharm. 2011;33(3):582–589. doi: 10.1007/s11096-011-9514-1. [DOI] [PubMed] [Google Scholar]
- 63.Pickering TG, Hall JE, Appel LJ, et al. Recommendations for blood pressure measurement in humans and experimental animals: part 1: blood pressure measurement in humans: a statement for professionals from the Subcommittee of Professional and Public Education of the American Heart Association Council on High Blood Pressure Research. Circulation. 2005;111(5):697–716. doi: 10.1161/01.CIR.0000154900.76284.F6. [DOI] [PubMed] [Google Scholar]
- 64.Head GA, Mihailidou AS, Duggan KA, et al. Definition of ambulatory blood pressure targets for diagnosis and treatment of hypertension in relation to clinic blood pressure: prospective cohort study. BMJ. 2010;340:c1104. doi: 10.1136/bmj.c1104. [DOI] [PMC free article] [PubMed] [Google Scholar]
- 65.Feher M, Harris-St John K, Lant A. Blood pressure measurement by junior hospital doctors–a gap in medical education? Health Trends. 1992;24(2):59–61. [PubMed] [Google Scholar]
- 66.National Institute for Health and Clinical Excellence . Hypertension: the clinical management of primary hypertension in adults, CG127. London: National Institute for Health and Clinical Excellence; 2011. [Google Scholar]
- 67.Mancia G, Fagard R, Narkiewicz K, et al. 2013 ESH/ESC Guidelines for the management of arterial hypertension. J Hypertens. 2013;31:1281–1357. doi: 10.1097/01.hjh.0000431740.32696.cc. [DOI] [PubMed] [Google Scholar]
- 68.Parati G, Omboni S, Staessen J, et al. Limitations of the difference between clinic and daytime blood pressure as a surrogate measure of the ‘white-coat’ effect. Syst-Eur investigators. J Hypertens. 1998;16(1):23–29. doi: 10.1097/00004872-199816010-00005. [DOI] [PubMed] [Google Scholar]
- 69.Little P, Barnett J, Barnsley L, et al. Comparison of agreement between different measures of blood pressure in primary care and daytime ambulatory blood pressure. BMJ. 2002;325(7358):254. doi: 10.1136/bmj.325.7358.254. [DOI] [PMC free article] [PubMed] [Google Scholar]