

Abstract
Insulin replacement therapy is a widely adopted treatment for all patients with type 1 diabetes and some with type 2 diabetes. However, injection of insulin has suffered from problems such as tissue irritation, abscesses, discomfort, and inconvenience. The use of orally bioactive insulin mimetics thus represents an ideal treatment alternative. Here we show that a chaetochromin derivative (4548-G05) acts as a new nonpeptidyl insulin mimetic. 4548-G05 selectively activates an insulin receptor (IR) but not insulin-like growth factor receptor-I or other receptor tyrosine kinases. Through binding to the extracellular domain of the IR, 4548-G05 induces activation of the receptor and initiates the downstream Akt and extracellular signal–related kinase pathways to trigger glucose uptake in C2C12 myotubes. Moreover, it displays a potent blood glucose-lowering effect when administrated orally in normal, type 1 diabetic, and type 2 diabetic mice models. Therefore, 4548-G05 may represent a novel pharmacological agent for antidiabetes drug development.
INTRODUCTION
Insulin is a hormone secreted from the pancreatic β-cells to control the level of glucose in circulation. Through binding to its transmembrane heterotetrameric insulin receptor (IR) on target tissues, insulin triggers signaling pathways, including phosphoinositide 3-kinase/Akt, Ras/extracellular signal–related kinase (ERK), and c-cbl/glucose transporter type 4, to enhance glucose uptake or suppress glucose production (1,2). Malfunction of insulin production or tissue responsiveness to insulin causes diabetes mellitus (DM). Type 1 DM (T1DM) is a consequence of immune destruction on the insulin producing β-cells in the pancreas, leading to insufficient insulin secretion (3). Therefore, insulin injection is necessary for T1DM patients to maintain a normal glucose level. Type 2 DM (T2DM) is caused by decreased sensitivity toward insulin stimulation in tissues (4). A substantial loss of insulin production may eventually occur if glycemic control cannot be well maintained, which also results in the need for insulin therapy (4). Although recombinant insulin and its analogs are commercially available, patients with DM who require insulin replacement are still confronted with the discomfort and inconvenience of multiple subcutaneous injections or continuous infusion. Moreover, complications such as injection abscesses, lipoatrophy, and allergy are reported in some patients receiving insulin therapy (5). Administration of orally active insulin mimetics thus represents an ideal alternative to an insulin supplementation regimen. To date only a few classes of preliminary insulin mimetics have been identified and display problems such as low receptor specificity or poor bioavailability. For example, arylalkylamine vanadium compounds are IR activators with questionable bioavailability (6); demethylasterriquinone B1 (DAQ B1) families are the only orally active insulin mimetics but are not IR specific and have high cellular toxicity (7,8). Thus the search for new bioavailable insulin mimetics with different chemical structures for promising drug development is greatly warranted.
RESEARCH DESIGN AND METHODS
Animals
Male C57BL/6J and db/db mice were obtained from The Jackson Laboratory (Bar Harbor, ME). Eight-week-old animals were used in our experiments. Mice were housed in environmentally controlled conditions with a 12-h light/dark cycle and had free access to standard rodent pellet food and water. The animal protocols were approved by the Institutional Animal Care and Use Committee of Emory University. Animals were cared for in accordance with institutional guidelines.
Cells and Reagents
Chinese hamster ovary (CHO)-IR cells and CHO–IGFR (IGFR) cells (a gift from Dr. Nicholas Webster, University of California at San Diego) were maintained in Ham’s F-12 medium with 10% FBS, 100 U/mL penicillin, 100 μg/mL streptomycin, and 400 μg/mL G-418. C2C12 cells were cultured in Dulbecco’s modified Eagle’s medium (DMEM) with 5% FBS, 15% calf bovine serum, 100 U/mL penicillin, and 00 μg/mL streptomycin. HEK293 cells were cultured in DMEM with 10% FBS, 100 U/mL penicillin, and 100 μg/mL streptomycin. All cells were maintained at 37°C with 5% carbon dioxide atmosphere in a humidified incubator. 4548-G05 was obtained from the National Cancer Institute. Recombinant human protein tyrosine phosphatase (PTP) 1B and IR–extracellular domain (ECD) (amino acids 1–928) were from R&D Systems (Minneapolis, MN) and EMD Millipore (Billerica, MA), respectively. [3H]-2-deoxyglucose was purchased from PerkinElmer (Waltham, MA). Anti-IRβ and anti-IR substrate 1 (IRS-1) antibodies were obtained from Santa Cruz Biotechnology (Santa Cruz, CA). Antiphospho-Akt 473, antiphospho-ERK anti-Akt, and anti–ERK were from Cell Signaling Technology (Danvers, MA). Antiphosphotyrosine (PY20) and anti-insulin/insulin-like growth factor-1 receptor (IR/IGF1R) (pYpYpY1158/1162/1163) antibodies were from BD Biosciences and Invitrogen, respectively. The phospho-IR Y1150/1151 sandwich ELISA kit was purchased from Cell Signaling Technology. All other reagents were purchased from Sigma-Aldrich (St. Louis, MO).
Cell-Based Screening
CHO-IR cells were seeded in a 96-well plate with 15,000 cells per well in 100 μL of serum-free medium. Cells were incubated overnight, followed by 15 min of treatment with 10 μmol/L compounds in DMSO at 37°C. Control wells were treated with DMSO alone or 100 nmol/L insulin. The final concentration of DMSO was kept below 0.1%. Cells were lysed and the phosphorylated receptors were captured by immobilized PY20 on ELISA plates. The bound receptors then were washed and detected using an anti-IR β antibody followed by a horseradish peroxidase–conjugated secondary antibody and colorimetric detection with 3,3′,5,5′-tetramethylbenzidine (9).
Western Blot Analysis
The drug-stimulated cells or mice tissues were lysed in a lysis buffer, as previously described (9). Cell debris was separated by centrifugation and the supernatant was used for Western blot analysis.
Partial Proteolysis Assay
Recombinant IR-ECD (200 ng; R&D Systems) was subjected to trypsin (50 ng) digestion in the presence of DMSO or 4548-G05 (50 μmol/L) with 50 mmol/L Tris-HCl (pH 8.2) and 20 mmol/L calcium chloride (CaCl2) at 37°C for 5 min. The reaction mixtures were resolved using SDS-PAGE and visualized using a standard silver staining method.
IR Endocytosis Assay
Biotinylation of cell surface IR was performed as reported previously with modifications (10). CHO-IR cells were starved of serum for 16 h, and the cell surface proteins were cross-linked with biotin using 0.5 mg/mL Pierce EZ-Link Sulfo-NHS-SS Biotin (Thermo Fisher Scientific, Rockford, IL) in PBS-calcium-magnesium buffer (PBS with 0.1 mmol/L CaCl2 and 1 mmol/L magnesium chloride) at 4°C for 30 min. The reaction was quenched by washing the cells three times with 5 mL PBS containing 15 mmol/L glycine. The cells then were incubated with a binding buffer (120 mmol/L sodium chloride [NaCl], 1.2 mmol/L magnesium sulfate, 2.5 mmol/L potassium chloride, 15 mmol/L sodium acetate, 10 mmol/L glucose, 1 mmol/L EDTA, 50 mmol/L HEPES, 10 mg/mL BSA [pH 7.8]) containing DMSO, insulin (100 nmol/L), or 4548-G05 (10 μmol/L) for 20 min at 37°C. After washing the cells with ice-cold PBS, the cells were treated with 2.5 mg/mL Pronase (Roche Diagnostics, Indianapolis, IN) at 4°C for 30 min. Ice-cold PBS containing 10 mg/mL BSA was used to quench the Pronase activity. The cells then were collected and lysed. The internalized IR was pull downed by Pierce streptavidin-agarose (Thermo Fisher Scientific) and detected by immunoblotting.
Insulin Competition Assay
CHO or CHO-IR cells were incubated with fluorescein isothiocyanate (FITC)-insulin (100 nmol/L) in the presence of different concentrations of 4548-G05 for 30 min at 37°C. Cells were washed three times and analyzed using flow cytometry (9).
Fluorescence Quenching Analysis
The interaction between IR and 4548-G05 was determined by fluorescence spectroscopy titration. At room temperature, tryptophan fluorescence was measured in purified IR-ECD recombinant proteins at a concentration of 250 nmol/L in PBS buffer [pH 7.4] with slit widths of 3.4 and 6.8 nm for excitation and emission, respectively. The emission spectra of the intrinsic fluorescence of IR were collected from 300 to 400 nm, with an excitation wavelength of 280 nm. The fluorescence emission intensity of 4548-G05 was negligible at these excitation and emission wavelengths. The fluorescence intensities of IR at 330 nm under different concentrations of 4548-G05 were collected. To exclude the possibility of inner filter effects, the fluorescence quenching experiments also were done in denatured IR using 7 mol/L guanidine hydrochloride and a PBS buffer mixed with free Trp (3.75 μmol/L), Tyr (9.25 μmol/L), and Phe (9.5 µM). The ultraviolet (UV) absorbances of the IR and amino acid mixture were collected by a VU-1601 UV spectrophotometer (Shimadzu Corp., Kyoto, Japan). The UV absorbance at 280 nm for IR, IR in the presence of 7 mol/L guanidine hydrochloride, and the Trp, Tyr, and Phe mixtures were recorded before fluorescence quenching experiments to ensure that the absorbance of denatured IR or the Trp/Tyr/Phe mixture matched that of IR in native conformation. To determine whether 4548-G05/IR interaction is reversible, 1 μmol/L of IR and 1 μmol/L 4548-G05 were mixed in 400 μL PBS buffer [pH 7.0] and incubated for 10 min. After the intrinsic fluorescence of the IR and IR/4548-G05 mixture was determined, the IR/4548-G05 mixture was loaded in the top chamber of an Amicon Ultra 4 centrifugal filter unit (EMD Millipore) and centrifuged for 4–5 h to separate the unbound ligand. After centrifugation, PBS was added to the top chamber of the filter unit to make a volume of 400 μL. Intrinsic fluorescence of IR in the mixture then was determined. We also measured the IR concentration using a Bio-Rad protein assay before and after centrifugation in the top chamber to make sure that any change in fluorescence intensity was not caused by alterations in the IR concentration.
UV Absorption Analysis
UV-visual absorbance of G05–4548 was obtained using a UV-1601 UV-Visible spectrophotometer (Shimadzu Corp.) equipped with 1.0-cm quartz cells. The PBS buffer at baseline was calibrated before experiments. The spectrum of 4 μmol/L G05–4548 was collected from 250 to 500 nm in PBS buffer.
[3H]-2-Deoxyglucose Uptake
C2C12 cells were seeded into a 24-well plate. After reaching confluence, the cells were switched to a differentiation medium containing 2% horse serum in DMEM medium and fed every day. After 8 days, C2C12 myotubes were washed and treated with 400 μL of Krebs-Ringer phosphate–HEPES buffer (131.2 mmol/L NaCl, 4.71 mmol/L potassium chloride, 2.47 mmol/L CaCl2, 1.24 mmol/L magnesium sulfate, 2.48 mmol/L monosodium phosphate, 10 mmol/L HEPES, and 0.5% BSA [pH 7.45]) containing different concentrations of insulin or 4548-G05 for 30 min at 37°C. The transport reaction was initiated by adding 100 μL of 2-deoxyglucose (final concentration, 100 μmol/L) with [2-3H]deoxyglucose (0.5 μCi/well), as reported previously (9). After a 10-min incubation, cells were washed three times with ice-cold Krebs-Ringer phosphate–HEPES buffer and solubilized in 0.2 mol/L sodium hydroxide (NaOH). The radioactivity was measured by scintillation counting.
Hydrogen Deuterium Exchange Mass Spectrometry and Data Analysis
Solution-phase amide hydrogen deuterium exchange (HDX) mass spectrometry was carried out with a fully automated system, as described previously (11). Briefly, recombinant human IR-ECD in the absence and presence of a 10-fold molar excess of human insulin (Sigma-Aldrich) or 4548-G05 was incubated for 1.5 h at 4°C before being subjected to HDX. HDX reactions were conducted in a buffer consisting of 5 μL of 10 μmol/L apo IR-ECD, or the IR-ECD-insulin/4548-G05 complex was diluted to 25 μL with HDX buffer containing heavy water and incubated at 4°C for 10, 30, 60, 900, or 3,600 s. Following exchange, unwanted forward or back exchange was minimized and the protein was denatured by dilution to 50 μL with 0.1% (v/v) trifluoroacetic acid in 3 mol/L urea and 500 mmol/L tris(2-carboxyethyl)phosphine and subjected to electrospray ionization directly coupled to a high-resolution (70,000 at a 400 mass-to-charge ratio) Orbitrap mass spectrometer (LTQ Orbitrap XL ETD; Thermo Fisher Scientific). Differential HDX data were analyzed using software developed in-house (12); the percentage differences in the uptake of heavy water between apo and holo IR-ECDs were mapped to the three-dimensional structures (Protein Data Bank [PDB] identifiers: 2DTG and 3W11, respectively).
Docking Simulation
The PDB file of IR (2DTG) was downloaded from the protein database. PDBQT files for IR and 4548-G05 were prepared using Autodock Tools version 1.5.6. Polar hydrogen atoms also were added to both IR and 4548-G05 using AutoDock Tools. A grid box (126 × 126 × 76 Å) with a grid spacing of 1 Å were generated by Autodock Tools. The grid is centered at x-, y-, and z-axis coordinates of −1.000, 113.000, and 35.586, respectively. The docking simulation was performed by AutoDock Vina and AutoDock 4.0 (13). The docking results were visualized using PyMOL computer software (DeLano Scientific, South San Francisco, CA).
T1DM Model
After overnight fasting, male C57BL/6J mice were treated with an intraperitoneal injection of streptozotocin (STZ) (150 mg/kg) freshly dissolved in 0.1 mol/L citrate buffer (pH 4.5). Seven days after STZ injection, those animals showing blood glucose higher than 400 mg/dL were considered to be diabetic and were used in our assays.
Blood Glucose Determination
After a 12 h of fasting, vehicle (5% methylcellulose) or 10 mg/kg (C57BL/6J) or 5 mg/kg (db/db and T1DM mice) 4548-G05 in 0.5% methylcellulose was orally administered to the animals. Blood glucose levels then were measured at the indicated time points using an Accu-Chek glucometer (Roche Diagnostics).
Intraperitoneal Glucose Tolerance Test
After a 12-h fasting, vehicle (5% methylcellulose) or 5 mg/kg 4548-G05 in 0.5% methylcellulose was orally administered to db/db mice. One hour after administration of the drug, glucose was administered intraperitoneally (0.3 g/kg). Blood glucose levels were measured using a glucometer 0, 30, 60, 90, 120, and 180 min after glucose loading.
Phosphatase Assay
CHO-IR cells were seeded in a 96-well plate with 15,000 cells per well in 100 μL of complete medium. Cells were incubated overnight, followed by 15 min of treatment with different concentrations of drugs. The cell lysate (100 μg) then was incubated with 4 mmol/L p-nitrophenyl phosphate, 50 mmol/L Tris-HCl (pH 7.5), 100 mmol/L NaCl, and BSA (0.1 mg/mL) for 20 min at 37°C. The reaction was terminated by the addition of 1 mol/L NaOH. The p-nitrophenol formed was determined spectrophotometrically at 400 nm using a BioTek microplate reader (Highland Park, Vermont).
For in vitro PTP1B assay, different concentrations of drugs were incubated with PTP1B (0.4 μg) and 4 mmol/L p-nitrophenyl phosphate in 50 mmol/L potassium phosphate buffer (pH 7.5), containing 0.1 mmol/L EDTA. Incubations were carried out for 30 min at 37°C and terminated by the addition of NaOH. The p-nitrophenol formed was determined at 400 nm using a BioTek microplate reader.
Micronucleus Assay
The cells treated with 4548-G05 at 50 μmol/L for 24 h were washed with PBS, incubated in a mild hypotonic solution (0.075 mol/L potassium chloride/0.9% NaCl [1:19]) for 10 min at 37°C, fixed with methanol-glacial acetic acid (3:1) for 15 min at 37°C, rinsed with distilled water, and air dried. Fixed cells were stained with DAPI (2 μg/mL) for 30 min in the dark at room temperature. Cells were rinsed with PBS and distilled water and mounted with Fluoromount-G (Southern Biotechnology Associates, Birmingham, AL). Micronuclei were identified based on the criteria reported previously (14). One thousand cells per treatment were analyzed using a fluorescence microscope.
Single-Cell Gel Electrophoresis (Comet Assay)
The 4548-G05-treated HepG2 cells were embedded in 0.75% low-melting-point agarose and spread on a base layer of 1% normal-melting-point agarose in PBS buffer. The cells were placed in a lysis solution (2.5M NaCl, 200 mmol/L Na2EDTA, 10 mmol/L Tris-HCl [pH 10], and 1% Triton X-100) at 4°C for 2 h. Slides were transferred to an electrophoresic box and immersed in an alkaline solution (300 mmol/L NaOH, 1 mmol/L Na2EDTA [pH >13]). After 40 min unwinding time, a voltage of 25 V (300 mA) was applied for 30 min at 4°C. Slides were neutralized with Tris-HCl (0.4 mol/L; pH 7.4), stained with ethidium bromide (10 μg/mL), and examined with a fluorescence microscope. Total cell numbers in a field (>100) were counted and the number of nucleoids exhibiting a comet tail formation was identified (15,16). Results were quantified as the number of comet nuclei out of the total number of nuclei.
Statistic Analysis
Results are expressed as the mean ± SE of at least three independent experiments and are considered significant when P < 0.05. Statistic analysis was performed using the Prism 5.0 computer program (GraphPad, La Jolla, CA).
RESULTS
Identification of 4548-G05 as a Novel Small Molecular Insulin Mimetic
To search for novel small-molecular-weight insulin mimetics, we developed a cell-based screening assay using an ELISA to determine the chemical-induced IR tyrosine phosphorylation in CHO cells that were stably transfected with IR (9). We have screened approximately 5,000 synthetic or natural compounds and identified [9,9′-Bi-4H-naphtho[2,3-b]pyran]-4,4′-dione,2,2′,3,3′-tetrahydro-5,5′,6,6′,8,8′-hexahydroxy-2,2′,3,3′-tetramethyl (4548-G05) as an effective IR activator (Fig. 1A). When stimulated with 4548-G05, IR phosphorylation in CHO-IR cells was increased to about 250% of the basal level (Fig. 1B). To determine the core structure of 4548-G05 that is essential for triggering IR phosphorylation, we performed the same IR phosphorylation assay with seven related chemicals (compounds 1 to 7 in Fig. 1A). Surprisingly, none of these 4548-G05 derivatives induced IR phosphorylation (Fig. 1B). Western blot analysis further confirmed that 4548-G05, but not its derivatives, induced total tyrosine and IR Y1158/1165/1162 phosphorylations in CHO-IR cells (Fig. 1C). Kinetics assay demonstrated that 4548-G05 stimulated IR activation at 5 min, climaxed at 15 min, was sustained until 120 min, and returned to the basal level at 180 min (Fig. 1D). 4548-G05 (<25 μmol/L) also displayed low cytotoxicity and genotoxicity in cultured HepG2 cells (Supplementary Fig. 1).
Figure 1.

4548-G05 activates the IR. A: Chemical structures of 4548-G05 and its derivatives. B: Effects of 4548-G05 and its derivatives on IR phosphorylation in CHO-IR cells. CHO-IR cells were treated with insulin (100 nmol/L) or various 4548-G05 derivatives (10 μmol/L) for 15 min. The amount of phosphorylated IR was quantified by sandwich ELISA using immobilized antiphosphotyrosine antibody (PY20) and anti-IR antibody. Activities of the tested compounds are expressed as a percentage of control (DMSO). ***P < 0.001, one-way ANOVA vs. DMSO (n = 3). C: Western blot analysis of IR phosphorylations provoked by 4548-G05 in CHO-IR cells. CHO-IR cells were treated with insulin (100 nmol/L) or various 4548-G05 derivatives (10 μmol/L) for 15 min. IR phosphorylation then was determined by anti-pIR Y1158/1162/1163 antibody (top panel) or immunoprecipitated by PY20 and analyzed using anti-IR (middle panel). Expression of IR also is shown (bottom panel). D: 4548-G05 induces IR phosphorylation in a time-dependent manner. CHO-IR cells were treated with 4548-G05 (10 μmol/L) for different time intervals and the IR Y1150/1151 phosphorylation was monitored by sandwich ELISA. ***P < 0.001, one-way ANOVA vs. 0 min (n = 3).
4548-G05 Selectively Activates IR and Its Downstream Signaling Pathways
Autophosphorylation is a hallmark of IR activation, which in turn activates the IRS-1/phosphoinositide 3-kinase/Akt and mitogen-activated protein kinase/ERK cascades (17). As expected, stimulation with 4548-G05 enhanced the phosphorylations of IR, IRS-1, Akt, and ERK in CHO-IR cells (Fig. 2A). Moreover, 4548-G05 activated IR in a dose-dependent manner, which elevated IR phosphorylation with a concentration as low as 5 μmol/L (Fig. 2B, first panel). Akt activation was tightly correlated with the IR phosphorylation provoked by 4548-G05 (Fig. 2B, fourth panel). Notably, insulin (100 nmol/L) induced greater IR phosphorylation levels than 4548-G05 in the ELISA (Fig. 1B) but generated weaker signals in the immunoblotting in CHO-IR cells (Fig. 2B, first panel), indicating that insulin induces more total receptor phosphorylation while 4548-G05 provokes more IR phosphorylation in specific residue (Y1158/1162/1163). 4548-G05-induced IR-autophosphorylation in CHO-IR cells was further confirmed using an ELISA against Y1150/1151-phoshorylated IR (Fig. 2C, bars 1–4). Interestingly, synergistic action to IR phosphorylation was found when CHO-IR cells were stimulated with both 4548-G05 and insulin (Fig. 2C). IR endocytosis also was observed in CHO-IR cells after 4548-G05 stimulation, suggesting that the compound induced IR internalization like insulin (Fig. 2D). We also tested whether 4548-G05 activated other members of the receptor tyrosine kinase (RTK) family. Neither the IGFR (Fig. 2E) nor the epidermal growth factor receptor (Fig. 2F) was activated by 4548-G05. Similarly, 4548-G05 could not induce TrkB phosphorylation in HEK293 cells overexpressing TrkB (data not shown). These results suggest that 4548-G05 specifically activates IR and its downstream pathways.
Figure 2.

4548-G05 activates IR signaling. A: CHO-IR cells were treated with insulin (100 nmol/L) or 4548-G05 (10 μmol/L) for 15 min. Total tyrosine phosphorylation of the IRS-1 was monitored by immunoprecipitated (first panel). Phosphorylations of Akt (S473) and ERK (T202/Y204) also were determined (third and fifth panels). Expression of IRS-1 (second panel), Akt (fourth panel) and ERK (sixth panel) also were examined. B: 4548-G05 induced IR phosphorylation in a dose-dependent manner. CHO-IR cells were treated with 4548-G05 at different concentrations for 15 min. The IR phosphorylation then was determined using immunoprecipitation (second panel) or antibody against phospho-Y1158/1162/1163 (first panel). Phosphorylation on Akt S473 also was monitored (fourth panel). Expressions of IR (third panel) and Akt (fifth panel) also were verified. C: 4548G-05 synergizes insulin-induced IR autophosphorylation. CHO-IR cells were stimulated with various combinations of 4548-G05 and insulin as indicated for 30 min. The IR Y1150/1151 phosphorylation then was monitored by sandwich ELISA. **P < 0.01; ***P < 0.001; one-way ANOVA (n = 3). D: 4548-G05 induces IR endocytosis. Internalization of biotinylated IR on the surface of CHO-IR cells was detected after stimulation with 4548-G05 (10 μmol/L) or insulin (100 μmol/L) and Pronase treatment (top panel) using streptavidin pull-down. The amount of total IR input also was examined (bottom panel). E: 4548-G05 does not induce IGFR phosphorylation. CHO-IGFR cells were treated with IGF-1 (100 nmol/L) or 4548-G05 (10 μmol/L) for 15 min. IGFR phosphorylation on Y1131 then was analyzed by immunoblotting (first panel). Akt phosphorylation on S473 also was examined (third panel). Expressions of IGFR (second panel) and Akt (fourth panel) also are shown. F: 4548-G05 does not induce epidermal growth factor (EGF) receptor phosphorylation. HEK293 cells were treated with EGF (100 nmol/L) or 4548-G05 (10 μmol/L) for 15 min. The cell lysates were analyzed by immunoblotting using anti–EGF receptor Y1068 (top panel) and anti-EGF receptor (bottom panel).
4548-G05 Interacts With the ECD of IR
Insulin mimetics such as vanadium compounds induce IR phosphorylation by suppressing the activity of PTP (18). We performed an in vitro PTP assay to rule out the possibility that 4548-G05 is a phosphatase inhibitor. Incubation of recombinant PTP1B, a major IR phosphatase (19), with 10 μmol/L 4548-G05 (the concentration that provoked prominent IR phosphorylation [Fig. 1C]) did not reduce its phosphatase activity (Supplementary Fig. 2A). In contrast, the activity of PTP1B was significantly suppressed by 10 μmol/L 1,2-napthoquinone, a reported chemical inhibitor of PTP1B (20). The activity of total PTP in CHO-IR cells was also not affected after stimulated with 10 μmol/L 4548-G05 (Supplementary Fig. 2B), suggesting that 4548-G05 does not strongly target any PTP in cells at the indicated dosage. Stimulation of CHO-IR cells with 1,2-napthoquinone, however, reduced cellular PTP activity in a dose-dependent manner. Although 4548-G05 did not reveal any inhibitory effect on PTP1B at low concentrations, it partially antagonized PTP1B at high doses. Using a high-throughput screening model for screening human soluble PTP1B inhibitors (21), we determined the half-maximal inhibitory concentration of 4548-G05 as 75.29 ± 2.52 μmol/L (Table 1).
Table 1.
Half-maximal inhibitory concentration (IC50) of 4548-G05 for inhibiting PTP1B

Next, we performed a partial proteolysis protection assay on recombinant IR (9) to determine whether 4548-G05 activates IR via direct interaction. We first incubated recombinant IR-ECD (amino acids 1–928), which contains the α subunit and a part of the β subunit, with DMSO or 4548-G05, followed by limited trypsin digestion. Under DMSO treatment, the majority of the IR α subunits (∼130 kDa bands) were digested and all β subunits (∼40 kDa bands) were completely cleaved (Fig. 3A, left panel). The digestion pattern was altered in the presence of 4548-G05; all IR subunits were completely digested under the same experimental conditions. 4548-G05 bound to IR-ECD presumably changed its confirmation and facilitated enzyme digestion. This result can also explain that 4548-G05 potentiates the protease activity of trypsin. However, incubation of 4548-G05 did not affect the cleavage pattern of an irrelevant protein, zyxin (22), by trypsin (Fig. 3A, right panel), thus eliminating the possibility that 4548-G05 is a protease enhancer.
Figure 3.

4548-G05 binds to the ECD of IR. A: D4548-G05 alters the proteolytic cleavage pattern of IR-ECD. Recombinant IR-ECD (left panel) and human zyxin fragment (right panel) were subjected to limited trypsin digestion in the presence of DMSO or 4548-G05 (50 μmol/L). The reaction was resolved in SDS-PAGE followed by silver staining. B: Intrinsic fluorescence emission quenching of recombinant IR-ECD (250 nmol/L) with increasing concentrations of 4548-G05. C: Titration curve of IR-ECD fluorescence quenching in the presence of 4548-G05. D: 4548-G05 is a reversible ligand of IR. The Trp fluorescence of IR was decreased when 4548-G05 bound to IR (IR + G5). After centrifugation, the unbound 4548-G05 was filtered. When the 4548-G05/IR complex in the top chamber was reconstituted, some of the bound 4548-G05 dissociated from the ligand/receptor complex and reached a new equilibrium, which is indicated by the increase of intrinsic IR fluorescence (IR + G5 [centrifugation]). E: 4548-G05 does not compete with insulin for IR binding. CHO-IR cells were incubated with FITC-insulin in the presence of unlabeled insulin (left panel) or various concentration of 4548-G05 (middle panel). Parental CHO cells were used as a negative control (right panel). The fluorescence-labeled cells were analyzed by flow cytometry.
To demonstrate a direct interaction of 4548-G05 with IR-ECD, we take advantage of the Trp residues in IR-ECD (Supplementary Fig. 3). As shown in Fig. 3B, Trp emission maximized at 330 nm (excited at 280 nm), suggesting that the Trp residues of the purified recombinant protein IR-ECD are largely buried, consistent with the reported structure of the ECD domain of IR and other well-folded proteins (23). The addition of 4548-G05 to the IR-ECD resulted in a 35% decrease in fluorescence, while the maximum emission wavelength remained unchanged. However, the addition of 4548-G05 to guanidine-denatured IR-ECD or a solution containing free Trp, Phy, and Tyr in the same concentration as IR-ECD did not induce any significant decrease in fluorescence intensity (Supplementary Figs. 4 and 5), suggesting the change in the fluorescence of IR in the presence of 4548-G05 is not an inner filter artifact but an authentic compound-protein interaction. A plot of relative fluorescence change versus inhibitor concentration can be well fitted with an equation assuming 1:1 binding, suggesting a single binding site of IR-ECD for 4548-G05 (Fig. 3C). To further test whether the binding between 4548-G05 and IR is noncovalent, we preincubated IR-ECD with an equal concentration of 4548-G05, separated the unbound ligand by filtration, and reconstituted the 4548-G05/IR complexes in the same buffer condition. As shown in Fig. 3D, the intensity of the 4548-G05/IR complex was increased after centrifugation and reconstitution, indicating that the binding of 4548-G05 to the ECD of IR is reversible.
We further tested whether 4548-G05 shares the same IR binding site with insulin using a flow cytometry assay (24). While binding of FITC-insulin to the cell surface IR increased the fluorescent signal of CHO-IR cells, leading to a right shift of the peak, no significant change of the peak position was observed in the presence of 4548-G05 (Fig. 3E, middle panel). However, a left shift of the fluorescent peak was detected when unlabeled insulin was added, suggesting a successful competition between unlabeled insulin and FITC-insulin for the receptor binding (Fig. 3E, left panel). As a negative control, FITC-insulin did not bind to the parental CHO cells (Fig. 3E, right panel).
To gain the knowledge of how 4548-G05 affects the IR conformational dynamics relative to insulin, we performed HDX–coupled mass spectrometry on fully glycosylated apo and holo IR-ECD. Over the years, HDX–mass spectrometry has been proved as a robust technology to characterize protein-protein interactions in a solution state and a valuable complement to X-ray crystallography (11,25,26). Despite limited coverage, presumably because of the extensive glycosylation and disulfide bonds of the IR-ECD, a very strong protection from exchange was observed at the IR αCT region (residues 695–720) after insulin binding (Supplementary Fig. 6). These residues are responsible for contacting insulin and the L1 domain (27). Our data show a clear disorder-to-order transition for αCT residues after insulin binding, which is in line with HDX studies of the IGFR whereby IGF-1 induces a strong protection of the corresponding L1 residues and αCT residues 696–701 (28). Insulin also conferred strong protection for residues 431–455 and 487–502, located at or near the homodimer interface (Supplementary Fig. 6). Thus, IR and the IGFR share a common structural mechanism to achieve receptor activation. Surprisingly, differential HDX revealed no significant changes in protection for the 4548-G05 IR-ECD complex relative to apo IR-ECD. This is in line with the proteolysis protection and intrinsic tryptophan fluorescence assays, which suggest that 4548-G05 destabilizes the IR-ECD and explain the lack of protection relative to the apo receptor. By altering protein stability, 45847-G05 may act to decouple the conformational state of the protein to its propensity to become phosphorylated. In other words, it may relax the conformation of the apo receptor, which normally prevents autophosphorylation. In silico docking analysis further suggested that 4548-G05 might bind to the hinge region between the cysteine-rich region and L2 domains (Supplementary Fig. 7A). It also suggested that residues Glu287, Cys288, Thr293, Cys306, and Lys310 of the IR were involved in the interaction between IR and 4548-G05 (Supplementary Fig. 7B). Since insulin B-helix engages Phe39 of the β2-strands at the IR L1 region, and both insulin chains interact extensively with the IR αCT region (the His710, Asn711, and His714) (27), our simulation suggests that 4548-G05 binds to the IR on a region outside the insulin binding site.
4548-G05 Promotes Glucose Uptake in Myotubes
Next we determined whether 4548-G05 activates endogenous IR and the receptor-mediated signaling cascades in differentiated C2C12 myotubes. Immunoblotting analysis showed that 4548-G05 activated endogenous IR and Akt in C2C12 cells (Fig. 4A, first and third panels). To confirm whether the induced signaling is IR dependent, we knocked down IR in the differentiated myotubes. Western blot analysis showed that IR expression was significantly decreased after small interfering RNA transfection (Fig. 4B, top panel). ERK phosphorylation triggered by both insulin and 4548-G05 was also reduced in IR-depleted cells (Fig. 4B, middle panel), underscoring that IR is the major molecular target of 4548-G05 to trigger the downstream signaling.
Figure 4.

4548-G05 activates IR in myotubes and enhances cellular glucose uptake. A: 4548-G05 provokes IR signaling in differentiated C2C12 cells. Differentiated C2C12 myotubes were stimulated with insulin (100 nmol/L) or 4548-G05 (1, 5, and 10 μmol/L) for 30 min. Insulin signaling in the cell lysates was tested by immunoprecipitation and immunoblotting. B: IR is necessary for 4548-G05 to induce ERK phosphorylation. Differentiated C2C12 myotubes were transfected with scramble siRNA (si-Control) or siRNA against IR (si-IR). After 72 h the cells were stimulated with insulin (100 nmol/L) or 4548-G05 (10 μmol/L) for 30 min. Cell lysates were analyzed by immunoblotting. C: 4548-G05 stimulates glucose uptake. Differentiated C2C12 myotubes were stimulated with insulin (100 nmol/L) or 4548-G05 (1, 5, and 10 μmol/L) for 30 min. [3H]-2-deoxyglucose then was added and the cells were incubated for another 10 min. After cell lysis, the radioactivity uptake by the myotubes was measured by scintillation counting. **P < 0.01 vs. control, one-way ANOVA (n = 3). D: 4548-G05 synergizes insulin signaling. Differentiated C2C12 myotubes were stimulated with 5 nmol/L insulin, 50 nmol/L 4548-G05, or a combination of the 2 drugs. Cell lysates then were prepared for immunoprecipitation and immunoblotting using specific antibodies as indicated. E: 4548-G05 synergizes insulin activity in promoting glucose uptake. Differentiated C2C12 myotubes were stimulated for 30 min with 50 nmol/L insulin, 200 nmol/L 4548-G05, or a combination of the 2 drugs. [3H]-2-deoxyglucose then was added, and the cells were incubated for another 10 min. The [3H]-2-deoxyglucose taken by the myotubes was measured by scintillation counting after cell lysis. **P < 0.01; ***P < 0.001; one-way ANOVA (n = 3).
Since insulin is the central hormone to promote glucose uptake in muscle tissue, we examined whether 4548-G05 mimics insulin in triggering glucose uptake in myotubes. As shown in Fig. 4C, 4548-G05 stimulated glucose uptake in a dose-dependent manner. Interestingly, a mixture of insulin and 4548-G05 provoked much more robust IR and Akt phosphorylations than insulin or 4548-G05 per se, indicating a synergistic effect of 4548-G05 on insulin-mediated IR activation (Fig. 4D). In agreement with the IR phosphorylation status, glucose uptake in C2C12 cells also was synergistically escalated when a mixture of insulin and 4548-G05 was used (Fig. 4E). Thus, 4548-G05 synergistically activates IR with insulin, leading to robust glucose uptake.
4548-G05 Exhibits a Hypoglycemic Effect in Normal Mice
Our in vitro data demonstrated that 4548-G05 is an IR activator in insulin-responsive cells; we then sought to determine whether 4548-G05 could activate IR in vivo by administrating 4548-G05 or insulin into the vena cava of C57BL/6 mice. As shown in Fig. 5A, 4548-G05 increased IR, Akt, and ERK phosphorylations in all the tissues tested in a dose-dependent manner, suggesting that 4548-G05 is also an effective IR activator in vivo.
Figure 5.
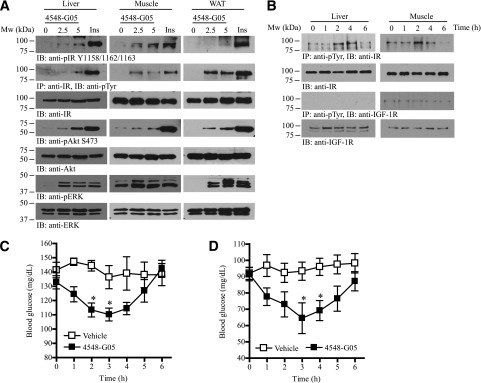
4548-G05 activates insulin signaling pathways in vivo and possesses hypoglycemic activity. A: 4548-G05 quickly activates IR and its downstream signaling in mice. Eight-week-old C57BL/6J mice were starved for 12 h and then vehicle, 4548-G05 (2.5 or 5 mg/kg), or human insulin (Ins; 1U/kg) was injected via the vena cava. After 5 min, the liver, muscle, and fat tissues were collected and analyzed by immunoblotting and immunoprecipitation using specific antibodies. B: Oral administration of 4548-G05 provokes IR phosphorylation and its downstream signaling in mice. Eight-week-old C57BL/6J mice were starved for 12 h and then 4548-G05 (10 mg/kg) was orally administered. Cell lysates were prepared from liver and muscle tissues collected at various time intervals and analyzed by immunoprecipitation and immunoblotting. C: 4548-G05 decreases blood glucose concentration in fed C57BL/6J mice. Vehicle (0.5% methylcellulose) or 4548-G05 (10 mg/kg) was orally administered to 8-week-old C57BL/6J mice. Blood glucose was monitored before and after dosing at the different time points as indicated. *P < 0.05 vs. vehicle, one-way ANOVA (n = 5). D: 4548-G05 decreases blood glucose concentration in fasted C57BL/6J mice. Eight-week-old C57BL/6J mice were starved for 12 h and then vehicle (0.5% methylcellulose) or 4548-G05 (10 mg/kg) was orally administered. Blood glucose was monitored before and after dosing at the different time points indicated. *P < 0.05 vs. vehicle, one-way ANOVA (n = 5).
To further test 4548-G05 as a bioavailable IR agonist, we administrated the compound into C57B/6 mice via oral gavage. IR tyrosine phosphorylation in the liver and muscle were elevated after administration of 4548-G05 (Fig. 5B, first panel). While 4548-G05 induced hepatic IR phosphorylation as early as 2 h after oral administration, the receptor phosphorylation was substantiated at 4 h and declined at 6 h. In contrast, 4548-G05 triggered a shorter time course of IR phosphorylation in muscle: IR phosphorylation was only substantially increased 2 h after the drug administration. Notably, IGF-1R was not at all activated by this compound (Fig. 5B, third panel). Circulating glucose levels in fed C57/BL6 mice were significantly decreased 2 h after administration of the drug, reached maximal effect at 3 h, and returned to basal levels at 6 h (Fig. 5C). Similarly, 4548-G05 reduced blood glucose concentration in fasted animals, with maximal hypoglycemic activity 3 h after administration (Fig. 5D). The effect was sustained at 4 h and returned to basal levels at 6 h. These results suggest that 4548-G05 has a long-lasting hypoglycemic function. In vitro microsomal stability assay suggests that 4548-G05 is resistant to hepatic metabolism (Table 2). A significant portion of orally administrated 4548-G05 is presumably reserved in the circulation, thus exhibiting a long-lasting activity in controlling blood glucose concentrations.
Table 2.
Liver microsomal stability screening

Hypoglycemic Effect of 4548-G05 in Diabetic Mice
Concurring with the observation in C57BL/6 mice, oral administration of 4548-G05 activated IR and its downstream cascade in the insulin-sensitive tissues of diabetic db/db mice (Fig. 6A). It also significantly lowered the concentration of blood glucose in fed db/db mice 2 h after oral administration (Fig. 6B). This hypoglycemic function of the compound was sustained at 4 h and returned to basal levels at 6 h. In fasted db/db mice, 4548-G05 significantly lowered the blood glucose concentration 1 h after oral administration, and maximal activity was observed at 3 h (Fig. 6C). The compound activity was sustained at 4 h and returned to basal levels at 6 h. Oral administration of 4548-G05 also led to significant improvements in glucose tolerance (Fig. 6D and E), which further indicates that 4548-G05 is an effective agent in controlling blood glucose even in insulin-resistant tissues.
Figure 6.

4548-G05 displays hypoglycemic activity in diabetic animal models. A: 4548-G05 activates insulin signaling in db/db mice. Eight-week-old mice were starved for 12 h and then 4548-G05 (5 mg/kg) was orally administered. Cell lysates were prepared from liver, muscle, and fat tissues that were collected at different time intervals and analyzed by immunoprecipitation and immunoblotting. B: 4548-G05 reduces blood glucose levels in fed db/db mice. Vehicle (0.5% methylcellulose) or 4548-G05 (5 mg/kg) was orally administered to the animals. Blood glucose was monitored before and after dosing at 1-h intervals. *P < 0.05 vs. vehicle; two-way ANOVA (n = 6). C: 4548-G05 reduces blood glucose level in fasted db/db mice. The animals were starved for 12 h and then vehicle (0.5% methylcellulose) or 4548-G05 (5 mg/kg) was orally administered. Blood glucose was monitored before and after dosing at 1-h intervals (n = 5). ***P < 0.001 vs. vehicle; two-way ANOVA. D: 4548-G05 improves the glucose tolerance in db/db mice. The animals were starved for 12 h and then vehicle (0.5% methylcellulose) or 4548-G05 (5 mg/kg) was orally administered 1 h before a bolus injection of glucose (0.3 mg/kg). Blood glucose was measured at the indicated time intervals (n = 5). E: Area under the curve of the glucose tolerance test shown in D. *P < 0.05, Student t test (n = 5). F: Hypoglycemic activity of 4548-G05 in mice with STZ-induced T1DM. C57BL/6 mice (8 weeks old) were divided into two groups 7 days after a single intraperitoneal injection of STZ (150 mg/kg). The animals then were starved for 12 h and vehicle (0.5% methylcellulose) or 4548-G05 (5 mg/kg) was orally administered. Blood glucose was measured at the indicated time intervals. ***P < 0.001 vs. vehicle; two-way ANOVA (n = 5). G: Chronic treatment with 4548-G05 given to db/db mice improves the hyperglycemia. Vehicle (0.5% methylcellulose) or 4548-G05 (5 mg/kg) was administrated orally once a day for 10 consecutive days to 8-week-old db/db mice. Blood glucose of the fed animals then was measured at various time intervals as indicated. *P < 0.05, two-way ANOVA (n = 5).
We also have verified whether 4548-G05 alleviates the hyperglycemia caused by insulin deficiency. Compared with animals injected with vehicle, blood glucose was significantly decreased 3 h after 4548-G05 treatment in STZ-induced diabetic mice, indicating that 4548-G05 also has a hypoglycemic effect in an animal model of T1DM (Fig. 6F). Last, we examined the effect of chronic 4548-G05 treatment on the blood glucose of T2DM mice. Significant reduction of blood glucose was observed in fed mice after 10 days of treatment (Fig. 6G). No significant change in body weight was observed in 4548-G05-treated db/db mice when compared with those receiving the vehicle control (Supplementary Fig. 8). Blood chemistry analysis also revealed no significant alterations in blood content between the animals treated with vehicle and drug (Supplementary Table 1). These results suggest that 4548-G05 has a long-term beneficial effect on hyperglycemia in mice under a single bonus regimen without significant alternations in body weight and blood biochemistry.
DISCUSSION
In this report we have identified a novel, orally active small molecule, 4548-G05, which mimics the functions of insulin to activate IR and its downstream signaling pathways in vitro and in vivo. 4548-G05 is a natural product called chaetochromin A, which belongs to the bis(naphtho-γ-pyrone) family, a metabolite of Chaetomium gracile. It was initially described during the screening for mycotoxin produced by Chaetomium spp. and related fungi on rice culture (29,30). These compounds have been demonstrated to inhibit HIV-1 integrase (31) and inhibit nitric oxide production in murine macrophage-like cells through suppressing the induction of inducible nitric oxide synthase (32). Since numerous isochaetochromin derivatives and their semisynthetic compounds have been reported, minor modifications on each group of these compounds may provide a good starting point for future structure-activity relationship (SAR) studies. To this end, we analyzed a panel of diverse compounds with structural moiety similar to that of 4548-G05 and found that only 4548-G05 is active in provoking IR activation. 4548-G05 contains two symmetric fragments with several hydroxy and ketone groups. Moreover, the methyl group is in a chiral center; hence, 4548-G05 possesses 16 enantiomers. To identify exactly which isoform is bioactive with increased potency and eventually lead to a compound that works at a nanomolar level, an in-depth SAR study is required to further interrogate the exact pharmacophore for its IR agonistic effect.
Since the identification of the fungal metabolite DAQ B1 as an orally active IR ligand with antidiabetic functions (33), several other insulin mimetics have been developed (34). For example, Lin and colleagues (35) have conducted extensive SAR studies of DAQ B1 derivatives and successfully identified the monoindolyl-dihydroxybenzoquinones ZL-196 and LD-17 as the functional mimetics of insulin that activate IR signaling and lower blood glucose in db/db mice. However, these compounds cannot selectively stimulate IR at low concentrations. While they compounds trigger IR activation at concentrations as low as 10 to 30 μmol/L, they also provoke the activation of other RTKs, including IGFR, TrkA, and epidermal growth factor receptor at these concentrations (35,36). In contrast, 4548-G05 strongly and specifically initiates an IR cascade at 5 μmol/L and is unable to activate other RTKs. However, we could not completely exclude the possibility of an off-target effect of 4548-G05 in this study because it possesses differential efficacy in activating Akt and ERK in vivo. While injection of 4548-G05 in C57/BL6 mice induces less Akt activation in peripheral tissues than insulin does, comparable ERK phosphorylation is detected (Fig. 6A). Other receptors, especially those using the ERK pathway, might presumably be induced by 4548-G05. Nevertheless, 4548-G05 sufficiently induces glucose uptake in vitro and a hypoglycemic effect in diabetic animals, although less Akt activation is provoked than insulin, indicating that adequate Akt activation is triggered by this compound to mediate the metabolic effect.
A few classes of nonpeptidyl IR activators with different modes of mechanistic actions also have been reported. For example, TLK19780 and its derivative TLK16998 are insulin sensitizers, which potentiate insulin-triggered IR phosphorylation (37,38). However, these compounds are inactive when insulin is absent. We also found that 4548-G05 potentiates the action of insulin in promoting IR activation and glucose uptake. This synergistic effect may be a result of the differential usage of ligand binding sites between insulin and 4548-G05. Hence, IR could be simultaneously bound by both 4548-G05 and insulin. Yet it is surprising that no significant changes can be detected in the differential HDX studies during the 4548-G05–IR interaction. 4548-G05 presumably drives changes within the H-bonding network of the IR-ECD that are below the detection limit of HDX–mass spectrometry, given its small size and presumably small interaction surface. It is also possible that the limited solubility of 4548-G05 prevented full receptor occupancy during the exchange reaction. Finally, it is possible that 4548-G05 displays a faster off-rate compared with insulin, thus preventing detection in the HDX time regimen. Nevertheless, our docking simulation suggested that 4548-G05 binds to IR on a region outside the insulin binding site (Supplementary Fig. 7). Further experiments are needed to empirically determine the detailed IR binding site for 4548-G05. We have recently identified a novel naphthoquinone derivative, DDN, that also synergizes the action of insulin on IR activation (9). In terms of functional activity, both compounds are specific IR activators that can promote glucose uptake in cultured cells and animals. DDN, however, binds to the IR tyrosine kinase directly to initiate the IR activity (9), which is different from 4548-G05, which targets the ECD. The identification of these structurally different IR activators not only contributes a potential alternative for treatment of DM but also provides a domain-specific tool to study IR functions.
Interestingly, 4548-G05 administration requires a shorter time to significantly lower blood glucose in fasting T2DM mice (1 h) than normal C57/BL6 controls (3 h) (Figs. 5D and 6C). Similar observations have been reported in other studies using quinone-based insulin mimetics, suggesting that it may be a common characteristic of small-molecular-weight IR activators (9,36). The mechanism of this interesting function is unclear in the present stage. It is also interesting to find that 4548-G05 has a long IR activation half-life in vitro and is resistant to hepatic metabolism. In animals, the hypoglycemic effect of 4548-G05 lasts about 4–5 h. This sustained effect may reduce the daily frequency of drug usage while the blood glucose levels can still be tightly controlled. However, this long-acting function might not be necessarily beneficial; in particular, 4548-G05 has a higher preference in activating ERK signaling than the Akt pathway (Figs. 2A and 5A) because the application of the long-lasting insulin glarine significantly increases cancer risk (39). In particular, women using glarine monotherapy have an increased incidence of breast cancer when compared with women using other types of insulin (40). These results concur with the mitogenic function of long-lasting insulin: it enhances more proliferation of HCT116 colorectal cancer cells in vitro (41). Other complications such as higher incidence of macular edema also have been reported in patients in glargine trials (42). In contrast to human studies, long-term treatment with glarine insulin displays no carcinogenic effects in rat and mice, but a large portion of animals receiving lifelong glarine administration died of hypoglycemia (43). Although we could not exclude the possibility that chronic treatment with 4548-G05 might cause an undesirable mitogenic effect in some tissues because of the robust ERK signaling activation, no noticeable side effects were observed in mice receiving daily oral administration of 4548-G05 for 14 days.
Some IR activators, such as CPD2, a derivative of DAQ-B1 (36,44), prevent food intake and weight gain in mice (45,46). We also have chronically treated db/db mice with 4548-G05 for 2 weeks and tested whether the compound can suppress the appetite. Food intake was not significantly changed after 4548-G05 administration (data not shown), leading to a body weight comparable to that of the control group receiving vehicle. Blood chemistry analysis also revealed no significant alteration between the vehicle- and drug-treated mice, indicating that the small compound does not provoke severe toxicity in vivo. Indeed, 4548-G05 displays mild cytotoxicity in cultured HepG2 cells at high concentrations (>25 μmol/L), with no genotoxicity observed. We also found no demonstrable toxicity during the pathological examination of all major organs of mice treated with 4548-G05 for 14 days (data not shown). Thus, 4548-G05 is a safe compound when a 5 mg/kg dosage is used. It is conceivable that one of the major efforts in optimizing 4548-G05 in the future is to synthesize compounds with more robust IR agonistic activity and diminished cytotoxicity to reduce the potential side effects.
Together, our data support that 4548-G05 mimics the biological actions of insulin by specifically binding to IR to increase its kinase activity. 4548-G05 is an orally bioavailable compound that lowers blood glucose in both normal and insulin-resistant mice through enhancing glucose uptake in insulin-sensitive tissue.
Supplementary Material
Article Information
Acknowledgments. The authors thank Dr. Chunli Yan of Georgia State University and Dr. Kim Gernert of Emory University for their help in performing the docking study.
Funding. This work is supported by National Institutes of Health grant CA127119 to K.Y.
Duality of Interest. No potential conflicts of interest relevant to this article were reported.
Author Contributions. G.Q., S.X., D.G., and C.B.C. performed the experiments, analyzed the data, and wrote the manuscript. J.J.Y., E.A.O., and K.Y. analyzed the data and wrote the article. G.D. and P.R.G. analyzed the data. X.P. and X.L. performed the experiments. K.Y. is the guarantor of this work and, as such, had full access to all the data in the study and takes responsibility for the integrity of the data and the accuracy of the data analysis.
Footnotes
This article contains Supplementary Data online at http://diabetes.diabetesjournals.org/lookup/suppl/doi:10.2337/db13-0334/-/DC1.
C.B.C. is currently affiliated with the Department of Physiology, University of Oklahoma Health Sciences Center, Oklahoma City, OK.
References
- 1.Saltiel AR, Kahn CR. Insulin signalling and the regulation of glucose and lipid metabolism. Nature 2001;414:799–806 [DOI] [PubMed] [Google Scholar]
- 2.Desvergne B, Michalik L, Wahli W. Transcriptional regulation of metabolism. Physiol Rev 2006;86:465–514 [DOI] [PubMed] [Google Scholar]
- 3.Bluestone JA, Herold K, Eisenbarth G. Genetics, pathogenesis and clinical interventions in type 1 diabetes. Nature 2010;464:1293–1300 [DOI] [PMC free article] [PubMed] [Google Scholar]
- 4.Campbell RK. Type 2 diabetes: where we are today: an overview of disease burden, current treatments, and treatment strategies. J Am Pharm Assoc (2003) 2009;49(Suppl. 1):S3–S9 [DOI] [PubMed] [Google Scholar]
- 5.Richardson T, Kerr D. Skin-related complications of insulin therapy: epidemiology and emerging management strategies. Am J Clin Dermatol 2003;4:661–667 [DOI] [PubMed] [Google Scholar]
- 6.García-Vicente S, Yraola F, Marti L, et al. Oral insulin-mimetic compounds that act independently of insulin. Diabetes 2007;56:486–493 [DOI] [PubMed] [Google Scholar]
- 7.Wilkie N, Wingrove PB, Bilsland JG, et al. The non-peptidyl fungal metabolite L-783,281 activates TRK neurotrophin receptors. J Neurochem 2001;78:1135–1145 [DOI] [PubMed] [Google Scholar]
- 8.Tsai HJ, Chou SY. A novel hydroxyfuroic acid compound as an insulin receptor activator. Structure and activity relationship of a prenylindole moiety to insulin receptor activation. J Biomed Sci 2009;16:68. [DOI] [PMC free article] [PubMed] [Google Scholar]
- 9.He K, Chan CB, Liu X, et al. Identification of a molecular activator for insulin receptor with potent anti-diabetic effects. J Biol Chem 2011;286:37379–37388 [DOI] [PMC free article] [PubMed] [Google Scholar]
- 10.Levy-Toledano R, Caro LH, Hindman N, Taylor SI. Streptavidin blotting: a sensitive technique to study cell surface proteins; application to investigate autophosphorylation and endocytosis of biotin-labeled insulin receptors. Endocrinology 1993;133:1803–1808 [DOI] [PubMed] [Google Scholar]
- 11.Goswami D, Devarakonda S, Chalmers MJ, Pascal BD, Spiegelman BM, Griffin PR. Time window expansion for HDX analysis of an intrinsically disordered protein. J Am Soc Mass Spectrom 2013;24:1584–1592 [DOI] [PMC free article] [PubMed] [Google Scholar]
- 12.Pascal BD, Willis S, Lauer JL, et al. HDX workbench: software for the analysis of H/D exchange MS data. J Am Soc Mass Spectrom 2012;23:1512–1521 [DOI] [PMC free article] [PubMed] [Google Scholar]
- 13.Trott O, Olson AJ. AutoDock Vina: improving the speed and accuracy of docking with a new scoring function, efficient optimization, and multithreading. J Comput Chem 2010;31:455–461 [DOI] [PMC free article] [PubMed] [Google Scholar]
- 14.Miller BM, Pujadas E, Gocke E. Evaluation of the micronucleus test in vitro using Chinese hamster cells: results of four chemicals weakly positive in the in vivo micronucleus test. Environ Mol Mutagen 1995;26:240–247 [DOI] [PubMed] [Google Scholar]
- 15.Kivovich V, Gilbert L, Vuento M, Naides SJ. The putative metal coordination motif in the endonuclease domain of human Parvovirus B19 NS1 is critical for NS1 induced S phase arrest and DNA damage. Int J Biol Sci 2012;8:79–92 [DOI] [PMC free article] [PubMed] [Google Scholar]
- 16.Kozics K, Valovicova Z, Slamenova D. Structure of flavonoids influences the degree inhibition of Benzo(a)pyrene - induced DNA damage and micronuclei in HepG2 cells. Neoplasma 2011;58:516–524 [DOI] [PubMed] [Google Scholar]
- 17.Burgering BM, Coffer PJ. Protein kinase B (c-Akt) in phosphatidylinositol-3-OH kinase signal transduction. Nature 1995;376:599–602 [DOI] [PubMed] [Google Scholar]
- 18.Posner BI, Faure R, Burgess JW, et al. Peroxovanadium compounds. A new class of potent phosphotyrosine phosphatase inhibitors which are insulin mimetics. J Biol Chem 1994;269:4596–4604 [PubMed] [Google Scholar]
- 19.Salmeen A, Andersen JN, Myers MP, Tonks NK, Barford D. Molecular basis for the dephosphorylation of the activation segment of the insulin receptor by protein tyrosine phosphatase 1B. Mol Cell 2000;6:1401–1412 [DOI] [PubMed] [Google Scholar]
- 20.Ahn JH, Cho SY, Ha JD, et al. Synthesis and PTP1B inhibition of 1,2-naphthoquinone derivatives as potent anti-diabetic agents. Bioorg Med Chem Lett 2002;12:1941–1946 [DOI] [PubMed] [Google Scholar]
- 21.Pang XB, Xie XM, Wang SB, Du GH. [High-throughput screening of human soluble protein tyrosine phosphatase 1B inhibitors]. Yao Xue Xue Bao 2011;46:1058–1064 [PubMed] [Google Scholar]
- 22.Chan CB, Liu X, Tang X, Fu H, Ye K. Akt phosphorylation of zyxin mediates its interaction with acinus-S and prevents acinus-triggered chromatin condensation. Cell Death Differ 2007;14:1688–1699 [DOI] [PubMed] [Google Scholar]
- 23.Huang Y, Zhou Y, Castiblanco A, Yang W, Brown EM, Yang JJ. Multiple Ca(2+)-binding sites in the extracellular domain of the Ca(2+)-sensing receptor corresponding to cooperative Ca(2+) response. Biochemistry 2009;48:388–398 [DOI] [PMC free article] [PubMed] [Google Scholar]
- 24.Zaccaro MC, Lee HB, Pattarawarapan M, et al. Selective small molecule peptidomimetic ligands of TrkC and TrkA receptors afford discrete or complete neurotrophic activities. Chem Biol 2005;12:1015–1028 [DOI] [PubMed] [Google Scholar]
- 25.Chalmers MJ, Pascal BD, Willis S, et al. Methods for the analysis of high precision differential hydrogen deuterium exchange data. Int J Mass Spectrom 2011;302:59–68 [DOI] [PMC free article] [PubMed] [Google Scholar]
- 26.Musille PM, Pathak MC, Lauer JL, Hudson WH, Griffin PR, Ortlund EA. Antidiabetic phospholipid-nuclear receptor complex reveals the mechanism for phospholipid-driven gene regulation. Nat Struct Mol Biol 2012;19:532–537, S1–2 [DOI] [PMC free article] [PubMed] [Google Scholar]
- 27.Menting JG, Whittaker J, Margetts MB, et al. How insulin engages its primary binding site on the insulin receptor. Nature 2013;493:241–245 [DOI] [PMC free article] [PubMed] [Google Scholar]
- 28.Houde D, Demarest SJ. Fine details of IGF-1R activation, inhibition, and asymmetry determined by associated hydrogen /deuterium-exchange and peptide mass mapping. Structure 2011;19:890–900 [DOI] [PubMed] [Google Scholar]
- 29.Sekita S, Yoshihira K, Natori S, et al. Mycotoxin production by Chaetomium spp. and related fungi. Can J Microbiol 1981;27:766–772 [DOI] [PubMed] [Google Scholar]
- 30.Koyama K, Natori S. Chaetochromins B, C and D, bis(naphtho-gamma-pyrone) derivatives from Chaetomium gracile. Chem Pharm Bull (Tokyo) 1987;35:578–584 [DOI] [PubMed] [Google Scholar]
- 31.Singh SB, Zink DL, Bills GF, et al. Four novel bis-(naphtho-gamma-pyrones) isolated from Fusarium species as inhibitors of HIV-1 integrase. Bioorg Med Chem Lett 2003;13:713–717 [DOI] [PubMed] [Google Scholar]
- 32.Ishii R, Horie M, Koyama K, Ishikawa Y, Kitanaka S. Inhibitory effects of fungal bis(naphtho-gamma-pyrone) derivatives on nitric oxide production by a murine macrophage-like cell line, RAW 264.7, activated by lipopolysaccharide and interferon-gamma. Biol Pharm Bull 2005;28:786–790 [DOI] [PubMed] [Google Scholar]
- 33.Zhang B, Salituro G, Szalkowski D, et al. Discovery of a small molecule insulin mimetic with antidiabetic activity in mice. Science 1999;284:974–977 [DOI] [PubMed] [Google Scholar]
- 34.Qureshi SA, Ding V, Li Z, et al. Activation of insulin signal transduction pathway and anti-diabetic activity of small molecule insulin receptor activators. J Biol Chem 2000;275:36590–36595 [DOI] [PubMed] [Google Scholar]
- 35.Lin B, Li Z, Park K, et al. Identification of novel orally available small molecule insulin mimetics. J Pharmacol Exp Ther 2007;323:579–585 [DOI] [PubMed] [Google Scholar]
- 36.Liu K, Xu L, Szalkowski D, et al. Discovery of a potent, highly selective, and orally efficacious small-molecule activator of the insulin receptor. J Med Chem 2000;43:3487–3494 [DOI] [PubMed] [Google Scholar]
- 37.Pender C, Goldfine ID, Manchem VP, et al. Regulation of insulin receptor function by a small molecule insulin receptor activator. J Biol Chem 2002;277:43565–43571 [DOI] [PubMed] [Google Scholar]
- 38.Manchem VP, Goldfine ID, Kohanski RA, et al. A novel small molecule that directly sensitizes the insulin receptor in vitro and in vivo. Diabetes 2001;50:824–830 [DOI] [PubMed] [Google Scholar]
- 39.Hemkens LG, Grouven U, Bender R, et al. Risk of malignancies in patients with diabetes treated with human insulin or insulin analogues: a cohort study. Diabetologia 2009;52:1732–1744 [DOI] [PMC free article] [PubMed] [Google Scholar]
- 40.Jonasson JM, Ljung R, Talbäck M, Haglund B, Gudbjörnsdòttir S, Steineck G. Insulin glargine use and short-term incidence of malignancies-a population-based follow-up study in Sweden. Diabetologia 2009;52:1745–1754 [DOI] [PubMed] [Google Scholar]
- 41.Yehezkel E, Weinstein D, Simon M, Sarfstein R, Laron Z, Werner H. Long-acting insulin analogues elicit atypical signalling events mediated by the insulin receptor and insulin-like growth factor-I receptor. Diabetologia 2010;53:2667–2675 [DOI] [PubMed] [Google Scholar]
- 42.Yki-Järvinen H, Dressler A, Ziemen M, HOE 901/300s Study Group Less nocturnal hypoglycemia and better post-dinner glucose control with bedtime insulin glargine compared with bedtime NPH insulin during insulin combination therapy in type 2 diabetes. HOE 901/3002 Study Group. Diabetes Care 2000;23:1130–1136 [DOI] [PubMed] [Google Scholar]
- 43.Stammberger I, Bube A, Durchfeld-Meyer B, Donaubauer H, Troschau G. Evaluation of the carcinogenic potential of insulin glargine (LANTUS) in rats and mice. Int J Toxicol 2002;21:171–179 [DOI] [PubMed] [Google Scholar]
- 44.Wood HB, Jr, Black R, Salituro G, et al. The basal SAR of a novel insulin receptor activator. Bioorg Med Chem Lett 2000;10:1189–1192 [DOI] [PubMed] [Google Scholar]
- 45.Air EL, Strowski MZ, Benoit SC, et al. Small molecule insulin mimetics reduce food intake and body weight and prevent development of obesity. Nat Med 2002;8:179–183 [DOI] [PubMed] [Google Scholar]
- 46.Strowski MZ, Li Z, Szalkowski D, et al. Small-molecule insulin mimetic reduces hyperglycemia and obesity in a nongenetic mouse model of type 2 diabetes. Endocrinology 2004;145:5259–5268 [DOI] [PubMed] [Google Scholar]
Associated Data
This section collects any data citations, data availability statements, or supplementary materials included in this article.