

Abstract
Expression of neuropilin-1 (NRP-1) has been shown in many cancer cells, but its molecular effect on tumorigenesis is largely unknown. In this report, we show that in aggressive types of renal cell carcinoma (RCC), NRP-1 is expressed at a high level. We show that after knockdown of NRP-1 by short hairpin RNA, RCC cells express significantly lower levels of MDM-2 and p63 proteins but higher levels of p53, and exhibit reduced migration and invasion. When implanted in mice, RCC cells with a reduced NRP-1 level have a statistically significant smaller tumor-forming ability than control cells. Also, NRP-1 knockdown RCC cells exhibit a more differentiated phenotype, as evidenced by the expression of epithelial-specific and kidney-specific cadherins, and the inhibition of sonic hedgehog expression participated in this effect. Inhibition of sonic hedgehog expression can be reversed by ΔNp63α overexpression. Our study reveals that NRP-1 helps maintain an undifferentiated phenotype in cancer cells.
Introduction
Neuropilin-1 (NRP-1) is a cell surface glycoprotein and was initially characterized as a neuronal guidance molecule (1, 2). NRP-1 is also expressed in endothelial cells and has been found to regulate endothelial cell migration and survival with or without vascular endothelial growth factor (VEGF) receptor (VEGFR) as its coreceptor (3–5). Loss of NRP-1 function results in vascular remodeling and branching defects (6).
Although the role of NRP-1 in neural and vascular development has been well investigated, its role in tumorigenesis is largely unknown. NRP-1 is expressed at high levels in many cancers, and its expression correlates closely with advanced tumor stage and poor patient prognosis in specific tumor types, suggesting a role in tumor progression (7, 8). Also, a recent report showed that the use of an anti–NRP-1 antibody in combination with an anti-VEGF antibody led to a better therapeutic efficacy in preclinical models (9). This evidence has suggested a role for neuropilin in tumor progression and has made NRP-1 a valuable candidate in cancer therapy.
Clear cell renal cell carcinoma (RCC) is the most common type of kidney cancer arising from the renal tubule. Neither chemotherapy nor radiation therapy has been shown to be effective against metastatic RCC. Interestingly, NRP-1 is also expressed in normal renal tubular epithelial cells (10). NRP-1 was shown to be required for VEGF-induced branching morphogenesis/tubulogenesis in renal epithelial cells (10). However, the molecular role of NRP-1 in RCC is thus far unknown. Here, we show for the first time that NRP-1 can regulate sonic hedgehog (Shh) expression through ΔNp63α and tumorigenic phenotypes of RCC cells.
Materials and Methods
Cell culture
Human RCC cell lines 786-O, A-498, 769-P, Caki-1, and Caki-2 (purchased from American Type Culture Collection) were maintained as described.
Plasmids
The expression plasmid encoding ΔNp63α was kindly provided by Dr. Madhavi P. Kadakia (Wright State University, Dayton, OH). The plasmids for NRP-1 short hairpin RNA (shRNA) were purchased from Open Biosystems. The targeting sequence for NRP-1 was 5′-CCCTGTTGGTTTCATTTGAATA-3′ (sh-NRP-1 C1) and 5′-ACGGACCCATACCAGAGAATTA-3′ (sh-NRP-1 C2).
Virus production and infection
Retroviruses [for NRP-1 shRNA, dominant-negative Akt (DN-Akt), constitutively active Akt (CA-Akt), dominant negative mutant of Rac-1 (DN-Rac-1), and controls] and lentiviruses [for matrix metalloproteinase-9 (MMP-9) shRNA and control] were prepared and infected to the target cells as described (4). After infection, 2 μg/mL of puromycin was added to the medium for antibiotic selection, and cell clones were selected for further experiments.
Western blot analysis
Western blot were performed as described (4).
Primers used in reverse transcription-PCR
Primers used in the experiment are as follows: NRP-1 F 5′-AGG ACA GAG ACT GCA AGT ATG AC-3′, NRP-1 R 5′-AAC ATT CAG GAC CTC TCT TGA-3′ (209 bp); Flt-1 F 5′-GTC ACA GAA GAG GAT GAA GGT GTC TA-3′, Flt-1 R 5′-CAC AGT CCG GCA CGT AGG TGA TT-3′(417 bp); KDR F 5′-CTG GCA TGG TCT TCT GTG AAG CA-3′, KDR R 5′-AAT ACC AGT GGA TGT GAT GCG G-3′ (790 bp); Flt-4 F 5′-CAG GAT GAA GAC ATT TGA GG-3′, Flt-4 R 5′-AAG AAA ATG CTG ACG TAT GC-3′(190 bp). p63 isoform-specific PCR primer sequences were synthesized as previously reported (11).
Migration and invasion assay
Cell migration was performed as described previously (4). Fetal bovine serum (10%) was added to the bottom wells of the chambers as chemoattractant. The invasion assay was performed similarly to the migration assay except that transwell chambers were coated with 4 mg/mL of Matrigel (BD Bioscience), and the incubation time was 6 h.
Rac-1 pulldown assay
Protocols as described (Upstate Cell Signaling Solutions) were followed for Rac-1. Immunoblotting was performed with an anti–Rac-1 antibody.
Gelatin and casein zymography analysis
Cells were plated and incubated in complete medium. Cells then were washed with PBS and incubated with serum-free medium for 48 h. The medium was recovered, and protein concentration was measured using the Bio-Rad protein assay. Total proteins (100 μg) were loaded for zymography on zymogram gels containing gelatin or casein (Bio-Rad) and run at 150 V for 1.5 h in nonreducing conditions. Gel proteins were renatured twice in 50 mmol/L of Tris (pH 7.5)/0.1 mol/L NaCl/2.5% Triton X-100 for 30 min at room temperature, washed with water, and then incubated for 16 h or longer in 50 mmol/L of Tris/10 mmol/L CaCl2/0.02% sodium azide. Gels were stained with Coomassie blue and destained in 5% acetic acid/10% methanol.
Subcutaneous tumor model
Female 6-week-old nude mice were obtained from the NIH. The mice were housed in institutional animal facilities. All animal work was performed under protocols approved by the Mayo Clinic Institutional Animal Care and Use Committee. To establish tumor growth in mice, 5 × 10⁶ 786-O cells or 786-O NRP-1 knockdown cells, resuspended in 100 μL of PBS, were injected s.c. Tumors were measured every 2 weeks. Primary tumor volumes were calculated with the formula V = 1/2 a × b2, where a is the longest tumor axis, and b is the shortest tumor axis.
Statistical analysis
Statistical analyses were performed with the statistical SPSS 11.0 software (SPSS, Inc.). The independent-samples t test was used to test the probability of significant differences between groups. Statistical significance was defined as P < 0.05, and a high level of statistical significance was defined as P < 0.01.
Results and Discussion
Expression of NRP-1 in RCC cells
We examined several RCC cell lines (786-O, A-498, 769-P, Caki-1, and Caki-2) and found NRP-1 expression to be significantly higher in higher-grade (786-O, A-498, and Caki-1) compared with lower-grade invasive cell lines (769-P and Caki-2; Fig. 1A; for the invasion data of RCC cell lines, see Supplementary Fig. S1A). In the normal human kidney epithelial cells (RPTE and HEK293 cells), NRP-1 expression was also much lower compared with the RCC cells (Fig. 1A). Because studies have shown that when VEGFRs are expressed in cancers, NRP-1 acts as a coreceptor (7, 8), we determined the expression of VEGFRs in RCC cells with reverse transcription-PCR and found only NRP-1 expression consistently. No Flt-1 was found in all RCC cells and a weak KDR expression was found in the Caki-1 cell but not in the other RCC cells; plus, weak Flt-4 expression was found in A-498, 769-P, Caki-1, and Caki-2 compared with human umbilical vascular endothelial cells but not in 786-O (Fig. 1B).
Figure 1.
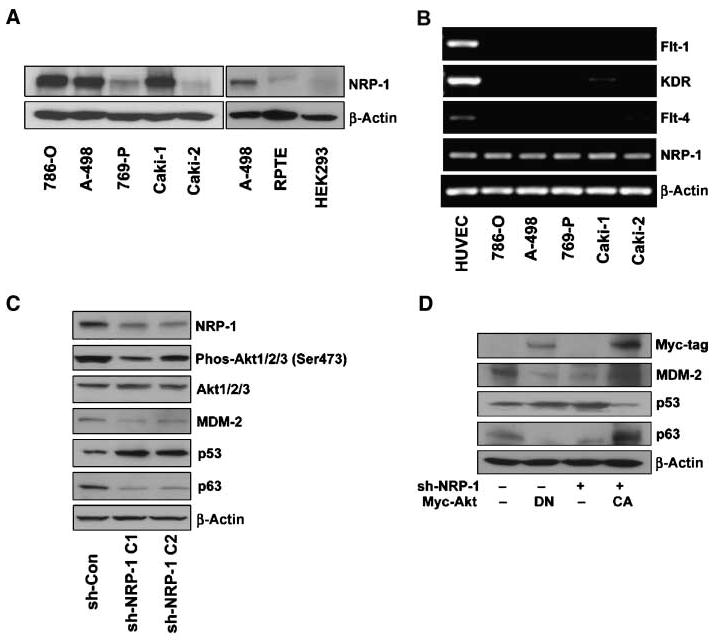
NRPs and VEGFR expression on RCC cells. A, Western blot analysis of NRP-1 expression on RCC cell lines 786-O, A-498, 769-P, Caki-1, and Caki-2. NRP-1 expression on normal kidney epithelial cells RPTE and HEK293 compared with A-498. B, NRP-1 and VEGFRs (Flt-1, KDR, and Flt-4) expression on RCC cells by reverse transcription-PCR. Human umbilical vascular endothelial cells (HUVEC), which are known to express each of these receptors, were used for a positive control. C, NRP-1 was knocked down in 786-O cells by retrovirus-mediated shRNA. The effects of NRP-1 knockdown on the levels of phosphorylated and total Akt-1/2/3, MDM-2, p53, and p63 by Western blot analysis. β-Actin was used as a loading control. D, control and sh-NRP-1 786-O cells were transfected with Myc-tagged DN-Akt or CA-Akt, respectively. Myc-tag, MDM-2, p53, and p63 levels were examined by Western blot.
Effect of NRP-1 knockdown on Akt-MDM-2-p53 and p63 signaling
Using retrovirus-mediated shRNAs (sh-NRP-1 C1 and sh-NRP-1 C2), we knocked down NRP-1 in 786-O cells. In a previous report, we showed that Akt and p53 were the downstream mediators of NRP-1 in endothelial cells (12). Here, in RCC cells, we also found that the NRP-1 knockdown led to substantial reductions in the phosphorylation of Akt (55% or 26% reduction for sh-NRP-1 C1 or sh-NRP-1 C2, respectively). Downstream of Akt, we further found decreased levels MDM-2 and p63, and increased levels of p53 in NRP-1 knockdown cells, as compared with controls (Fig. 1C). The use of DN-Akt and CA-Akt confirmed that Akt modulates the levels of MDM-2, p53, and p63 in RCC cells (Fig. 1D). Similar results were also observed in another RCC cell line (A-498; Supplementary Fig. S1B) but we mainly focused on 786-O for our subsequent in vitro experiments.
Examination of the tumorigenic properties of NRP-1 knockdown RCC cells
To examine the role of NRP-1 in RCC, we investigated cell proliferation, migration, and invasion after knocking down NRP-1. Although NRP-1 knockdown led to a decreased level of phosphorylated Akt and an increased level of p53 which led to endothelial cell apoptosis (12), we neither observed significant changes in cell proliferation nor cell apoptosis in RCC cells (data not shown).
Furthermore, we performed migration and invasion assays and observed that NRP-1 knockdown of RCC cells showed significantly reduced migration and invasion compared with that of control cells (Fig. 2A). These observations were also persistent in wound-healing assays (Supplementary Fig. S1C). Taking into account the possibility that the reduced migration/invasion was caused by a change in cell adherence, we found no difference in adhesion between control and NRP-1 knockdown cells (Supplementary Fig. S1D). Analysis of the conditioned medium by gelatin zymography revealed that the release of MMP-9 was significantly reduced in NRP-1 knockdown cells, although there was no significant change in MMP-2 activity (Fig. 2B). Because MMP-2 and MMP-9 are the most abundant MMPs secreted by 786-O cells, it is therefore likely that an alteration of MMP-9 expression in NRP-1 knockdown cells may cause altered migration/invasion.
Figure 2.

The role of NRP-1 on 786-O cell migration and invasion. A, NRP-1 knockdown reduced migration and invasion in 786-O cells. B, MMP production of control and NRP-1 knockdown 786-O cells was determined by gelatin zymogram. MMP-9 production was decreased in NRP-1 knockdown cells; MMP-2 activity did not change. C, active Rac-1 levels in control and NRP-1 knockdown 786-O cells. Active Rac-1 was decreased in NRP-1 knockdown cells. D, the role of Rac-1 and MMP-9 in 786-O cell migration and invasion. Transfecting DN-Rac-1 into 786-O cells decreased both migration and invasion; MMP-9 knockdown by shRNA only decreased cell invasion, not migration (*, P < 0.05).
We then investigated the effects of NRP-1 knockdown on the activities of small GTPases (Rho, Rac-1, and Cdc-42) which are important in controlling cell mobility. We found that Rac-1 activity was significantly reduced (Fig. 2C). Furthermore, DN-Rac-1 or MMP-9 shRNA-expressing RCC cells showed a reduction in invasion but migration was reduced only in DN Rac-1-expressing cells (Fig. 2D). Hence, NRP-1-mediated activation of Rac-1 and up-regulation of MMP-9 are important components for RCC cell migration and invasion.
We overexpressed EGNP-1 (a chimeric receptor resulting from the fusion of the extracellular domain of epidermal growth factor receptor to the transmembrane and intracellular domains of NRP-1) and EGNP-1ΔSEA (EGNP-1 lacking its COOH-terminal three amino acids SEA; see ref. 4 for details on these chimeric receptors) into 769-P cell. Overexpression of EGNP-1 increased 769-P cell invasion, but EGNP-1ΔSEA did not (Supplementary Fig. S2A).
Tumorigenesis in vivo of NRP-1 knockdown in RCC cells
To determine the in vivo effect of NRP-1 on RCC (786-O and A-498), 5 × 10⁶ control or NRP-1 knockdown cells were injected into the right flank of nude mice (786-O, n = 14; A-498, n = 10). Ten weeks post-tumor injection, tumor volumes were measured. Subcutaneous tumors formed from NRP-1 knockdown cells were significantly smaller by 87.7% or 86.2%, compared with the controls (786-O cells, 119.3 ± 59.3 mm3 versus 965.6 ± 265.1 mm3, P = 0.002; A-498 cells, 96.5 ± 38.6 mm3 versus 695.6 ± 280.2 mm3, P = 0.01; data are represented as mean ± SE; Fig. 3A).
Figure 3.
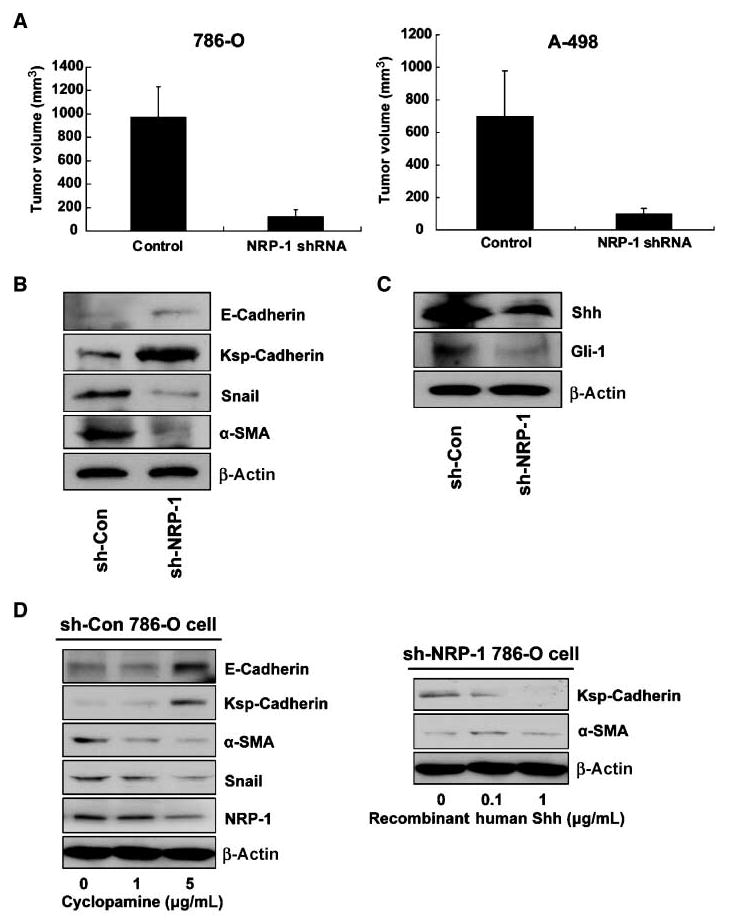
A, the effect of NRP-1 on RCC cell tumorigenesis in vivo. Control and NRP-1 knockdown RCC cells were injected s.c. in nude mice (786-O, n = 14; A-498, n = 10). After 10 wk, tumor volume was measured. Tumor volume was calculated by the formula V = 1/2 a × b2, where a is the longest tumor axis, and b is the shortest tumor axis. Columns, mean; bars, SE. B, the effect of NRP-1 knockdown on immature and mature renal epithelial cell markers by Western blot analysis. NRP-1 knockdown elevated E-cadherin and Ksp-cadherin (mature renal epithelial markers), and decreased levels of α-SMA and Snail, which are immature renal epithelial progenitor cell markers. C, the effect of NRP-1 knockdown on Shh and its and downstream molecule Gli-1 by Western blot analysis. D, the effect of the Smo inhibitor cyclopamine on 786-O cells (left). Cyclopamine (0,1, and 5 μg/mL) treatment reversed the increase in E-cadherin and Ksp-cadherin expression, whereas α-SMA and Snail levels decreased in a dose-dependent manner. Right, the effect of Shh on NRP-1 knockdown 786-O cells. Recombinant Shh was added to the medium at 0, 0.1, and 1 μg/mL. Ksp-cadherin levels increased and α-SMA decreased in a dose-dependent fashion.
Cell differentiation marker expression
These interesting but startling results prompted us to postulate that NRP-1 expression is specifically responsible for tumorigenesis. Cancer stem cells promote tumorigenesis, and at the same time, generate a large population of differentiated progeny that make up the bulk of the tumor. These tumorigenic cancer stem cells undergo processes that are analogous to the self-renewal and differentiation of normal stem cells, causing cancer relapse and metastasis. In this context, we asked whether the loss of tumorigenesis in NRP-1 knockout cells is caused by the differentiation of the tumorigenic cancer cells. As expected, we did observe elevated levels of the specific epithelial markers epithelial cadherin (E-cadherin) and kidney-specific cadherin (Ksp-cadherin) in NRP-1 knockdown RCC cells, whereas the expressions of specific mesenchymal markers Snail and α-SMA were decreased (Fig. 3B). Immunohistochemical analysis of the tumor also showed more Ksp-cadherin expression in NRP-1 knockdown tumors than in control tumors (Supplementary Fig. S2B). Because the kidney epithelium originates from cells that undergo a mesenchymal-to-epithelial transition during embryonic development (13), we can postulate from our results that the cancer cells exhibit a more mature differentiated phenotype after NRP-1 knockdown.
Shh pathway activity in NRP-1 knockdown cells
Shh signaling is important in kidney development as it regulates the proliferation and differentiation of mesenchymal cells in the metanephric kidney (14). Shh deficiency or cyclopamine-mediated Smo inhibition, through the action of Gli-1, disrupts renal organogenesis (15). Shh is also important in tumorigenesis and suppression of the Shh pathway can eliminate tumor growth (16). Recently, Shh signaling was shown to be involved in embryonic vasculogenesis, vascular remodeling, and axonal guidance, processes resembling the NRP-1 knockout phenotype (17, 18). As shown in Fig. 3C, the expression of Shh protein in NRP-1 knockdown cells as well as its downstream activator Gli-1, was reduced.
Interestingly, Shh can up-regulate NRP-1 expression and inhibition of NRP-1 blocked Shh-induced cell migration (19).
Hence, we speculate that the reduction of Shh production due to NRP-1 knockdown might induce enhanced differentiation of RCC cells. To further examine whether the changes to the differentiation phenotype of RCCs were due to the decreased Shh expression, we used cyclopamine, a Smo inhibitor, to inhibit the effect of Shh in 786-O cells. When cyclopamine was added to the medium at concentrations of 1 and 5 μg/mL, E-cadherin and Ksp-cadherin expression levels were increased and α-SMA and Snail were decreased in a dose-dependent fashion (Fig. 3D); NRP-1 levels also decreased after cyclopamine treatment. Next, we determined whether the addition of Shh protein to the NRP-1 knockdown 786-O cells could inhibit the expression of these cell differentiation markers. Recombinant human Shh was added to the medium at dosages of 0.1 and 1.0 μg/mL, and as expected, Ksp-cadherin levels were decreased whereas α-SMA increased in a dose-dependent fashion (Fig. 3D). Additionally, cyclopamine can inhibit RCC cells migration and invasion, whereas treatment of Shh boosts the tumorigenic phenotype of NRP-1 knockdown RCC cells (Supplementary Fig. S2C and D). Of importance, it has been shown in a prior report that NRP-1 expression might be the target of Shh signaling (19). These results showed that Shh and NRP-1 signaling are both required for maintaining the cell dedifferentiation status and that these signals crosstalk with each other. Taken together, our results strongly suggest that NRP-1 knockdown promotes RCC cells to more differentiated forms partly due to its inability to express Shh.
ΔNp63α expressed in 786-O cells and overexpressed in NRP-1 knockdown cells retrieves Shh expression
We then focused on identifying the mechanism resulting in the observed Shh reduction in NRP-1 knockdown RCC cells. Shh expression can be induced by p63 overexpression (20) but we found p63 to be down-regulated in NRP-1 knockdown cells (Fig. 1D). p63 has six isoforms (TAp63α, TAp63β, TAp63γ, ΔNp63α, ΔNp63β, and ΔNp63γ) and the NH2-terminally truncated (ΔN) isoforms are the most commonly expressed in many epithelial tissues. Using an antibody which can detect all p63 isoforms in a Western blot, we observed a single prominent band at ∼75 kDa, corresponding to the molecular weight of ΔNp63α. A p63 isoform-specific RT-PCR was also performed and only ΔNp63α was detected (Fig. 4A). Overexpression of ΔNp63α in NRP-1 knockdown cells restored Shh expression as detected by Western blot and real-time PCR (Fig. 4B and C), whereas knockdown of p53 by small interfering RNA did not affect Shh expression (Fig. 4D). Overall, our data established a unique pathway in which the NRP-1/Akt axis up-regulates Shh through ΔNp63α and maintains the RCC cells to restore the dedifferentiation state.
Figure 4.

A, expression of p63 isoforms in 786-O cells detected by isoform-specific reverse transcription-PCR. As shown, ΔNp63α is the only isoform expressed in 786-O. B and C, overexpression of ΔNp63α in NRP-1 knockdown cells can retrieve Shh expression. The ΔNp63α expression plasmid was transfected into NRP-1 knockdown cells (at 0, 0.02, 0.1, 0.5, and 2.5 μg/well of a six-well plate) and Shh expression was examined by Western blot (B) and real-time PCR (C). ΔNp63α expression up-regulates Shh expression. D, knockdown of p53 does not affect Shh expression. p53 was knocked down in control and NRP-1 knockdown 786-O cells and Shh expression was examined by Western blot. Shh levels were not significantly altered after p53 knockdown.
In summary, our data show a high level of NRP-1 expression in RCC which is associated with cell migration, invasion, and in vivo tumor growth. We found that the knockdown of NRP-1 reduced the RCC cell line 786-O production of Shh, which can act in either an autocrine or paracrine fashion to those cells. Shh production was repressed through a reduction in the levels of ΔNp63α. Shh reduction is accompanied by an increased production of E-cadherin and Ksp-cadherin and a decreased production of Snail and α-SMA, classic markers indicating the transition from a mesenchymal cell to an epithelial cell. Although the “kidney stem cell” has still not been found in the adult, it is well known in embryonic development that the kidney epithelium originates from cells that undergo a mesenchymal-to-epithelial transition. This suggests that NRP-1 knockdown induced the RCC cells to a more mature kidney epithelial cell phenotype. It will be imperative to determine in future studies whether inactivation of the NRP-1 pathways can overcome the quiescent phenotype of cancer stem cells which are wholly responsible for the relapse of cancer.
Supplementary Material
Acknowledgments
Grant support: NIH grants CA78383, and a generous gift from Bruce and Martha Atwater. D. Mukhopadhyay is a Scholar of the American Cancer Society.
We offer our sincere thanks to Drs. N. Kay, S. Shah, and S. Chari for their helpful suggestions, and to Dr. Kadakia for ΔNp63α expression vectors.
Footnotes
Note: Supplementary data for this article are available at Cancer Research Online (http://cancerres.aacrjournals.org/).
Disclosure of Potential Conflicts of Interest: No potential conflicts of interest were disclosed.
References
- 1.He Z, Tessier-Lavigne M. Neuropilin is a receptor for the axonal chemorepellent Semaphorin III. Cell. 1997;90:739–51. doi: 10.1016/s0092-8674(00)80534-6. [DOI] [PubMed] [Google Scholar]
- 2.Kolodkin AL, Levengood DV, Rowe EG, Tai YT, Giger RJ, Ginty DD. Neuropilin is a semaphorin III receptor. Cell. 1997;90:753–62. doi: 10.1016/s0092-8674(00)80535-8. [DOI] [PubMed] [Google Scholar]
- 3.Soker S, Takashima S, Miao HQ, Neufeld G, Klagsbrun M. Neuropilin-1 is expressed by endothelial and tumor cells as an isoform-specific receptor for vascular endothelial growth factor. Cell. 1998;92:735–45. doi: 10.1016/s0092-8674(00)81402-6. [DOI] [PubMed] [Google Scholar]
- 4.Wang L, Zeng H, Wang P, Soker S, Mukhopadhyay D. Neuropilin-1-mediated vascular permeability factor/vascular endothelial growth factor-dependent endothelial cell migration. J Biol Chem. 2003;278:48848–60. doi: 10.1074/jbc.M310047200. [DOI] [PubMed] [Google Scholar]
- 5.Wang L, Mukhopadhyay D, Xu X. C terminus of RGS-GAIP-interacting protein conveys neuropilin-1-mediated signaling during angiogenesis. FASEB J. 2006;20:1513–5. doi: 10.1096/fj.05-5504fje. [DOI] [PubMed] [Google Scholar]
- 6.Kawasaki T, Kitsukawa T, Bekku Y, et al. A requirement for neuropilin-1 in embryonic vessel formation. Development. 1999;126:4895–902. doi: 10.1242/dev.126.21.4895. [DOI] [PubMed] [Google Scholar]
- 7.Ellis LM. The role of neuropilins in cancer. Mol Cancer Ther. 2006;5:1099–107. doi: 10.1158/1535-7163.MCT-05-0538. [DOI] [PubMed] [Google Scholar]
- 8.Bielenberg DR, Pettaway CA, Takashima S, Klagsbrun M. Neuropilins in neoplasms: expression, regulation, and function. Exp Cell Res. 2006;312:584–93. doi: 10.1016/j.yexcr.2005.11.024. [DOI] [PubMed] [Google Scholar]
- 9.Pan Q, Chanthery Y, Liang WC, et al. Blocking neuropilin-1 function has an additive effect with anti-VEGF to inhibit tumor growth. Cancer Cell. 2007;11:53–67. doi: 10.1016/j.ccr.2006.10.018. [DOI] [PubMed] [Google Scholar]
- 10.Karihaloo A, Karumanchi SA, Cantley WL, Venkatesha S, Cantley LG, Kale S. Vascular endothelial growth factor induces branching morphogenesis/tubulogenesis in renal epithelial cells in a neuropilin-dependent fashion. Mol Cell Biol. 2005;25:7441–8. doi: 10.1128/MCB.25.17.7441-7448.2005. [DOI] [PMC free article] [PubMed] [Google Scholar]
- 11.Di Iorio E, Barbaro V, Ruzza A, Ponzin D, Pellegrini G, De Luca M. Isoforms of ΔNp63 and the migration of ocular limbal cells in human corneal regeneration. Proc Natl Acad Sci U S A. 2005;102:9523–8. doi: 10.1073/pnas.0503437102. [DOI] [PMC free article] [PubMed] [Google Scholar]
- 12.Wang L, Dutta SK, Kojima T, et al. Neuropilin-1 modulates p53/caspases axis to promote endothelial cell survival. PLoS ONE. 2007;2:e1161. doi: 10.1371/journal.pone.0001161. [DOI] [PMC free article] [PubMed] [Google Scholar]
- 13.Horster MF, Braun GS, Huber SM. Embryonic renal epithelia: induction, nephrogenesis, and cell differentiation. Physiol Rev. 1999;79:1157–91. doi: 10.1152/physrev.1999.79.4.1157. [DOI] [PubMed] [Google Scholar]
- 14.Yu J, Carroll TJ, McMahon AP. Sonic hedgehog regulates proliferation and differentiation of mesenchymal cells in the mouse metanephric kidney. Development. 2002;129:5301–12. doi: 10.1242/dev.129.22.5301. [DOI] [PubMed] [Google Scholar]
- 15.Hu MC, Mo R, Bhella S, et al. GLI3-dependent transcriptional repression of Gli1, Gli2 and kidney patterning genes disrupts renal morphogenesis. Development. 2006;133:569–78. doi: 10.1242/dev.02220. [DOI] [PubMed] [Google Scholar]
- 16.Romer JT, Kimura H, Magdaleno S, et al. Suppression of the Shh pathway using a small molecule inhibitor eliminates medulloblastoma in Ptc1(+/−)p53(−/−) mice. Cancer Cell. 2004;6:229–40. doi: 10.1016/j.ccr.2004.08.019. [DOI] [PubMed] [Google Scholar]
- 17.Vokes SA, Yatskievych TA, Heimark RL, et al. Hedgehog signaling is essential for endothelial tube formation during vasculogenesis. Development. 2004;131:4371–80. doi: 10.1242/dev.01304. [DOI] [PubMed] [Google Scholar]
- 18.Charron F, Stein E, Jeong J, McMahon AP, Tessier-Lavigne M. The morphogen sonic hedgehog is an axonal chemoattractant that collaborates with netrin-1 in midline axon guidance. Cell. 2003;113:11–23. doi: 10.1016/s0092-8674(03)00199-5. [DOI] [PubMed] [Google Scholar]
- 19.Hochman E, Castiel A, Jacob-Hirsch J, Amariglio N, Izraeli S. Molecular pathways regulating pro-migratory effects of Hedgehog signaling. J Biol Chem. 2006;281:33860–70. doi: 10.1074/jbc.M605905200. [DOI] [PubMed] [Google Scholar]
- 20.Caserta TM, Kommagani R, Yuan Z, Robbins DJ, Mercer CA, Kadakia MP. p63 overexpression induces the expression of Sonic hedgehog. Mol Cancer Res. 2006;4:759–68. doi: 10.1158/1541-7786.MCR-05-0149. [DOI] [PubMed] [Google Scholar]
Associated Data
This section collects any data citations, data availability statements, or supplementary materials included in this article.