

Abstract
Introduction
Despite evidence-based guidelines for venous thromboembolism prevention, substantial variability is found in practice. Many economic evaluations of new drugs for thromboembolism prevention do not occur prospectively with efficacy studies and are sponsored by the manufacturers, raising the possibility of bias. We performed a systematic review of economic analyses of venous thromboembolism prevention in hospitalized patients to inform clinicians and policy makers about cost-effectiveness and the potential influence of sponsorship.
Methods
We searched MEDLINE, EMBASE, Cochrane Databases, ACP Journal Club, and Database of Abstracts of Reviews of Effects, from 1946 to September 2011. We extracted data on study characteristics, quality, costs, and efficacy.
Results
From 5,180 identified studies, 39 met eligibility and quality criteria. Each addressed pharmacologic prevention: low-molecular-weight heparins versus placebo (five), unfractionated heparin (12), warfarin (eight), one or another agents (five); fondaparinux versus enoxaparin (11); and rivaroxaban and dabigatran versus enoxaparin (two). Low-molecular-weight heparins were most economically attractive among most medical and surgical patients, whereas fondaparinux was favored for orthopedic patients. Fondaparinux was associated with increased bleeding events. Newer agents rivaroxaban and dabigatran may offer additional value. Of all economic evaluations, 64% were supported by manufacturers of a "new" agent. The new agent had a favorable outcome in 38 (97.4%) of 39 evaluations [95% confidence interval [CI] (86.5 to 99.9)]. Among studies supported by a pharmaceutical company, the sponsored medication was economically attractive in 24 (96.0%) of 25 [95% CI, 80.0 to 99.9)]. We could not detect a consistent bias in outcome based on sponsorship; however, only a minority of studies were unsponsored.
Conclusion
Low-molecular-weight heparins and fondaparinux are the most economically attractive drugs for venous thromboembolism prevention in hospitalized patients. Approximately two thirds of evaluations were supported by the manufacturer of the new agent; such drugs were likely to be reported as economically favorable.
Introduction
Venous thromboembolism occurs in up to 40% of hospitalized medical and surgical patients in the absence of prophylactic anticoagulation [1,2]. Even with prophylaxis, the risk of venous thromboembolism in critically ill patients approaches 10% and has serious consequences: untreated pulmonary embolism has a mortality rate approaching 25% [3-5]. Among critically ill patients, those developing venous thromboembolism have longer intensive care unit and hospital stays, longer duration of mechanical ventilation, and higher hospital mortality [6]. Consequently, venous thromboembolism not only is associated with serious morbidity and mortality, but also has major implications for healthcare resource utilization.
Appropriate use of prophylaxis to prevent venous thromboembolism in patients at risk has been identified as one of the most important patient-safety interventions for hospitals [7]. However, substantial variability is found in the use of such prophylaxis in practice. Prevention is most commonly achieved with anticoagulant drugs. Because important decisions about pharmacologic interventions are made with knowledge of their economic consequences, formal economic analyses are useful tools to guide clinicians and policy makers about the value of drug interventions and their consequences [8,9]. However, many evaluations of new drugs do not occur prospectively with efficacy studies, and many are sponsored by the manufacturers, raising the possibility of bias.
We performed a systematic review of economic analyses of venous thromboembolism-prevention strategies in acutely ill hospitalized patients. Our objectives were to review and critically appraise the economic evaluations of a broad spectrum of strategies in diverse patient groups to help inform clinicians and policy makers about the cost-effectiveness of various approaches to venous thromboembolism prophylaxis.
Materials and methods
Date sources and searches
We searched MEDLINE, EMBASE, the Cochrane Database of Systematic Reviews, ACP Journal Club, Database of Abstracts of Reviews of Effects (DARE), and Cochrane Controlled Trials Register from 1946 to October 21, 2011, by using a combination of the following subject headings and text words: venous thrombosis, pulmonary embolism, low-molecular-weight heparin, LMWH, dalteparin, enoxaparin, nadroparin, tinzaparin, heparin, unfractionated heparin, UFH, anticoagulants, warfarin, aspirin, fondaparinux, rivaroxaban, dabigatran, intermittent pneumatic compression devices, compression stockings, vena cava filters, venous foot pump, economics, health care cost, cost-effectiveness analysis, cost-benefit analysis, and economic analysis (Additional file 1). No limits regarding publication type were initially applied. To identify additional potentially relevant studies, we checked the reference lists of identified systematic and narrative reviews and the personal files of the authors and collaborators. We also sent the full list of identified articles and inclusion criteria to venous thromboembolism experts in the field to identify additional published or relevant unpublished studies.
Study selection
From 5,180 potentially relevant citations, 4,816 were excluded based on title and abstract review (Figure 1). The full text versions of 89 manuscripts were retrieved for full evaluation. Two reviewers (ST, RF) independently assessed each of the articles and applied the following eligibility criteria: (a) the economic evaluation was based on data from randomized controlled trials or meta-analyses of randomized controlled trials; (b). the study described hospitalized patients; (c) the study compared at least two different venous thromboembolism prophylaxis strategies; (d) the study described drug-acquisition costs, the costs of providing prophylaxis, costs of complications (including venous thromboembolism treatment and prophylaxis failures); and (e) the study described the effect of prophylaxis with respect to the number of venous thromboembolism events prevented and diagnosed. We excluded evaluations based on the following study designs: 1. cohort studies or other observational studies; 2. studies on outpatient use of venous thromboembolism prophylaxis; 3. studies on the treatment of venous thromboembolism; 4. studies examining the efficacy of short-term versus long-term venous thromboembolism prophylaxis; 5. decision analytic models based on data from nonrandomized trials; 6. studies examining anticoagulants for conditions other than venous thromboembolism, and seven letters, editorials, or narrative reviews of economic issues in venous thromboembolism prophylaxis. We also excluded studies appraised as low to moderate quality, as defined later.
Figure 1.

Study eligibility diagram.
Data extraction and quality assessment
We critically appraised each article by using established criteria [9]. Our goal was to include only those studies that adhered to a high methodologic quality. We assigned an ordinal score of quality based on the criteria set forth in the "User's guide to the medical literature: XIII. How to use an article on economic analysis of clinical practice" [9]. With a semiquantitative scale incorporating these characteristics, we assigned 1 point for each of the 12 categories. All studies were graded as high (≥ 9 points), medium (5 to 8 points), or low (0 to 4 points) quality by two authors (ST, RF). Disagreements about the inclusion of individual studies were resolved by consensus between two authors (ST, RF). Of the 84 articles selected for full review, 50 were appraised as low or moderate quality, and the remaining 39 studies were selected for data abstraction.
We identified 10 economic evaluations of mechanical prophylaxis, including intermittent pneumatic compression devices, compression stockings, or vena cava filters [10-17]. None of these articles met our previously stated eligibility criteria.
From each included study, we abstracted the following: the patient group, venous thromboembolism prophylaxis strategy, duration of prophylaxis, time frame of the study, source of the outcome data, source of the cost data, incremental costs and benefits of each strategy, results of any sensitivity analyses, the country in which the study was performed, and the declared source of funding for the economic analysis. We attempted to contact authors of studies for which no external support was declared to ensure that this was the case.
We abstracted the number of thrombotic events, costs, and complication rates of the prophylaxis and of the treatment of venous thromboembolism from each article. We then recorded or calculated the incremental cost-efficacy ratio for each venous thromboembolism prophylaxis strategy. If we were unable to calculate the incremental cost-efficacy ratio because of missing data, we attempted to contact the authors to obtain this ratio or original data. Costs were converted to 2009 US dollars and adjusted for country-specific temporal changes in gross domestic product [18-20]. We standardized the incremental effects we reported as "venous thromboembolism events avoided," "life-years or quality adjusted life-years gained' or 'deaths avoided per 1000 patients', as is commonly performed in venous thromboembolism literature. We chose in-hospital or near-term (< 90 days) events for the primary comparisons whenever possible, as the short and longer-term effects of inpatient thromboprophylaxis are often greatest during this time period.
Data synthesis and analysis
Heterogeneity of the interventions, perspectives, and time-horizons precluded meta-analytic techniques to combine incremental cost-efficacy ratios into a single summary statistic. We summarized cost-effectiveness ratios by graphic representation of point estimates on a cost-efficacy plane. Categoric variables and proportions were compared by using the χ2 or Exact tests as appropriate.
Results
Study comparisons, populations, and format
Among the 39 studies included in this review, the following comparisons were made: low-molecular-weight heparins versus placebo (five) [20-24]; unfractionated heparin versus low-molecular-weight heparins (12) [21,23-33]; various low-molecular-weight heparins versus warfarin (eight) [34-41]; various low-molecular-weight heparins compared with one another or other agents (five) [31,42-45]; fondaparinux versus enoxaparin (11) [46-56], rivaroxaban versus low-molecular-weight heparins or dabigatran [57], and dabigatran versus low-molecular-weight heparin [58] (Tables 1 and 2).
Table 1.
Study characteristics
| Study characteristics | Number of studies |
|---|---|
| Thromboprophylaxis compared | |
| Low-molecular-weight heparin versus placebo | 5 |
| Low-molecular-weight heparin versus unfractionated heparin | 12 |
| Low-molecular-weight heparin versus warfarin | 8 |
| Low-molecular-weight heparin versus fondaparinux | 11 |
| Other | 7 |
| Patient population | |
| Orthopedic surgery | 26 |
| Other surgical | 5 |
| Medical | 8 |
| Funding | |
| Industry | 25 |
| Other or unknown | 14 |
| Geographic perspective | |
| US | 18 |
| UK | 6 |
| Continental Europe | 11 |
| Canada | 4 |
Table 2.
Study description and quality assessment
| Article | Interventions compared | Patient group | Were the outcomes accurately measured? | Were the costs accurately measured? | Was uncertainty in analysis determined? | Were estimates and costs related to the baseline risk in treatment population? |
|---|---|---|---|---|---|---|
| Pechevis, 2000 | Enoxaparin 40 mg daily versus placebo for 6-14 days | Medical | Yes; outcomes taken from RCTs | Yes; data from literature | Yes | Yes |
| Lloyd, 2001 | UFH 5,000 units twice daily versus enoxaparin 40 mg daily for 6-14 days | Medical | Yes; outcomes taken from RCTs | Yes; data from literature | Yes | Yes |
| Lamy, 2002 | Enoxaparin 20 mg versus 40 mg versus placebo for 6-14 days | Medical | Yes; outcomes taken from RCTs | Yes; data from hospital, OHIP | Yes | Yes |
| Offord, 2003 | Enoxaparin 40 mg daily versus UFH 5,000 units twice daily versus none for 6-14 days | Medical | Yes; outcomes taken from RCT/meta-analysis | Yes; data from a hospital | Yes | Yes |
| Schadlich, 2006 | Enoxaparin 40 mg versus UFH 5,000 units three times daily for 6-14 days | Medical | Yes; outcomes taken from RCTs/meta-analysis | Yes; data from the German Health System | Yes | Yes |
| Drummond, 1994 | UFH 5,000 units 3 times daily versus enoxaparin 40 mg daily for 7 days | HFS | Yes; outcomes taken from RCTs | Yes; data from literature | Yes | Yes |
| Hawkins, 1997 | Enoxaparin 30 mg daily versus UFH 5,000 units for 7 days | THR | Yes; outcomes taken from RCTs | Yes; data from literature | Yes | Yes |
| Marchetti, 1999 | UFH 5,000 units twice daily versus LMWH enoxaparin 40 mg daily for 14 days | THR | Yes; outcomes taken from RCTs/meta-analysis | Yes; data from literature | Yes | Yes |
| McGarry, 2004 | UFH 5,000 units twice daily versus enoxaparin 40 mg daily versus nothing for 30 days | Medical | Yes; outcomes taken from RCTs/meta-analysis | Yes; data from literature | Yes | Yes |
| Deitelzweig, 2008 | UFH 5,000 units twice daily versus enoxaparin 40 mg daily versus nothing for 5 days | Medical | Yes; outcomes taken from RCTs | Yes; data from literature | Yes | Yes |
| Wade, 2008 | UFH 5,000 units 3 times daily versus dalteparin 5,000 units daily for 10 days | Gynecology oncology surgery | Yes; outcomes taken from RCTs | Yes; data from literature | Yes | Yes |
| Lloyd, 1997 | UFH 5,000 units twice daily/3 times daily versus nadroparin for 10-14 days | Orthopedic and general surgery | Yes; outcomes taken from meta-analysis | Yes; data from published rates of pay, costs from a hospital | Yes | Yes |
| Heerey, 2005 | Dalteparin 2,500 units versus 5,000 units versus UFH for 10 days | Abdominal surgery | Yes; outcomes taken from RCTs | Yes; data from Medicare reimbursement | Yes | Yes |
| O'Brien, 1994 | Enoxaparin 30 mg twice daily versus warfarin for 7 days | THR | Yes; outcomes taken from RCTs | Yes; data from literature | Yes | Yes |
| Menzin, 1995 | Enoxaparin 30 mg twice daily versus warfarin (INR 2-3) versus nothing for 5-14 days | THR | Yes; outcomes taken from RCTs | Yes; data from literature | Yes | Yes |
| Hull, 1997 | Warfarin versus tinzaparin 175 units/kg for 14 days | THR, TKR | Yes; outcomes taken from RCTs | Yes; data from literature | Yes | Yes |
| Hawkins, 1998 | Enoxaparin 30 mg twice daily versus warfarin for 10 days | TKR | Yes; outcomes taken from RCTs | Yes; data from literature | Yes | Yes |
| Francis, 1999 | Dalteparin 2,500 units, then 5,000 units versus warfarin for 10 days | THR | Yes; outcomes taken from RCTs | Yes; costs from participating hospitals in RCT | Yes; for costs | Yes |
| Botteman, 2002 | Enoxaparin 30 mg daily versus warfarin 5 mg daily for 7 days | THR | Yes; outcomes taken from RCTs | Yes; data from literature | Yes | Yes |
| Caprini, 2002 | Enoxaparin 30 mg twice daily for 7 days versus UFH 5,000 units 3 times daily and warfarin for 10 days | THR | Yes; outcomes taken from RCTs | Yes; data from literature | Yes | Yes |
| Levin, 2001 | Desirudin 15 mg twice daily versus enoxaparin 40 mg daily for 10 days | THR | Yes; outcomes taken from RCTs | Yes; data from literature | Yes | Yes |
| Honorato, 2004 | Bemiparin 3,500 units daily versus enoxaparin 40 mg daily for 8-12 days | TKR | Yes; outcomes taken from RCTs | Yes; data from National Health Care Institute, pharmacists association | Yes | Yes |
| Attanasio, 2001 | Dermatan sulfate 300 mg daily versus UFH 5,000 units 3 times daily for 7 days | Surgical oncology | Yes; outcomes taken from RCTs | Yes - data from hospital costs | Yes | Yes |
| Wade, 2001 | Tinzaparin 3,500 units versus enoxaparin 30 mg twice daily for 8 weeks | Spinal cord injury | Yes; outcomes taken from RCTs | Yes; data from different hospitals, DRG | Yes | Yes |
| Were estimates and costs related to the baseline risk in treatment population- are these results generalizable? | ||||||
| Gordois, 2003 | Enoxaparin 40 mg daily versus fondaparinux 2.5 mg daily for 5-9 days | THR, HFS | Yes; outcomes taken from RCTs | Yes; data from NICE | Yes | Yes |
| Lundkvist, 2003 | Fondaparinux 2.5 mg daily versus enoxaparin 40 mg daily for 7 days | THR, HFS | Yes; outcomes taken from RCTs | Yes; data from literature | Yes | Yes |
| Wade, 2003 | Fondaparinux 2.5 mg daily versus enoxaparin 40 mg daily versus 30 mg twice daily for 7-10 days | HFS | Yes; outcomes taken from RCTs | Yes; data from literature | Yes | Yes |
| Szucs, 2003 | Fondaparinux 2.5 mg daily versus enoxaparin 40 mg daily for 7 days | THR, TKR HFS | Yes; outcomes taken from RCTs | Yes; data from literature and surveys in Switzerland | Yes | Yes |
| Sullivan, 2004 | Fondaparinux 2.5 mg daily versus enoxaparin 40 mg daily for 7 days | THR, TKR HFS | Yes; outcomes taken from RCTs | Yes; costs from review of 220 acute care hospitals | Yes | Yes |
| Dranitsaris, 2004 | Fondaparinux 2.5 mg daily versus enoxaparin 40 mg daily for 7 days | THR, HFS | Yes; outcomes taken from a meta-analysis | Data from CIHI, surveys | Yes | Yes |
| Spruill, 2004 | Fondaparinux 2.5 mg daily versus enoxaparin 30 mg twice daily for 4-5 days | TKA | Yes; outcomes taken from RCTs | Yes; data from literature | Yes | Yes |
| Spruill, 2004 | Fondaparinux 2.5 mg daily versus enoxaparin 30 mg twice daily for 10 days | THR | Yes; outcomes taken from RCTs | Yes; data from literature | Yes | Yes |
| Wade, 2004 | Fondaparinux 2.5 mg daily versus enoxaparin 40 mg daily for 7 days | HFS | Yes; outcomes taken from RCTs | Yes; data from literature | Yes | Yes |
| Bjorvatn, 2005 | Fondaparinux 2.5 mg daily versus enoxaparin 40 mg daily for 7 days | THR, TKR HFS | Yes; outcomes taken from RCTs | Yes; data from Norwegian national sources | Yes | Yes |
| Wolowacz 2009 | THR Dabigatran 220 mg daily versus enoxaparin 40 mg daily for 28-35 days TKR Dabigatran 220 mg daily for versus enoxaparin 40 mg daily 6-10 days | THR, TKR | Yes; outcomes taken from RCTs | Yes; data from UK national sources | Yes | Yes |
| McCullagh, 2009 | THR Dabigatran 220 mg daily for 35 days versus rivaroxaban 10 mg daily for 35 days versus enoxaparin 40 mg daily for 14 days TKR Dabigatran 220 mg daily for 14 days versus rivaroxaban 10 mg daily for 10 days versus enoxaparin 40 mg daily for 10 days | THR, TKR | Yes; outcomes taken from RCTs | Yes; data from literature and Irish national sources | Yes | Yes |
| Pechevis, 2000 | Yes | N/R | No | Yes | Yes | Yes |
| Lloyd, 2001 | Yes | N/R | No | Yes | Yes | Yes |
| Lamy, 2002 | Yes | N/R | No | Yes | Yes | Yes |
| Offord, 2003 | Yes | N/R | No | Yes | Yes | Yes |
| Schadlich, 2006 | Incompletely | N/R | No | Yes | Yes | Yes |
| Drummond, 1994 | Incompletely | N/R | No | Yes | Yes | Likely |
| Hawkins, 1997 | Yes | N/R | No | Yes | Yes | Yes |
| Marchetti, 1999 | Incompletely | N/R | No | Yes | Yes | Yes |
| Etchells, 1999 | Yes | N/R | No | Yes | Yes | Yes |
| McGarry, 2004 | Incompletely | N/R | No | Yes | Yes | Yes |
| Article | Were incremental costs and outcomes measured? | Do incremental costs and outcomes differ between subgroups? | Does allowance for uncertainty change results? | Are prophylaxis benefits worth the harm and costs? | Generalizability: could other patient populations expect similar outcomes? | Generalizability: could other patient populations expect to experience similar costs? |
| Heerey, 2005 | Incompletely | N/R | No | Yes | Yes | Likely |
| Deitelzweig, 2008 | Yes | N/R | No | Yes | Yes | Likely |
| Wade, 2008 | Yes | Yes | Yes | Yes | Yes | Yes |
| O'Brien, 1994 | Yes | N/R | No | Yes | Yes | Yes |
| Menzin, 1995 | Yes | N/R | No | Yes | Yes | Yes |
| Hull, 1997 | Yes | N/R | No | Yes | Yes | Yes |
| Hawkins, 1998 | Yes | N/R | No | Yes | Yes | Yes |
| Francis, 1999 | Yes | Yes | Yes | Likely | Yes | Yes |
| Botteman, 2002 | Incompletely | N/R | No | Yes | Perhaps | Yes |
| Nerurkar, 2002 | Incompletely | N/R | No | Yes | Perhaps | Yes |
| Levin, 2001 | Incompletely | N/R | No | Yes | Yes | Likely |
| Caprini, 2002 | Yes | Yes | No | Yes | Yes | Likely |
| Were incremental costs and outcomes measured? | Do incremental costs and outcomes differ between subgroups? | Does allowance for uncertainty change results? | Are prophylaxis benefits worth the harm and costs? | Generalizability: could other patient populations expect similar outcomes? | Generalizability: could other patient populations expect to experience similar costs? | |
| Honorato, 2004 | Yes | N/R | No | Yes | Yes | Yes |
| Wade, 2001 | Incompletely | N/R | No | Yes | Yes | Yes |
| Gordois, 2003 | Yes | N/R | No | Yes | Yes | Yes |
| Wade, 2003 | Yes | N/R | No | Yes | Yes | Yes |
| Annemans, 2004 | Yes | N/R | No | Yes | Yes | Yes |
| Attanasio, 2001 | Yes | N/R | No | Yes | Yes | Yes |
| Szucs, 2003 | Yes | Yes | No | Yes | Yes | Yes |
| Sullivan, 2004 | Yes | Yes | No | Yes | Yes | Yes |
| Dranitsaris, 2004 | Yes | N/R | No | Yes | Yes | Yes |
| Spruill, 2004 | Yes | N/R | No | Yes | Yes | Yes |
| Spruill, 2004 | Yes | N/R | No | Yes | Yes | Yes |
| Wade, 2004 | Yes | N/R | No | Yes | Yes | Yes |
| Bjorvatn, 2005 | Yes | Yes | No | Yes | Yes | Yes |
| Wolowacz 2009 | Yes | Yes | No | Yes | Yes | Yes |
| McCullagh 2009 | Yes | Yes | No | Yes | Yes | Yes |
CIHI, Canadian Institute for Health Information; DRG, diagnosis-related group; HFS, hip fracture surgery; NICE, National Centre for Clinical Excellence
N/R, not reported; OHIP, Ontario Health Insurance Plan; RCT, randomized controlled trial; THR, total hip replacement; TKR, total knee replacement; UFH, unfractionated heparin.
Twenty-six evaluations were performed in orthopedic patients [25-27,34-43,46-58]; five in other surgical populations [28,30-32,44], and eight in medical patients [20-24,29,33,45]. All 39 studies were either decision analytic models based on individual randomized controlled trials [20-22,24,26,28,31-49,51-58] or meta-analysis [23,27,29,30,51].
Study perspectives, time horizon, and funding
The studies were conducted from a North American or European economic perspective: 18 of the studies were conducted in the United States [26,29,31-41,45,48,51-53,55], six in the United Kingdom [21,23,25,46,57,58], four in Canada [23,28,34,51], and three in Italy [27,30,44], two in Sweden [42,47], and one each in Spain [43], Belgium [49], France [20], Norway [54], Switzerland [56], and Germany [24]. Seven studies were conducted from the perspective of the hospital [24,41,42,44,45,49,53], four from a societal perspective [20,28,30,32], nine from the perspective of another specific payer [23,31,33,40,54-58], and the remaining 19 studies did not clearly specify which perspective was used.
The prophylaxis time horizons considered were variable: either for 5 days [33,51]; 7 days [25,28,34,38,44,46-50,53-56]; 6 to 14 days [23]; 10 days [31,32,37,40,41,52], 8 to 12 days [43]; 7 to 14 days [26]; 6 to 14 days [57], 10 to 14 days [20,22-24,27,30,35,36,39,42-46]; 30 days [29], 8 to 33 days [59], and another for 8 weeks [45]. Twenty-five studies received some sponsorship by pharmaceutical companies [20,22-25,28,30,33-38,40,41,43,44,46,47,50,54-56,58].
Study quality
All 39 studies that were of high quality were included in this systematic review (Table 2). Eighteen of these showed complete cost data but did not present complete effectiveness data [25-27,29,31,37-45,51,54-56]. The remaining 17 studies had complete cost and effectiveness data. Six of the studies obtained effectiveness data from meta-analysis [23,25,27,31,50,57], whereas the remainder obtained effectiveness data from one or more randomized controlled trials. Six of these studies obtained effectiveness data from a single trial [20,22-24,33,41]. All studies, with the exception of one [23], obtained cost data from multiple sources, including actual and estimated healthcare system costs, randomized controlled trials, literature reviews, and other national government sources. All performed sensitivity analyses of some description.
Cost and effect estimates
Low Molecular Weight Heparins versus Placebo
Among the five studies comparing low-molecular-weight heparins with placebo in medical patients, enoxaparin was the most economically attractive strategy in all five studies and dominant in two [20,22], with incremental cost-efficacy ratios ranging from $83 to $1,711 per venous thromboembolism event avoided in three others [21,23,24]; cost per life-year or quality-adjusted life-year gained were not investigated (Table 3). Sensitivity analysis did not alter these findings. Four of the five studies were sponsored by the manufacturer of enoxaparin [20-22,24].
Table 3.
Incremental costs, effects, and cost-efficacy ratios for the different modes of venous thromboembolism prophylaxis
| Low-molecular-weight heparins versus placebo | ||||||
|---|---|---|---|---|---|---|
| Reference | Patient population | Incremental cost (USD) | Incremental effects (VTE avoided or life-years or QALYS gained) | ICER (USD/VTE event avoided or life-years or QALYS gained) | Bleeding complications | Most economically attractive drug |
| *Pechevis, 2000 | Medical | Net saving (value not reported) per 1,000 patients with enoxaparin | 94 DVT/PE avoided, four lives (estimated 12 life-years) gained, per 1,000 patients with enoxaparin | Enoxaparin dominant | Not reported | Enoxaparin |
| Lloyd, 2001 | Medical | $20,680 per 1,000 patients with enoxaparin | 20 VTE events avoided per 1,000 patients with enoxaparin | $1, 034 per VTE avoided with enoxaparin | Six more major bleeding events per 1,000 patients with enoxaparin | Enoxaparin |
| *Lamy, 2002 | Medical | $1, 910 per 1,000 patients in tertiary care setting with enoxaparin | 2.3% fewer VTE events with enoxaparin | $83 per VTE avoided with enoxaparin | Not reported | Enoxaparin |
| *Offord, 2004 | Medical | Net saving ($26,478) per 1,000 patients with enoxaparin | 14 VTE events and 3.5 deaths avoided per 1,000 patients with enoxaparin | Enoxaparin dominant | Not reported | Enoxaparin |
| *Schaldich, 2006 | Medical | $44,665 per 1,000 patients with enoxaparin | 26 VTE events avoided per 1,000 patients with enoxaparin | $1, 711 per VTE avoided with enoxaparin | Not reported | Enoxaparin |
| Low-molecular-weight heparins versus unfractionated heparin | ||||||
| Reference | Patient population | Incremental cost (USD) | Incremental effects (VTE avoided or life-years or QALYS gained) | ICER (USD/VTE event avoided or life-years or QALYS gained) | Bleeding complications | Most economically attractive drug |
| *Drummond, 1994, enoxaparin | HFS | Net saving ($43,609) per 1,000 patients with enoxaparin | Four deaths avoided per 1,000 patients with enoxaparin | Enoxaparin dominant | Not reported | Enoxaparin |
| *Hawkins, 1997, enoxaparin | THR | $57,972 per 1,000 patients with enoxaparin | 47 DVT events avoided per 1,000 patients with enoxaparin | $1, 180 per VTE event avoided with enoxaparin | Not reported (implied enoxaparin increased bleeding risk) | Enoxaparin |
| Marchetti, 1999, enoxaparin | THR | Net saving ($90,000) per 1,000 patients with enoxaparin | 70 life-years gained per, 1000 patients with enoxaparin | Enoxaparin dominant | Not reported | Enoxaparin |
| *Etchells, 1999, enoxaparin | Colorectal surgery | $180,641 per 1,000 patients with enoxaparin | 0 VTE events avoided with enoxaparin | UFH dominant | 12 additional major bleeding events with enoxaparin | UFH |
| Lloyd, 2001, enoxaparin | Medical | Net saving ($850) per 1,000 patients with enoxaparin | 21 VTE events avoided per 1,000 patients with enoxaparin | Enoxaparin dominant | 18 fewer major bleeding events with Enoxaparin | Enoxaparin |
| *Offord, 2003, enoxaparin | Medical | Net saving ($54,649) per 1,000 patients with Enoxaparin | 20.5 VTE events and 0.5 deaths avoided per 1,000 patients with enoxaparin | Enoxaparin dominant | Not reported | Enoxaparin |
| *McGarry, 2004, enoxaparin | Medical | $14,459 per 1,000 patients with enoxaparin | 10 VTE events and 4.4 deaths avoided per 1,000 patients with enoxaparin | $1, 445 per VTE event avoided, and $10,360 per death avoided with enoxaparin | 2.7% fewer bleeding events, 0.9% fewer episodes of HIT | Enoxaparin |
| *Schadlich, 2006, enoxaparin | Medical | Net saving ($46,499) per 1,000 patients with Enoxaparin | N/R | Enoxaparin dominant | 7.7 fewer major bleeding episodes with enoxaparin | Enoxaparin |
| *Deitelzweig, 2008 | Medical | Net saving ($339,361) per 1,000 patients with enoxaparin | 11 VTE events, three deaths avoided per 1,000 patients with enoxaparin | Enoxaparin dominant | Five major bleeding events, four episodes of HIT avoided per 1,000 patients with enoxaparin | Enoxaparin |
| Wade, 2008, enoxaparin | Gynecology oncology Surgery | Net saving ($36,197) per 1,000 patients with enoxaparin | Eight DVTs, 18 PE events avoided per 1,000 patients with enoxaparin | Enoxaparin dominant | 21 additional major bleeding events per 1,000 patients with enoxaparin | Enoxaparin |
| *Lloyd, 1997, nadroparin | Orthopedics | Net savings ($192,000) per 1,000 patients with enoxaparin | 50 VTE events avoided per 1,000 patients with enoxaparin | Enoxaparin dominant | Not reported | Nadroparin |
| General surgery | Net savings ($33,000) per 1,000 patients with enoxaparin | Nine VTE events avoided per 1,000 patients with enoxaparin | Nadroparin dominant | Not reported | Nadroparin | |
| Heerey, 2005, dalteparin | General surgery | $473,000 per 1,000 patients with dalteparin | 21 QALYs per 1,000 patients with dalteparin | $20,337/QALY gained with dalteparin | Not reported | Dalteparin |
| Low-molecular-weight heparins versus warfarin | ||||||
| Reference | Patient population | Incremental cost (USD) | Incremental effects (VTE avoided or life-years or QALYS gained) | ICER (USD/VTE event avoided or life-years or QALYS gained) | Bleeding complications | Most economically attractive drug |
| *O'Brien, 1994, enoxaparin | THR | $133,571 per 1,000 patients with LMWH | Five VTE events, 0.4 deaths avoided per 1,000 patients with LMWH | $26,711 per VTE event avoided, $334,055 per death avoided, $32,158 per life-year gained with LMWH | Not reported | LMWH |
| *Menzin, 1995, enoxaparin | THR | $69,659 per 1,000 patients with LMWH | 20.1 VTE events and 4.3 deaths avoided per 1,000 patients with LMWH | $3,466 per VTE avoided, $16,200 per additional death avoided | Not reported | LMWH |
| *Hull, 1997, tinzaparin | TKR, THR | Net saving ($52,690) per 1,000 patients with LMWH | 60 VTE events avoided per 1,000 patients with LMWH | LMWH dominant | 2.2% increase in major bleeding events with LMWH | LMWH |
| *Hawkins, 1998, enoxaparin | TKR | $126,766 per 1,000 patients with LMWH | 145 VTE events avoided per 1,000 patients with LMWH | $874 per VTE event avoided with LMWH | 0.3% increased risk of major bleeding event with LMWH | LMWH |
| *Francis, 1999 | THR | Net saving ($153,000) per 1,000 patients treated with LMWH | 112 VTE events avoided per 1,000 patients with LMWH | LMWH dominant | 62 more patients with bleeding event with LMWH | LMWH |
| *Botteman, 2002, enoxaparin | THR | $154,000 per 1,000 patients with LMWH | 77 DVTs avoided per 1,000 patients, 40 QALYs gained per 1,000 patients with LMWH | $2013 per DVT avoided, $40,169 per death avoided, $4349 per QALY gained with LMWH | Not reported | LMWH |
| Nerurkar, 2002, enoxaparin | TKR | Net saving ($1, 054,000) per 1,000 patients with LMWH | Seven deaths avoided per 1,000 patients with LMWH | LMWH dominant | Not reported | LMWH |
| *Caprini, 2002 | THR | $110,235 per 1,000 patients with LMWH | 5.8 VTE events avoided per 1,000 patients with LMWH | $19,006 per VTE event avoided with LMWH | Not reported | LMWH |
| Comparison of low-molecular-weight heparins and other agents | ||||||
| Reference | Patient population | Incremental cost (USD) | Incremental effects (VTE avoided or life-years or QALYS gained) | ICER (USD/VTE event avoided or life-years or QALYS gained) | Bleeding complications | Most economically attractive drug |
| Levin, 2001, desirudin versus enoxaparin | THR | $72,000 per 1,000 patients | 19.1 life-years gained per 1,000 patients with desirudin | $3,794 per life-year gained | Not reported | Desirudin |
| *Honorato, 2004, bemiparin versus enoxaparin | TKR | Net savings ($227,000) per 1,000 patients with bemiparin | 42 VTE events avoided per 1,000 patients with bemiparin | Bemiparin dominant | Not reported | Bemiparin |
| *Attanasio, 2001, dermatan sulfate versus UFH 5,000 U, 3 times daily | Surgical cancer | Net saving ($53,000) per 1,000 patients with dermatan sulfate | 70 DVTs avoided and 3.1 lives gained per 1,000 patients with dermatan sulfate | Dermatan sulfate dominant | Five additional major bleeding events with dermatan sulfate | Dermatan sulfate |
| Heerey, 2005, dalteparin 2,500 U versus dalteparin, 5,000 U | Abdominal surgery | $477,000 per 1,000 patients with dalteparin | 18 QALYs per 1,000 patients with dalteparin | $24,357/QALY gained with dalteparin | Not reported | Dalteparin 5,000 U |
| Wade, 2001, tinzaparin versus enoxaparin | Spinal cord injury | $223,259 per 1,000 patients with enoxaparin | Not reported | Not reported | Not reported | Not reported |
| Fondaparinux versus enoxaparin | ||||||
| Reference | Patient population | Incremental cost (USD) | Incremental effects (VTE avoided or life-years or QALYS gained) | ICER (USD/VTE event avoided or life-years or QALYS gained) | Bleeding complications | Most economically attractive drug |
| *Gordois, 2003 | THR, TKR, HFS | $10,000 per 1,000 patients by discharge from hospital with fondaparinux | 11 VTE events, 1.9 deaths avoided per 1,000 patients by discharge from hospital with fondaparinux | $1, 077 per VTE event avoided and $5,317 per death avoided with fondaparinux | Not reported | Fondaparinux |
| *Lundkvist, 2003 | THR, TKR, HFS | Net saving ($59,000) per 1,000 patients with fondaparinux | 17.9 VTE events, 2.6 deaths avoided per 1,000 patients (average among three conditions) with fondaparinux | Fondaparinux dominant | Not reported | Fondaparinux |
| Wade, 2003, enoxaparin, 30 mg twice daily enoxaparin, 40 mg once daily | THR | Net savings ($168,382) per 1,000 patients with enoxaparin | Three VTE events per 1,000 patients with enoxaparin | Enoxaparin dominant | 27 more bleeding episodes per 1,000 patients with fondaparinux compared with twice-daily enoxaparin Six more bleeding episodes per 1,000 patients with enoxaparin once daily compared with fondaparinux | Enoxaparin twice daily |
| Annemans, 2004 | THR, TKR, HFS | $2,800 per 1,000 patients with fondaparinux | 17.7 VTE events per 1,000 patients with fondaparinux | $158 per VTE event avoided; $104 per death avoided with fondaparinux | 1.6 more bleeding episodes per 1,000 patients with fondaparinux | Fondaparinux |
| *Dranitsaris, 2004 | THR, TKR, HFS | Net saving ($50,000) per 1,000 patients with fondaparinux | 16 VTE avoided per 1,000 patients with fondaparinux | Fondaparinux dominant | 10 more major bleeding events per 1,000 patients with fondaparinux | Fondaparinux |
| Spruill, 2004 | TKR (2002 USD) | Net saving ($43,549) per 1,000 patients with fondaparinux | 36 VTE events avoided per 1,000 patients with fondaparinux | Fondaparinux dominant | 10 more major bleeds and three more minor bleeding events per 1,000 patients with fondaparinux | Fondaparinux |
| Spruill, 2004 | THR (2002 USD) | Net saving ($18,898) per 1,000 patients with fondaparinux | 20 VTE events avoided per 1,000 patients with fondaparinux | Fondaparinux Dominant | 19 more major bleeding events per 1,000 patients with fondaparinux | Fondaparinux |
| Wade, 2004 | HFS | $21,171 per 1,000 patients with fondaparinux | 34 VTE events avoided per 1,000 patients with fondaparinux | $623 per VTE avoided, $32,144 per QALY gained with fondaparinux | Approximately 20% increased bleeding costs for fondaparinux | Fondaparinux |
| *Sullivan, 2004 | THR, TKR, HFS | Net savings ($67,000) per 1,000 patients treated with fondaparinux | 3.7 VTE events avoided per 1,000 patients with Fondaparinux | Fondaparinux dominant | Two more bleeding events per 1000 patients with Fondaparinux | Fondaparinux |
| *Szucs, 2005 | THR, TKR, HFS | Net savings ($18,153) per 1,000 patients treated with fondaparinux | 8.1 VTE events avoided per 1,000 patients with fondaparinux | Fondaparinux dominant | 1.6 more bleeding events per 1,000 patients with fondaparinux | Fondaparinux |
| *Bjorvatn, 2005 | THR, TKR, HFS | $53,553 per 1,000 patients treated with fondaparinux | 7.2 VTE events avoided per 1,000 patients with fondaparinux | $753 per VTE avoided, $6,782 per death avoided with fondaparinux | Two more bleeding events per 1,000 patients treated with fondaparinux | Fondaparinux |
| Dabigatran versus rivaroxaban and low-molecular-weight heparins | ||||||
| Wolowacz, 2009 | THR | THR Net savings ($103,050) per 1,000 patients treated with dabigatran | Two VTEs avoided, eight life-years, six QALYs gained per 1,000 patients treated with dabigatran | Dabigatran dominant | Five additional major bleeding events, two episodes HIT avoided per 1,000 patients treated with dabigatran | Dabigatran |
| TKR | Net savings ($8,162) per 1,000 patients treated with dabigatran | Four VTEs avoided, 9 life-years, 7 QALYs gained per 1,000 patients treated with dabigatran | Dabigatran dominant | Six additional major bleeding events, two episodes HIT avoided per 1,000 patients treated with dabigatran | ||
| McCullagh, 2009 | THR | Net savings ($24,104) per 1,000 patients treated with rivaroxaban | 7 Life-years, 10 QALYs gained per 1,000 patients with rivaroxaban | Rivaroxaban dominant | Not reported | Rivaroxaban |
| TKR | Net savings ($213,452) per 1,000 patients treated with rivaroxaban | 7 Life-years, 12 QALYs gained per 1,000 patients with rivaroxaban | Rivaroxaban dominant | |||
HFS, hip-fracture surgery; ICER, incremental cost-efficacy ratio; LMWH, low-molecular-weight heparin; THR, total hip replacement; UFH, unfractionated heparin; USD, United States dollars; VTE, venous thromboembolism. *Industry-sponsored study.
Unfractionated Heparin versus Low Molecular Weight Heparins
Among the 12 studies comparing low-molecular-weight heparins with unfractionated heparin among medical and surgical patients, 11 found that low-molecular-weight heparins were more effective (Table 3 and Figure 2). Eight of the 12 studies comparing low-molecular-weight heparins with unfractionated heparin found low-molecular-weight heparins to be the dominant strategy [21,23-25,27,29,30,32,33]. Two studies reported an incremental cost-efficacy ratio of $1,180 and $1,445 per venous thromboembolism event avoided when using enoxaparin [26,29], and two studies found incremental cost-effectiveness ratios of $10,360 per death avoided and $20,337 per quality-adjusted life-year gained with low-molecular-weight heparins. A single study of venous thromboembolism prevention among patients undergoing colorectal cancer surgery found no difference in efficacy, yet costs of low-molecular-weight heparins were greater [28]. Three studies reported increased bleeding risk with low-molecular-weight heparins, and three studies reported lower risk. Sensitivity analyses did not change these results. Of these 12 studies, eight received financial support from the manufacturer of the low-molecular-weight heparins [23-26,28-30,33].
Figure 2.
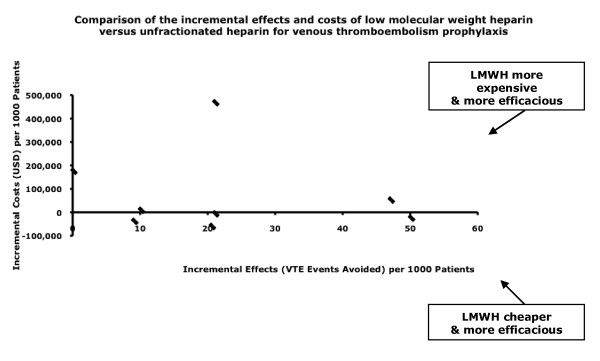
Comparison of the incremental effects and costs of low-molecular-weight heparin versus unfractionated heparin for venous thromboembolism prophylaxis.
Warfarin versus Low-Molecular-Weight Heparins
Low-molecular-weight heparins were reported to be economically more attractive than warfarin in all eight studies among surgical patients, with incremental cost-efficacy ratios of $874 to $26,711 per venous thromboembolism event avoided in five of the comparisons [34,35,37,38,40], the dominant strategy in three comparisons [36,39,41]. Long-term outcomes varied widely, with $16,200 to $334,055 per death avoided, $32,158 per life-year and $4,340 per quality-adjusted life-year gained (Table 3 and Figure 3) [34,38]. Sensitivity analyses did not change the results in individual studies. Of these eight studies, seven received pharmaceutical sponsorship [34-38,40,41].
Figure 3.
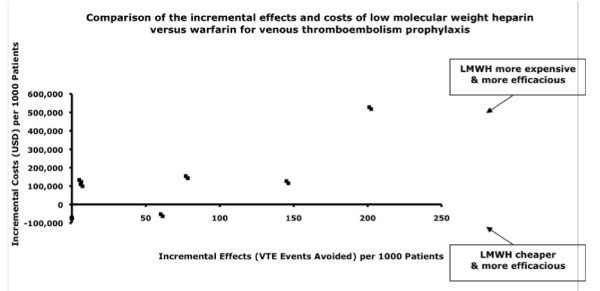
Comparison of the incremental effects and costs of low-molecular-weight heparin versus warfarin for venous thromboembolism prophylaxis.
Low-Molecular-Weight Heparins versus One another, and Other Comparisons
Within the studies comparing low-molecular-weight heparins with one another and with other anticoagulants among surgical patients, bemiparin and dermatan sulfate were the dominant prophylaxis over enoxaparin [43,44]. Desirudin had an incremental cost-effectiveness ratio of $3,794 per life-year gained, whereas enoxaparin was favored over tinzaparin but was more expensive (Table 3) [45]. Dalteparin, 5,000 units once daily, was more efficacious than dalteparin, 2,500 units, with an incremental cost-effectiveness ratio of $24,357 per quality-adjusted life-year gained [30].
Fondaparinux versus Low Molecular Weight Heparins
Among the 11 studies comparing fondaparinux with enoxaparin, all were conducted in orthopedic surgery patients, and all concluded that fondaparinux was economically attractive. In six, fondaparinux was dominant [47,51-53,55,56], and in one, enoxaparin [48] (Table 3 and Figure 4). In four studies, incremental cost-effectiveness ratios of fondaparinux over enoxaparin were $158 to $1,077 per venous thromboembolism event avoided, $104 to $6,782 per death avoided, and $32,144 per quality-adjusted life-year gained [46,49,53,54]. In eight of 11 studies, fondaparinux was associated with increased bleeding risk. Sensitivity analyses of the various costs did not alter the findings. The manufacturer of fondaparinux provided sponsorship for six of the 11 studies.
Figure 4.
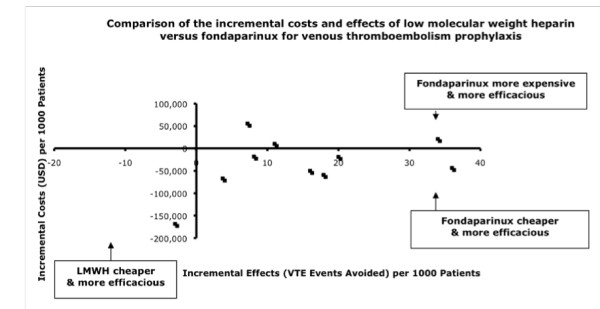
Comparison of the incremental effects and costs of low-molecular-weight heparin versus fondaparinux for venous thromboembolism prophylaxis.
Dabigatran and Rivaroxaban versus Low Molecular Weight Heparins
Among orthopedic patients, dabigatran, in comparison with enoxaparin, was dominant, with cost savings of $103,050 and $8,162 and six and seven quality-adjusted life-years gained per 1,000 patients with a total hip replacement and total knee replacement, respectively [58]. Comparing rivaroxaban, dabigatran, and enoxaparin among orthopedic surgery patients, rivaroxaban was dominant, with cost savings of $24,104 and $213,452 and 7 life-years gained per 1,000 patients with a total hip replacement and total knee replacement, respectively [57].
Sponsorship and Economic Comparisons
When comparing different populations and the different modes of venous thromboembolism prophylaxis, we observed several interesting trends. All studies comparing fondaparinux, rivaroxaban, or dabigatran with enoxaparin were performed in orthopedic patients, and the remainder of the studies in this patient population examined various low-molecular-weight heparins or warfarin. Sixteen of the 25 studies among orthopedic patients were sponsored in some manner by the pharmaceutical industry: six studies favored fondaparinux [46,47,50,54-56]; one, rivaroxaban [57]; one, dabigatran [58]; and the remainder favored low-molecular-weight heparins [25,34-38,40,41,43]. In comparison, five of the eight studies conducted in medical patients compared enoxaparin with placebo [20-24]; two compared unfractionated heparin with enoxaparin [29,33]; and the final one compared enoxaparin with tinzaparin [45]. Five of these eight studies were sponsored by pharmaceutical companies, and all studies favored enoxaparin [20,22-24]. Of the five studies in other surgical populations, three were sponsored by the pharmaceutical industry, and these studies favored unfractionated heparin [28], nadroparin [30], and dermatan sulfate [44].
Of the economic evaluations included in this review, 25 (64%) received funding by manufacturers of one of the comparators. The "new" agent within the comparison was deemed to have a favorable (dominant or attractive incremental cost-effectiveness ratio) outcome in 38 (97.4%) of the 39 economic evaluations (95% CI, 86.5% to 99.9%). Among the 25 studies funded by a pharmaceutical company, the sponsored medication was reported to be economically attractive in 24 (96.0%) (95% CI, 80.0% to 99.9%).
Discussion
In this systematic review of economic analyses of venous thromboembolism-prevention strategies in hospitalized patients, we found that all of the high-quality studies focused on pharmacologic prophylaxis. Low-molecular-weight heparins were the most commonly studied "new" class of medication and were generally reported to be the dominant or economically attractive strategy in comparison with placebo, unfractionated heparin, or warfarin, among medical and surgical patients. However, among orthopedic patients, fondaparinux was favored over low-molecular-weight heparins. The two newest agents, dabigatran and rivaroxaban, are favored in the two most recent orthopedic surgery evaluations included in this review. Among the various strategies compared, the new agent had a favorable cost-efficacy ratio in 97% of the studies, and most of these studies were sponsored by the manufacturers of the new agent.
Few systematic reviews of economic analyses comparing different modes of venous-thromboembolism prophylaxis in hospitalized patients have been conducted. In 1994, one such review of cost-efficacy analyses of low-molecular-weight heparins, unfractionated heparin, and warfarin in the prevention and treatment of venous thromboembolism in surgical patients, concluded that low-molecular-weight heparin was more efficacious and cost-effective after total hip arthroplasty [34]. Most recently, a trial comparing low-molecular-weight heparin with unfractionated heparin in hospitalized patients found low-molecular-weight heparin to be cost saving compared with unfractionated heparin and that low-molecular-weight heparin was associated with a lower venous thromboembolism readmission rate at 30 and 90 days [59]. Our review includes 37 subsequently published analyses, focusing on both medical and surgical patient populations, and comparing newer pharmacologic agents for venous thromboembolism prophylaxis, such as fondaparinux, dabigatran, and rivaroxaban.
In this review, low-molecular-weight heparins appeared to offer superior prophylaxis efficacy compared with warfarin, unfractionated heparin, and placebo for orthopedic, general surgical, and medical patients. Fondaparinux was found to be economically more attractive for venous thromboembolism prevention compared with heparins because of greater efficacy in surgical and orthopedic patients, but may also be associated with increased bleeding. Among 11 economic analyses comparing enoxaparin with fondaparinux, all found that fondaparinux was economically attractive. More than half of these studies were either directly sponsored by the manufacturers of fondaparinux, or were based on original randomized controlled trials funded by the manufacturer.
Historically, many economic evaluations of new drugs have been sponsored by the drug manufacturer. However, this introduces the potential for bias in model construction and interpretation of the results. In a retrospective analysis of 107 trials in five leading medical journals with regard to outcome and sources of funding, studies sponsored by pharmaceutical companies were much less likely to favor traditional therapy over new drug treatment [60,61]. It is not surprising that new agents are incrementally efficacious; this is the nature of progress in medicine. However, new agents, typically still under patent protection, are virtually always substantially more expensive than comparator drugs. In our systematic review, 25 of the 39 studies were funded by pharmaceutical companies, and, with the exception of a single study [28], each of these found the sponsored drug more economically attractive than the comparator drug. Such consistency in incremental cost-effectiveness among more-expensive drugs is striking. Importantly, we could not detect a consistent bias in outcome between sponsored and nonsponsored evaluations; however, only a minority of evaluations did not receive sponsorship.
Strengths of our review include adherence to rigorous systematic review methods, which consisted of a comprehensive search strategy, broad eligibility criteria, and study selection by two independent adjudicators using a priori criteria to minimize selection bias. Economic analyses are susceptible to investigator bias, often due to retrospective decision-model generation and retrospective acquisition of cost-and-effect data. To reduce this risk, we included only economic evaluations that incorporated outcome data from prospective randomized controlled trials. We conducted data abstraction and critical appraisal in duplicate, by using established criteria for assessing economic evaluations. We also addressed the relation of recency to market and for-profit sponsorship in influencing the reporting of economic evaluations. This review also has limitations. Many of the analyses within studies that we included come from a limited number of trials and cost-comparison models. For example, five studies used outcome data from the MEDENOX trial [20,22-24,33]. If most of the data are derived from a limited number of efficacy trials and cost models, similar results are likely to be found across economic evaluations. Although the studies included in this review received high ratings of internal validity, studies varied widely with respect to patient population, time-horizon of therapy, and payer perspective, making generalizability to other health care difficult. In addition, many evaluations rely on radiologic as opposed to clinical venous thromboembolism detection, which may overestimate the real-life clinical consequences of venous thromboembolism. Side effects of thromboprophylaxis may be underestimated, as randomized controlled trials often exclude patients at higher risk of bleeding. Furthermore, trials are generally underpowered to detect differences in rare drug-specific complications such as heparin-induced thrombocytopenia. This may lead to an overestimation of cost-efficacy, as reported in the economic evaluations in this review. Finally, our review included a predominance of orthopedic, general surgery, and medical patients, and thus, our findings may not generalizable to other patient populations.
Among economic analyses in this review, incremental cost-effectiveness ratios were commonly expressed in costs per venous thromboembolism events avoided, and they ranged from $500 to $8,000 per venous thromboembolism event avoided. These ranges are difficult to interpret, as no firmly established willingness-to-pay benchmarks exist for venous thromboembolism prevention. Costs per life-year or quality-adjusted life-year gained were less commonly reported, making economic comparisons of venous thromboembolism-prevention strategies and other interventions in healthcare similarly challenging. Comparing and combining ICERs performed with country-specific costs is challenging, as patient, disease, provider, and health-care system factors may influence transferability. We have not adjusted costs based on country-specific purchasing power parity but have adjusted based on changes in gross domestic product over time, and country-specific exchange rates [62].
An informative economic analysis should include both benefits and harms of interventions and the full associated costs over a relevant time horizon. Full costs of venous thromboembolism prophylaxis were not included in some studies. The common complications of venous thromboembolism prophylaxis include prophylaxis failure, leading to thrombotic events, bleeding, and heparin-induced thrombocytopenia [1]. All 39 studies evaluated in this systematic review accounted for breakthrough thrombotic events; however, only half included bleeding complications (Table 3), and none fully accounted for heparin-induced thrombocytopenia. The omission of these potentially serious complications may considerably affect the cost-comparison data of the individual studies. Most studies ascertained costs retrospectively and from the literature. This is often less complete or less accurate compared with prospective determination alongside a randomized controlled trial. Finally, none of the studies included in this review was prospectively designed before results of the randomized controlled trials were published; accordingly, they may be at risk for subjective decision-tree construction and interpretation.
Few studies have evaluated the cost-effectiveness of mechanical venous thromboembolism-prevention strategies, and none of the existing studies met our eligibility criteria. The UK National Institute for Health and Clinical Excellence have recommended considering graduated compression stockings in most patients, although economic evaluations of mechanical venous thromboembolism prophylaxis have generally been of low quality [63]. The paucity of rigorous evidence about the cost effectiveness of mechanical prophylaxis is striking. However, this may be explained by the fact that manufacturers of mechanical devices are often not required to furnish either effectiveness or cost data to regulatory bodies before their introduction and marketing.
Conclusion
In this systematic review of economic analyses of venous thromboembolism-prevention strategies in hospitalized patients, we found that low-molecular-weight heparins appear to be the most economically attractive strategy for venous thromboembolism prevention among the majority of medical and surgical patients, whereas fondaparinux is more economically attractive for orthopedic patients. The studies, however, may be at risk of overestimating efficacy and underestimating side effects such as bleeding. Approximately two thirds of all evaluations were directly funded by the manufacturer of the new drug, and such drugs were more likely to be found economically attractive in comparison to other strategies. Limited opportunity for peer-reviewed and independent funding for economic evaluations unfortunately leads to reliance on industry sponsorship in this field. In the future, we recommend that high-quality, prospective, cost-effectiveness analysis be planned alongside the intervention trials and that these be designed, conducted, analyzed, and reported independent of industry sponsors.
Key messages
• Low-molecular-weight heparins appear to be the most economically attractive strategy for venous thromboembolism prevention among the majority of medical and surgical patients, whereas fondaparinux is more economically attractive for orthopedic patients.
• However, approximately two thirds of all evaluations were directly funded by the manufacturer of the new drug.
• Such drugs were more likely to be found economically attractive in comparison to other strategies.
• Limited opportunity for peer-reviewed and independent funding for economic evaluations may lead to reliance on industry sponsorship and bias in this field.
Abbreviations
ACP: American College of Physicians; CI: confidence interval; CIHI: Canadian Institute for Health Information; DARE: Database of Abstracts of Reviews of Effects; DRG: diagnosis-related group; HFS: hip-fracture surgery; ICER: incremental cost-efficacy ratio; LMWH: low-molecular-weight heparin; MEDENOX: prophylaxis in medical patients with enoxaparin trial; NICE: National Centre for Clinical Excellence; N/R: not reported; OHIP: Ontario Health Insurance Plan; RCT: randomized controlled trial; THR: total hip replacement; TKR: total knee replacement; UFH: unfractionated heparin; USD: United States dollars; VTE: venous thromboembolism.
Competing interests
Drs. Pinto and Thirugnanam have no conflicts to disclose. Dr. Fowler's department has received funding for contract research, over the past 5 years from Eli Lilly, Wyeth, Novartis, and Fugisawa. Drs. Cook, Fowler, and Geerts are the primary investigator and collaborators, respectively, on PROTECT (a randomized clinical trial of low-molecular-weight heparin versus unfractionated heparin for thromboprophylaxis in critically ill patients) and DIRECT (a multicenter observational study of low-molecular-weight heparin thromboprophylaxis in critically ill patients with renal impairment). Both are investigator initiated and peer funded, but DIRECT received additional funding from Pfizer, the producers of dalteparin. PROTECT and DIRECT received donations of funding-in-kind for study drug from Pfizer, the makers of dalteparin. The design, conduct, oversight, analysis, interpretation, and write-up of DIRECT was without any influence from Pfizer. PROTECT is ongoing (in the conduct phase); the same conditions hold. Dr. Geerts, over the past 5-year period, has had the following financial relationships that, in a general way, relate to the subject matter discussed in the article or presentation (research grants/support received: Sanofi-Aventis, Pfizer; Bayer Healthcare (pending); consultancies: Astra Zeneca, Bayer Healthcare, Boehringer Ingelheim, Bristol-Myers Squibb, Covidien, Eli Lilly, GlaxoSmithKline, Leo, Pharma, Merck KGaA, Pfizer, Roche, and Sanofi Aventis; honoraria: Astra Zeneca, Calea, Eisai, Oryx Pharma, Pfizer, and Sanofi-Aventis).
Authors' contributions
Drs. F, T, P, C, and G have made substantial contributions to conception and design, acquisition of data, analysis, and interpretation of data. They drafted the submitted article and revised it critically for important intellectual content. They provided final approval of the version to be published.
Authors' information
Dr. Fowler is a Career Scientist of the Ontario Ministry of Health and Long-term Care and an incoming Clinician Scientist of Heart and Stroke Foundation of Canada. Dr. Cook holds a Canada Research Chair from the Canadian Institutes of Health Research.
Supplementary Material
Search Strategies and Results.
Contributor Information
Subarna Thirugnanam, Email: subarna.thirugnanam@utoronto.ca.
Ruxandra Pinto, Email: Ruxandra.Pinto@sunnybrook.ca.
Deborah J Cook, Email: debcook@mcmaster.ca.
William H Geerts, Email: William.geerts@sunnybrook.ca.
Robert A Fowler, Email: rob.fowler@sunnybrook.ca.
Acknowledgements
We thank Michael Gould, Gordon Guyatt, Nicole Mittmann, Brian Chan, Peter Dodek, Peter Dodek, and the E-PROTECT collaborators, the Canadian Critical Care Trials Group, Heart and Stroke Canada, the University of Toronto Connaught New Staff Matching Fund, Canadian Intensive Care Foundation, and the Ontario Ministry of Health and Long-term Care Career Scientist Program.
References
- Geerts W, Pineo G, Heit J, Bergqvist D, Lassen MR, Colwell CW, Ray JG. Prevention of Venous Thromboembolism: The Seventh ACCP conference on Antithrombotic and Thrombolytic Therapy. Chest. 2004;16:338S–400S. doi: 10.1378/chest.126.3_suppl.338S. [DOI] [PubMed] [Google Scholar]
- Cook D, Crowther M, Meade M, Douketis J. Prevalence, incidence, and risk factors for venous thromboembolism in medical-surgical intensive care unit patients. J Crit Care. 2005;16:309–313. doi: 10.1016/j.jcrc.2005.09.005. [DOI] [PubMed] [Google Scholar]
- Kakkar V, Flanc C, Howe C. Natural history of postoperative deep vein thrombosis. Lancet. 1969;16:230–234. doi: 10.1016/s0140-6736(69)90002-6. [DOI] [PubMed] [Google Scholar]
- Barritt D, Jordan S. Anticoagulant drugs in the treatment of pulmonary embolism: a controlled trial. Lancet. 1960;16:1309–1312. doi: 10.1016/s0140-6736(60)92299-6. [DOI] [PubMed] [Google Scholar]
- Lindblad B, Eriksson A, Bergqvist D. Autopsy-verified pulmonary embolism in surgical department: analysis of the period from 1951 to 1988. Br J Surg. 1991;16:849–852. doi: 10.1002/bjs.1800780725. [DOI] [PubMed] [Google Scholar]
- Patel R, Cook DJ, Meade MO, Griffith LE, Mehta G, Rocker GM, Marshall JC, Hodder R, Martin CM, Heyland DK, Peters S, Muscedere J, Soth M, Campbell N, Guyatt GH. for the Burden of Illness in Venous Thrombo Embolism in Critical Care (BITEC) Study Investigators; Canadian Critical Care Trials Group. Burden of illness in venous thromboembolism in critical care: a multicenter observational study. J Crit Care. 2005;16:341–347. doi: 10.1016/j.jcrc.2005.09.014. [DOI] [PubMed] [Google Scholar]
- Shojania KG, Duncan BW, McDonald KM, Wachter RM, Markowitz AJ, Evidence Report/Technology Assessment Number 43. Making health care safer: a critical analysis of patient safety practices: summary. http://www.ahrq.gov/clinic/ptsafety/summary.htm [PMC free article] [PubMed]
- Olin G, Machlin R, Agency for Healthcare Research and Quality; Center for Cost and Financing Studies. Health care expenses in the US civilian population. http://www.meps.ahrq.gov/papers/rf_01-r035/statisticaltables.htm
- O'Brien BJ, Heyland D, Richardson WS, Levine M, Drummond MF. User's guide to the medical literature: XIII, How to use an article on economic analysis of clinical practice: B, What are the results and will they help me in caring for my patients? JAMA. 1997;16:1802–1814. doi: 10.1001/jama.1997.03540460066034. [DOI] [PubMed] [Google Scholar]
- Chau Q, Cantor S, Caramel E. Cost-effectiveness of the bird's nest filter for preventing pulmonary embolism among patients with malignant brain tumors and deep venous thrombosis of the lower extremities. Support Care Cancer. 2003;16:795–799. doi: 10.1007/s00520-003-0520-2. [DOI] [PubMed] [Google Scholar]
- Epstein N. Intermittent pneumatic compression stocking prophylaxis against deep venous thrombosis in anterior cervical spinal surgery: a prospective efficacy study in 200 patients and literature review. Spine. 2005;16:2538–2543. doi: 10.1097/01.brs.0000186318.80139.40. [DOI] [PubMed] [Google Scholar]
- Ramos R, Salem BI, De Pawlikowski MP, Coordes C, Eisenberg S, Leidenfrost R. The efficacy of pneumatic compression stockings in the prevention of pulmonary embolism after cardiac surgery. Chest. 1996;16:82–85. doi: 10.1378/chest.109.1.82. [DOI] [PubMed] [Google Scholar]
- Sing R, Smith C, Miles W, Messick WJ. Preliminary results of bedside inferior vena cava filter placement: safe and cost-effective. Chest. 1998;16:315–316. doi: 10.1378/chest.114.1.315. [DOI] [PubMed] [Google Scholar]
- Warwick D, Harrison J, Glew D, Mitchelmore A, Peters TJ, Donovan J. Comparison of the use of a foot pump with the use of low-molecular-weight heparin for the prevention of deep-vein thrombosis after total hip replacement: a prospective, randomized trial. J Bone Joint Surg. 1998. pp. 1158–1166. [DOI] [PubMed]
- Williams J, Palfrey S. Cost effectiveness and efficacy of below knee against above knee graduated compression stockings in the prevention of deep vein thrombosis. Phlebologie. 1988;16:809–811. [PubMed] [Google Scholar]
- Woolson S. Intermittent pneumatic compression prophylaxis for proximal deep venous thrombosis after total hip replacement. J Bone Joint Surg. 1996;16:1735–1740. doi: 10.2106/00004623-199611000-00015. [DOI] [PubMed] [Google Scholar]
- Chiasson TC, Manns BJ, Stelfox HT. An economic evaluation of venous thromboembolism prophylaxis strategies in critically ill trauma patients at risk of bleeding. PLoS Med. 2009;16:e1000098. doi: 10.1371/journal.pmed.1000098. [DOI] [PMC free article] [PubMed] [Google Scholar]
- Gross domestic product deflator inflation calculator. http://cost.jsc.nasa.gov/inflateGDP.html
- Universal currency converter. http://www.xe.com/ucc/
- Pechevis M, Detournay B, Pribil C, Fagnani F, Chalanson G. Economic evaluation of enoxaparin versus placebo for the prevention of venous thromboembolism in acutely ill medical patients. Value Health. 2000;16:389–396. doi: 10.1046/j.1524-4733.2000.36008.x. [DOI] [PubMed] [Google Scholar]
- Lloyd AC, Anderson PM, Quinlan DJ, Bearne A. Economic evaluation of the use of enoxaparin for thromboprophylaxis in acutely ill medical patients. J Med Econ. 2001;16:99–113. doi: 10.3111/200104099113. [DOI] [Google Scholar]
- Lamy A, Wang X, Kent R, Smith KM, Gafni A. Economic evaluation of the MEDENOX trial: a Canadian perspective: medical patients with enoxaparin. Can Respir J. 2002;16:169–177. doi: 10.1155/2002/310841. [DOI] [PubMed] [Google Scholar]
- Offord R, Lloyd A, Anderson P, Bearne A. Economic evaluation of enoxaparin for the prevention of venous thrombosis in acutely ill medical patients. Pharm World Sci. 2004;16:214–220. doi: 10.1023/b:phar.0000035887.23072.e5. [DOI] [PubMed] [Google Scholar]
- Schadlich P, Kentsch M, Weber M. Cost effectiveness of enoxaparin as prophylaxis against venous thromboembolic complications in acutely ill medical inpatients: modeling study from the hospital perspective in Germany. Pharmacoeconomics. 2006;16:571–591. doi: 10.2165/00019053-200624060-00005. [DOI] [PubMed] [Google Scholar]
- Drummond M, Aristides M, Davies L, Forbes C. Economic evaluation of standard heparin and enoxaparin for prophylaxis against deep vein thrombosis in elective hip surgery. Br J Surg. 1994;16:1742–1746. doi: 10.1002/bjs.1800811212. [DOI] [PubMed] [Google Scholar]
- Hawkins D, Langley C, Krueger K. Pharmacoeconomic model of enoxaparin versus heparin for prevention of deep vein thrombosis after total hip replacement. Am J Health Syst Pharm. 1997;16:1185–1190. doi: 10.1093/ajhp/54.10.1185. [DOI] [PubMed] [Google Scholar]
- Marchetti M, Liberato N, Ruperto N, Barosi G. Long-term cost-effectiveness of low molecular weight heparin versus unfractionated heparin for the prophylaxis of venous thromboembolism in elective hip replacement. Haematologica. 1999;16:730–737. [PubMed] [Google Scholar]
- Etchells E, McLeod R, Geerts W, Barton P, Detsky AS. Economic analysis of low-dose heparin vs the low-molecular-weight heparin enoxaparin for prevention of venous thromboembolism after colorectal surgery. Arch Intern Med. 1999;16:1221–1228. doi: 10.1001/archinte.159.11.1221. [DOI] [PubMed] [Google Scholar]
- McGarry L, Thompson D, Weinstein M, Goldhaber SZ. Cost effectiveness of thromboprophylaxis with a low-molecular-weight heparin versus unfractionated heparin in acutely ill medical inpatients. Am J Manag Care. 2004;16:632–642. [PubMed] [Google Scholar]
- Lloyd A, Aitken JA, Hoffmeyer UK, Kelso EJ, Wakerly EC, Barber ND. Economic evaluation of the use of nadroparin calcium in the prophylaxis of deep vein thrombosis and pulmonary embolism in surgical patients in Italy. Pharmacoeconomics. 1997;16:475–485. doi: 10.2165/00019053-199712040-00005. [DOI] [PubMed] [Google Scholar]
- Heerey A, Suri S. Cost effectiveness of dalteparin for preventing venous thromboembolism in abdominal surgery. Pharmacoeconomics. 2005;16:927–944. doi: 10.2165/00019053-200523090-00005. [DOI] [PubMed] [Google Scholar]
- Wade WE, Spruill WJ. Cost-effectiveness of dalteparin versus unfractionated heparin as venous thromboembolism prophylaxis in malignant gynecologic surgery. Am J Ther. 2008;16:512–515. doi: 10.1097/MJT.0b013e3181727aa0. [DOI] [PubMed] [Google Scholar]
- Deitelzweig SB, Becker R, Lin J, Benner J. Comparison of the two-year outcomes and costs of prophylaxis in medical patients at risk of venous thromboembolism. Thromb Haemost. 2008;16:810–820. [PubMed] [Google Scholar]
- O'Brien B, Anderson D, Goeree R. Cost-effectiveness of enoxaparin versus warfarin prophylaxis against deep-vein thrombosis after total hip replacement. CMAJ. 1994;16:1083–1090. [PMC free article] [PubMed] [Google Scholar]
- Menzin J, Colditz GA, Regan MM, Richner RE, Oster G. Cost-effectiveness of enoxaparin vs low-dose warfarin in the prevention of deep-vein thrombosis after total hip replacement surgery. Arch Intern Med. 1995;16:757–764. doi: 10.1001/archinte.1995.00430070117013. [DOI] [PubMed] [Google Scholar]
- Hull R, Raskob G, Pineo G. Subcutaneous low-molecular-weight heparin vs warfarin for prophylaxis of deep vein thrombosis after hip or knee implantation: an economic perspective. Arch Intern Med. 1997;16:298–303. doi: 10.1001/archinte.1997.00440240060009. [DOI] [PubMed] [Google Scholar]
- Hawkins D, Langley P, Krueger K. A pharmacoeconomic assessment of enoxaparin and warfarin as prophylaxis for deep vein thrombosis in patients undergoing knee replacement surgery. Clin Ther. 1998;16:182–195. doi: 10.1016/S0149-2918(98)80045-3. [DOI] [PubMed] [Google Scholar]
- Botteman M, Caprini J, Stephens J. Results of an economic model to assess the cost-effectiveness of enoxaparin, a low-molecular-weight heparin, versus warfarin for the prophylaxis of deep vein thrombosis and associated long-term complications in total hip replacement surgery in the United States. Clin Ther. 2002;16:1960–1986. doi: 10.1016/S0149-2918(02)80091-1. [DOI] [PubMed] [Google Scholar]
- Nerurkar J, Wade W, Martin B. Cost/Death averted with venous thromboembolism prophylaxis in patients undergoing total knee replacement or arthroplasty. Pharmacotherapy. 2002;16:990–1000. doi: 10.1592/phco.22.12.990.33609. [DOI] [PubMed] [Google Scholar]
- Francis CW, Pleil AM, Reinhart SP. A pharmacoeconomic evaluation of low-molecular-weight heparin in patients after total hip-replacement surgery. P and T. 1999;16:136–145. [Google Scholar]
- Caprini JA, Arcelus JI, Kudrna JC, Sehgal LR, Oyslender M, Maksimovic D, MacDougall A. Cost-effectiveness of venous thromboembolism prophylaxis after total hip replacement. Phlebology. 2002;16:126–133. doi: 10.1007/BF02638605. [DOI] [Google Scholar]
- Levin L, Bergqvist D. Cost effectiveness of desirudin compared with a low molecular weight heparin in the prevention of deep vein thrombosis after total hip replacement surgery. Pharmacoeconomics. 2001;16:589–597. doi: 10.2165/00019053-200119050-00012. [DOI] [PubMed] [Google Scholar]
- Honorato J, Gómez-Outes A, Navarro-Quilis A, Martínez-González J, Rocha E, Planès A. Pharmacoeconomic analysis of bemiparin and enoxaparin as prophylaxis for venous thromboembolism in total knee replacement surgery. Pharmacoeconomics. 2004;16:885–894. doi: 10.2165/00019053-200422130-00006. [DOI] [PubMed] [Google Scholar]
- Attanasio E, Russo P, Carunchio G, Caprino L. Dermatan sulfate versus unfractionated heparin for the prevention of venous thromboembolism in patients undergoing surgery for cancer: a cost-effectiveness analysis. Pharmacoeconomics. 2001;16:57–68. doi: 10.2165/00019053-200119010-00004. [DOI] [PubMed] [Google Scholar]
- Wade W, Spruill W. Cost comparison of tinzaparin versus enoxaparin as deep venous thrombosis prophylaxis in spinal cord injury: preliminary data. Blood Coagul Fibrinol. 2001;16:619–625. doi: 10.1097/00001721-200112000-00002. [DOI] [PubMed] [Google Scholar]
- Gordois A, Posnett J, Borris L. The cost-effectiveness of fondaparinux compared with enoxaparin as prophylaxis against thromboembolism following major orthopedic surgery. J Thromb Haemost. 2003;16:2167–2174. doi: 10.1046/j.1538-7836.2003.00396.x. [DOI] [PubMed] [Google Scholar]
- Lundkvist J, Bergqvist D, Jonsson B. Cost-effectiveness of fondaparinux versus enoxaparin as venous thromboembolism prophylaxis in Sweden. Eur J Health Econ. 2003;16:254–262. doi: 10.1007/s10198-003-0175-4. [DOI] [PubMed] [Google Scholar]
- Wade E, Spruill W, Leslie R. Cost analysis: fondaparinux versus preoperative and postoperative enoxaparin as venous thromboembolic event prophylaxis in elective hip arthroplasty. Am J Orthop. 2003;16:201–206. [PubMed] [Google Scholar]
- Annemans L, Minjoulat-Rey M, De Knock M. Cost consequence analysis of fondaparinux versus enoxaparin in the prevention of venous thromboembolism after major orthopedic surgery in Belgium. Acta Clin Belg. 2004;16:346–357. doi: 10.1179/acb.2004.050. [DOI] [PubMed] [Google Scholar]
- Dranitsaris G, Kahn S, Stumpo C. Pharmacoeconomic analysis of fondaparinux versus enoxaparin for the prevention of thromboembolic events in orthopedic surgery patients. Am J Cardiovasc Drugs. 2004;16:325–333. doi: 10.2165/00129784-200404050-00005. [DOI] [PubMed] [Google Scholar]
- Spruill W, Wade W, Leslie R. A cost analysis of fondaparinux versus enoxaparin in total knee arthroplasty. Am J Ther. 2004;16:3–8. doi: 10.1097/00045391-200401000-00004. [DOI] [PubMed] [Google Scholar]
- Spruill W, Wade W, Leslie R. Cost analysis of fondaparinux versus enoxaparin as venous thromboembolism prophylaxis in elective hip replacement surgery. Blood Coagul Fibrinol. 2004;16:539–543. doi: 10.1097/00001721-200410000-00002. [DOI] [PubMed] [Google Scholar]
- Wade W, Spruill W, Leslie R. Cost analysis of fondaparinux versus enoxaparin as venous thromboembolism prophylaxis in hip fracture surgery. Am J Ther. 2004;16:194–198. doi: 10.1097/00045391-200405000-00007. [DOI] [PubMed] [Google Scholar]
- Bjorvatn A, Kristiansen F. Fondaparinux sodium compared with enoxaparin sodium: a cost-effectiveness analysis. Am J Cardiovasc Drugs. 2005;16:121–130. doi: 10.2165/00129784-200505020-00006. [DOI] [PubMed] [Google Scholar]
- Sullivan SD, Davidson BL, Kahn SR, Muntz JE, Oster G, Raskob G. A cost-effectiveness analysis of fondaparinux sodium compared with enoxaparin sodium as prophylaxis against venous thromboembolism: use in patients undergoing major orthopaedic surgery. Pharmacoeconomics. 2004;16:605–620. doi: 10.2165/00019053-200422090-00005. [DOI] [PubMed] [Google Scholar]
- Szucs TD, Kaiser WE, Mahler F, Gutzwiller F. Thromboembolic prophylaxis with fondaparinux in major orthopaedic surgery: outcomes and costs. Heart Drug. 2005;16:121–130. doi: 10.1159/000085885. [DOI] [Google Scholar]
- McCullagh L, Tilson L, Walsh C, Barry M. A cost-effectiveness model comparing rivaroxaban and dabigatran etexilate with enoxaparin sodium as thromboprophylaxis after total hip and total knee replacement in the Irish healthcare setting. Pharmacoeconomics. 2009;16:829–846. doi: 10.2165/11313800-000000000-00000. [DOI] [PubMed] [Google Scholar]
- Wolowacz SE, Roskell NS, Maciver F, Beard SM, Robinson PA, Plumb JM, Dolan G, Brenkel IJ. Economic evaluation of dabigatran etexilate for the prevention of venous thromboembolism after total knee and hip replacement surgery. Clin Ther. 2009;16:194–212. doi: 10.1016/j.clinthera.2009.01.001. [DOI] [PubMed] [Google Scholar]
- Merli G, Ferrufiono C, Lin M, Hussein M, Battleman D. Hospital-based costs associated with venous thromboembolism treatment regimens. J Thromb Haemost. 1996;16:1077–1086. doi: 10.1111/j.1538-7836.2008.02997.x. [DOI] [PubMed] [Google Scholar]
- Kelly R, Cohen L, Semple R. Relationship between drug company funding and outcomes of clinical psychiatric research. Psychol Med. 2006;16:1647–1657. doi: 10.1017/S0033291706008567. [DOI] [PubMed] [Google Scholar]
- Yaphe J, Edman R, Knishkowy B, Herman J. The association between funding by commercial interests and study outcome in randomized controlled drug trials. Family Prac. 2001;16:565–568. doi: 10.1093/fampra/18.6.565. [DOI] [PubMed] [Google Scholar]
- Goeree R, Burke N, O'Reilly D, Manca A, Blackhouse G, Tarride JE. Transferability of economic evaluations: approaches and factors to consider when using results from one geographic area for another. Curr Med Res Opin. 2007;16:671–682. doi: 10.1185/030079906X167327. [DOI] [PubMed] [Google Scholar]
- Robb P, Freer J, Seddon J, Young J, for the National Institute for Health and Clinical Excellence. Venous thromboembolism prophylaxis guidelines, April 2007. http://www.nice.org.uk/
Associated Data
This section collects any data citations, data availability statements, or supplementary materials included in this article.
Supplementary Materials
Search Strategies and Results.