

Abstract
Genome‐wide association studies have identified numerous loci linked to breast cancer susceptibility, but the mechanism by which variations at these loci influence susceptibility is usually unknown. Some variants are only associated with particular clinical subtypes of breast cancer. Understanding how and why these variants influence subtype‐specific cancer risk contributes to our understanding of cancer etiology. We conducted a genome‐wide expression Quantitative Trait Locus (eQTL) study in a discovery set of 287 breast tumors and 97 normal mammary tissue samples and a replication set of 235 breast tumors. We found that the risk‐associated allele of rs7716600 in the 5p12 estrogen receptor‐positive (ER‐positive) susceptibility locus was associated with elevated expression of the nearby gene MRPS30 exclusively in ER‐positive tumors. We replicated this finding in 235 independent tumors. Further, we showed the rs7716600 risk genotype was associated with decreased MRPS30 promoter methylation exclusively in ER‐positive breast tumors. In vitro studies in MCF‐7 cells carrying the protective genotype showed that estrogen stimulation decreased MRPS30 promoter chromatin availability and mRNA levels. In contrast, in 600MPE cells carrying the risk genotype, estrogen increased MRPS30 expression and did not affect promoter availability. Our data suggest the 5p12 risk allele affects MRPS30 expression in estrogen‐responsive tumor cells after tumor initiation by a mechanism affecting chromatin availability. These studies emphasize that the genetic architecture of breast cancer is context‐specific, and integrated analysis of gene expression and chromatin remodeling in normal and tumor tissues will be required to explain the mechanisms of risk alleles.
Keywords: Breast cancer, Genetics, Expression Quantitative Trait Locus, Estrogen, chromatin
Abbreviations
- eQTL
expression Quantitative Trait Locus
- FAIRE
Formaldehyde-Assisted Isolation of Regulatory Elements
- ChIP-PCR
Chromatin Immunoprecipitation-Polymerase Chain Reaction
- ER
Estrogen Receptor
- GWAS
Genome-wide Association Study
- SNP
Single Nucleotide Polymorphism
- ATP
Adenosine Triphosphate
1. Introduction
Germline variants at hundreds of loci in the human genome are associated with modest increases in heritable cancer susceptibility. Breast cancer susceptibility has been the subject of intense scrutiny by GWAS (Hunter et al., 2007; Michailidou et al., 2013). Breast tumors can be divided into several subtypes at the molecular level which may have fundamentally distinct etiologies (Curtis et al., 2012; Polyak, 2007; Sorlie et al., 2001). The most fundamental subtype distinction is whether the tumor responds to mitogenic signals from the Estrogen Receptor (ER). Some of the variants associated with breast cancer susceptibility are associated only with ER‐positive or ER‐negative disease (Garcia‐Closas et al., 2013; Hunter et al., 2007; Michailidou et al., 2013), indicating that their heritable influence on cancer susceptibility is context‐dependent. These subtype‐specific loci may predispose normal breast tissue to develop ER‐positive cancer, or they may preferentially affect the progression of ER‐positive but not ER‐negative cancer. Susceptibility alleles may act either by direct cell‐autonomous effects on growth of the epithelial target cells, or through indirect effects on the tumor microenvironment, suggesting that analysis of both normal tissue and tumor tissue may inform mechanistic understanding of the genetic basis of heritable susceptibility.
Although some susceptibility loci are in linkage with one or more genes, association studies cannot identify the causal variations or explain their mechanism. To generate mechanistic hypotheses, germline variants can be associated with constitutive gene expression levels to identify expression Quantitative Trait Loci (eQTL). These eQTL act in a tissue‐specific and context‐specific manner, reflecting changes to the genetic architecture as cells differentiate or transform into malignant tumors (Brem et al., 2002; Dimas et al., 2009; Emilsson et al., 2008; Li et al., 2013; Morley et al., 2004; Nica et al., 2011; Quigley et al., 2009; Quigley and Balmain, 2009; Quigley et al., 2011). When a variant is linked to both tumor susceptibility and expression of a nearby gene, this suggests that the mechanism of the susceptibility variant may involve transcriptional control of that gene. We searched for loci linked to gene expression in normal breast tissue and in breast adenocarcinomas. Here we show that rs7716600, a Single Nucleotide Polymorphism (SNP) located at chromosome 5p12 and specifically linked to ER‐positive breast tumor susceptibility in several GWAS (Kim et al., 2012; Li et al., 2011; Milne et al., 2011; Ruiz‐Narvaez et al., 2010; Stacey et al., 2008), was significantly associated with MRPS30 gene expression in ER‐positive tumors in two independent datasets. We also provide in vivo and in vitro data suggesting a mechanism for how this locus influences expression of MRPS30.
2. Materials and methods
2.1. Genetic and genomic data
Three previously published breast adenocarcinoma gene expression datasets (MicMa: GSE19783, DBCG82bc: GSE24117, MDG: GSE18672) were combined for the discovery tumor dataset. MicMa data (Agilent Whole Genome 44k) and DBCG82bc (ABI Genome Survey) were separately background‐corrected and quantile normalized. MDG (an Agilent two‐color array) was normalized within arrays. Probes were collapsed to 8147 genes by entrez identifier using the mean of probes annotated as measuring the same gene with Pearson correlation > 0.8; where no pair of probes met this cut‐off, the mean value of all probes assigned to a gene was used. All microarray normalization was performed using the limma package (Gentleman, 2005) in the R statistical environment version 2.14 (R Development Core Team, 2012). Discovery expression data were mean‐centered and standardized within datasets. Two cohorts were combined for the normal dataset (MDG: GSE18672, Ahus: GSE48067). The normal datasets share probe identities and were standardized and batch‐corrected using ComBat (Johnson et al., 2007). The normal breast dataset consisted of 16,651 genes. The validation dataset (Illumina Human Genome microarray) was published in (Curtis et al., 2012). DNA methylation status was assessed with the Illumina HumanMethylation450 microarray, testing probe cg04713108_MRPS30. Discovery genotypes were measured using the Illumina Human 660k platform and CRLMM (Ritchie et al., 2009), rejecting any array with >10% missing calls. Individual SNPs with >10% missing calls or a Minor Allele Frequency <5% were discarded. Genotype imputation was performed with IMPUTE (Howie et al., 2009) and HapMap3 R2 B36 reference genotypes. Linkage scores were calculated with PLINK (Purcell et al., 2007), and linkage heat maps were plotted with the LDheatmap library (Ji‐Hyung Shin et al., 2006). The study was approved by REC SouthEast (Regional Ethical Committee for Medical and Health Research Ethics) and by the Ethical Committee for Aarhus county and by “Datatilsynet” (The Data Inspectorate, an independent administrative body under the Ministry of Government Administration and Reform). All patients have given consent to the use of material for research purposes in adherence with the Declaration of Helsinki Principles.
2.2. Statistical analysis
Association between genotypes and gene expression was assessed by linear regression. For each gene we identified the SNP most significantly associated with that gene's expression in a 1 Mb window around the transcription start site and reported this as the raw P value. eQTL significance was assessed by permuting the genotype assignments for SNPs in the cis‐window 10,000 times and identifying the rank of the observed statistic in the permuted statistics. This process indicated a 5% False Discovery Rate would be obtained by a permutation P value cut‐off of P ≤ 0.0002 in the normal dataset and P ≤ 0.001 in the tumor dataset. Spearman rank correlation significance was assessed with a permutation method which established a 5% Genome‐wide error rate as in (Churchill and Doerge, 1994). Gene Ontology enrichment analysis was calculated with BiNGO (Maere et al., 2005).
2.3. Cell culture
MCF‐7 cells were plated and grown for 24 h in DMEM containing phenol red and supplemented with 10% serum, 2 mM l‐glutamine, 50 U/ml penicillin and 50 μg/ml streptomycin (all from Life Technologies GmbH). For hormone deprivation experiments, cells were grown for three days in DMEM without phenol red (Life Technologies GmbH) and supplemented with 5% charcoal stripped heat‐inactivated FBS (HyClone), 2 mM l‐glutamine, 50 U/ml penicillin and 50 μg/ml streptomycin. At day three, cells were stimulated with vehicle (ethanol) or 10 nM estradiol (Sigma–Aldrich) for 12 h.
2.4. Formaldehyde‐assisted isolation of regulatory elements (FAIRE)
For FAIRE experiments, we followed the protocol described in (Giresi and Lieb, 2009) with minor modifications. Nucleosome‐free DNA was detected by Real‐time PCR.
2.5. Chromatin immunoprecipitation (ChIP)
After estrogen stimulation cells were crosslinked with 1% formaldehyde (diluted in clear DMEM) for 10 min at room temperature. Glycine was added (125 mM final concentration) and left at room temperature for 5 min to quench formaldehyde. Cells were then scraped in cold PBS containing protease inhibitors (Roche). For lysate, each plate of cells (around 80% confluent) was resuspended in 250 μl of lysis buffer (1% SDS, 10 mM EDTA, 50 mM Tris–HCl [pH 8.1]) supplemented with protease inhibitors (Roche). Chromatin was sonicated with a Bioruptor sonicator (Diagenode) to obtain fragments of 200–600 bp in size (setting: 15 min, 30 s ON/30 s OFF). After centrifugation (10 min, 14,000 g, 4 °C), the sheared chromatin was diluted in dilution buffer (1% Triton, 2 mM EDTA, 150 mM NaCl, 20 mM Tris–HCl [pH 8.1]) supplemented with protease inhibitors (Roche). For each ChIP, 5 μg of antibody pre‐conjugated with 50 μl of Protein A‐ or G‐magnetic beads (Life Technologies GmbH) were then added to the diluted chromatin. Antibodies used were: ERα (sc‐543, Santa Cruz Biotechnology) and CTCF (07‐729 from Millipore). Chromatin and the combination of antibody/magnetic beads were mixed at 4 °C with rotation O/N, in a final volume of 1.5 ml. DNA‐protein interactions were washed 6 times with RIPA buffer (50 mM Hepes [pH7.6], 1 mM EDTA, 0.7% Na‐deoxycholate, 1% NP‐40, 0.5 M LiCl). Chromatin was eluted with 100 μl of elution buffer (1% SDS, 50 mM NaHCO3) and reverse cross‐linked at 65 °C for 6–16 h. For real‐time PCR, DNA was purified with NucleoSpin Gel and PCR Clean‐up kit (Macherey–Nagel) following the manufacturer's instructions.
Primers: MRPS30 promoter.
FW 5′‐CTCCCAGCGTCAGGTCTAAG‐3′ REV 5′‐TGTTGCGTCATTCATGGTTT‐3′.
Primers: CTCF site.
FW 5′‐TGTGAAGCATGAGGTGAACAA‐3′ REV 5′‐TCTGGCAGAGATGCAGCTATTA‐3′.
Primers: DNase I hypersensitive region:
FW 5′‐TCCTGTCTTCCATCCCAGAG‐3′ REV 5′‐CAAGCAGCCCTCATGAAACT‐3′.
3. Results
3.1. MRPS30 expression is associated with rs7716600 in ER‐positive tumors
We first performed a genome‐wide analysis of cis‐acting eQTLs in 97 normal breast tissue samples and 284 breast adenocarcinomas. The tumor cohort comprised 216 ER‐positive tumors and 68 ER‐negative tumors. We limited the study to cis‐acting loci because of insufficient power to identify trans‐eQTLs, defining cis‐acting loci as residing in a one megabase window around each gene's annotated transcription start site. Statistical significance was assessed by permutation (see Methods and experimental summary in Supplemental Figure 1). This analysis identified 57 genes in the normal dataset and 170 genes in the tumor dataset with cis‐eQTLs significant at a 5% false discovery rate (Figure 1a, Supplemental Tables 1 and 2). Breast tumor eQTLs were distributed across the genome and no region of the genome was significantly over‐represented in the number of eQTLs detected. When we analyzed ER‐positive and ER‐negative cohorts separately, 24 genes were significant only in ER‐positive tumors while two were significant only in ER‐negative tumors. Seventeen genes had significant eQTL in both normal tissue and tumor datasets. The larger number of significant eQTLs detected in ER‐positive tumors may reflect both the larger number of samples in this cohort and differences in the genetic architecture between cohorts.
Figure 1.
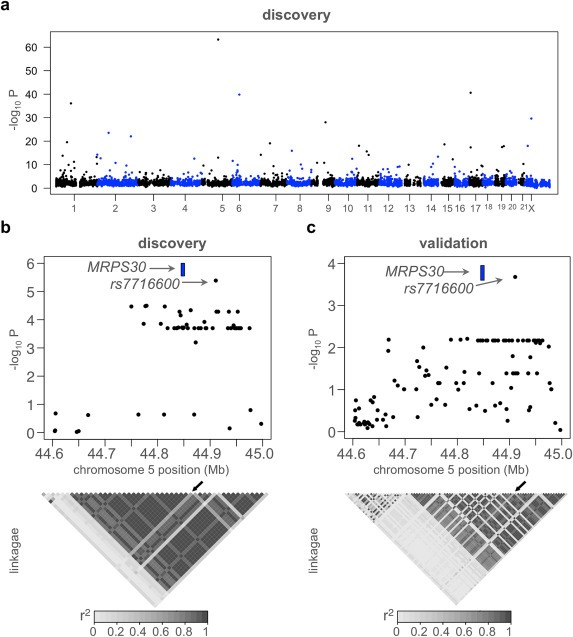
Variation at rs7716600 is associated with MRPS30 expression in ER‐positive breast cancer. (a) Manhattan plot of the most significant cis‐eQTL for each gene in the tumor dataset. Horizontal line indicates genome‐wide significance. (b) Manhattan plot of the association between genotypes in the region near rs7716600 and expression of MRPS30 with a significant peak at rs7716600, drawn in blue. The location of MRPS30 is noted as a blue box. Below this, a heat map of linkage of loci near MRPS30 (r2); rs7716600 indicated by arrow. (c) Figure (b) drawn for validation data, indicating the same locus was most significantly associated with MRPS30 expression. (For interpretation of the references to colour in this figure legend, the reader is referred to the web version of this article.)
To select for loci likely to be relevant specifically in breast cancer, we compared our list of genes with significant eQTLs to a database of genes with previously reported eQTLs in tissues such as lymphoblastoid cell lines, liver, and brain tissue (Myers et al., 2007; Schadt et al., 2008; Stranger et al., 2007; eqtl.uchicago.edu). Most of the significant variants we detected affect genes whose expression have been reported to be under genetic control in several human tissues, such as endoplasmic reticulum aminopeptidase 2 (ERAP2) (Dimas et al., 2009; Pickrell et al., 2010). Of the 170 genes with significant eQTL in tumors, 135 had previously been identified in studies of other normal human tissues. This suggested that we were powered to detect eQTLs with relatively large effects, and that many of the loci that we found affect more than one tissue type.
In Table 1 we report 29 genes with significant breast tumor cis‐eQTL for which no previous study has, to our knowledge, reported an eQTL. One of these was rs7716600 on chromosome 5 at 44,875,004 bases, which was significantly associated with expression of MRPS30 (Figure 1b). Locus 5p12 has been associated with susceptibility to ER‐positive breast cancer in several GWAS (Kim et al., 2012; Li et al., 2011; Milne et al., 2011; Ruiz‐Narvaez et al., 2010; Stacey et al., 2008). The rs7716600 locus is approximately 60 kilobases (kB) downstream from MRPS30. Li et al. reported the strongest association on 5p12 was rs7716600 (P = 7.06 × 10⁻⁷, with each A allele increasing the odds ratio of breast cancer by 1.24). Our data support previous reports (Stacey et al., 2008) indicating that the region near MRPS30 has a low recombination rate (Figure 1b).
Table 1.
eQTLs significant in tumors and not previously identified in the UChicago eQTL database.
| Symbol | SNP | Locus | Chr. | Mb | P disc. | P perm. disc. | P validation |
|---|---|---|---|---|---|---|---|
| CYP2J2 | rs11572255 | 1p31.3‐p31.2 | 1 | 60.15 | 6.8 × 10⁻⁶ | 0.0007 | 0.012 |
| PRMT6 | rs1623927 | 1p13.3 | 1 | 107.40 | 6.1 × 10⁻¹² | <0.0001 | 7.9 × 10⁻¹² |
| C1D | rs10203061 | 2p13‐p12 | 2 | 68.14 | 2.8 × 10⁻²⁴ | <0.0001 | 0.304 |
| VILL | rs6806209 | 3p21.3 | 3 | 38.43 | 2.1 × 10⁻⁵ | 0.0008 | 0.630 |
| ZNF654 | rs6805957 | 3p11.1 | 3 | 88.34 | 5.7 × 10⁻⁷ | <0.0001 | 0.006 |
| NDUFB4 | rs373188 | 3q13.33 | 3 | 121.99 | 2.0 × 10⁻⁵ | 0.0007 | 0.770 |
| RAB33B | rs7681614 | 4q28 | 4 | 140.52 | 2.7 × 10⁻¹³ | <0.0001 | NA |
| FAM198B | rs 1928267 | 4q32.1 | 4 | 159.36 | 5.1 × 10⁻⁶ | 0.0005 | NA |
| MRPS30 | rs7716600 | 5p12 | 5 | 44.91 | 7.0 × 10⁻⁷ | <0.0001 | 4.0 × 10⁻⁴ |
| ZCCHC10 | rs10793814 | 5q31.1 | 5 | 132.77 | 8.3 × 10⁻⁶ | 0.0008 | 0.285 |
| TBCC | rs10948067 | 6p21.1 | 6 | 43.31 | 4.7 × 10⁻⁶ | 0.0004 | 0.154 |
| PSPH | rs1113765 | 7p11.2 | 7 | 55.86 | 8.2 × 10⁻²⁰ | <0.0001 | 0.746 |
| GTPBP10 | rs1029365 | 7q21.13 | 7 | 89.75 | 2.7 × 10⁻⁶ | 0.0003 | NA |
| RASEF | rs4391505 | 9q21.32 | 9 | 84.79 | 9.3 × 10⁻²⁹ | <0.0001 | 4.0 × 10⁻²⁰ |
| PYROXD1 | rs1476905 | 12p12.1 | 12 | 21.49 | 9.3 × 10⁻⁹ | <0.0001 | 3.8 × 10⁻⁵ |
| FAM60A | rs256722 | 12p11 | 12 | 30.91 | 1.0 × 10⁻⁵ | 0.0008 | 0.787 |
| ZBTB1 | rs1542313 | 14q23.3 | 14 | 64.07 | 9.4 × 10⁻¹⁰ | <0.0001 | 0.053 |
| PTGR2 | rs8500 | 14q24.3 | 14 | 73.50 | 1.2 × 10⁻⁶ | 0.0001 | NA |
| EIF3C | rs6565259 | 16p11.2 | 16 | 28.81 | 8.0 × 10⁻⁸ | <0.0001 | 2.0 × 10⁻⁷ |
| TMEM220 | rs440655 | 17p13.1 | 17 | 10.56 | 1.3 × 10⁻⁷ | <0.0001 | 0.091 |
| PSMG2 | rs11080611 | 18p11.21 | 18 | 12.90 | 3.1 × 10⁻⁶ | 0.0004 | 0.531 |
| UBL5 | rs3815746 | 19p13.3 | 19 | 9.94 | 3.0 × 10⁻⁶ | 0.0001 | 0.102 |
| KLF2 | rs3765070 | 19p13.11 | 19 | 15.90 | 8.1 × 10⁻⁶ | 0.0007 | 0.425 |
| IGFLR1 | rs2871921 | 19q13.12 | 19 | 40.92 | 3.3 × 10⁻¹⁸ | <0.0001 | 0.003 |
| IRF3 | rs7259683 | 19q13.3‐q13.4 | 19 | 54.85 | 5.5 × 10⁻⁶ | 0.0003 | 0.007 |
| C20orf54 | rs6140090 | 20p13 | 20 | 0.68 | 2.1 × 10⁻⁶ | 0.0005 | 0.001 |
| YBEY | rs2839186 | 21q22.3 | 21 | 46.51 | 3.8 × 10⁻⁷ | <0.0001 | 0.034 |
| ARFGAP3 | rs1807591 | 22q13.2 | 22 | 41.52 | 5.1 × 10⁻⁶ | 0.0008 | 8.3 × 10⁻⁴ |
Genes listed as NA were called not expressed in the validation dataset. The P disc. and P validation columns report the raw P value of the eQTL in discovery and validation datasets, while the P perm. disc. column reports the permutation‐adjusted P value in the discovery dataset.
We replicated the eQTL analysis for the 29 associations listed in Table 1 in an independent cohort of 235 breast tumors where both genotype and expression data were available (Curtis et al., 2012). In light of a recent report suggesting many published cis‐eQTLs are technical artifacts caused by SNPs located in the binding region of microarray probes (Ramasamy et al., 2013), we note that both gene expression and genotypes in the discovery and validation microarray datasets were measured on distinct platforms. The genotypes of SNPs present in the discovery, but not validation dataset were imputed (see Methods ). In this analysis rs7716600 was the 5p12 SNP most significantly associated with MRPS30 expression (P = 4 × 10⁻⁴, permutation P = 0.019, Figure 1c), with association only in ER‐positive tumors. This finding, significant after Bonferroni correction for 29 tests, confirmed the significance of a genetic link between this locus and expression of MRPS30 mRNA. We focused our subsequent analysis on MRPS30 because it was the only candidate gene from a GWAS among the 29 breast‐specific genes that were identified.
3.2. MRPS30 response to estrogen stimulation is associated with rs7716600
MRPS30 is a constituent of the mitochondrial ribosome, which generates proteins which produce the bulk of the ATP in eukaryotic cells. Mitochondrial ribosomal proteins are translated in the cytoplasm from nuclear genes and imported into mitochondria, where they are essential for oxidative phosphorylation. We found that the less frequent risk‐associated A allele of rs7716600 was significantly associated with higher expression of MRPS30 in ER‐positive but not ER‐negative tumors in the discovery and validation cohorts (Figure 2a, b). This is compatible with GWAS results showing that the locus affects susceptibility to ER‐positive but not ER‐negative breast cancer (Kim et al., 2012; Li et al., 2011; Milne et al., 2011; Ruiz‐Narvaez et al., 2010; Stacey et al., 2008). In both the discovery and validation datasets MRPS30 expression levels in ER‐negative tumors and in ER‐positive tumors homozygous for the C allele of rs7716600 were comparable (Figure 2a, b). Elevated MRPS30 expression was exclusively associated with both estrogen sensitivity and presence of an A allele.
Figure 2.
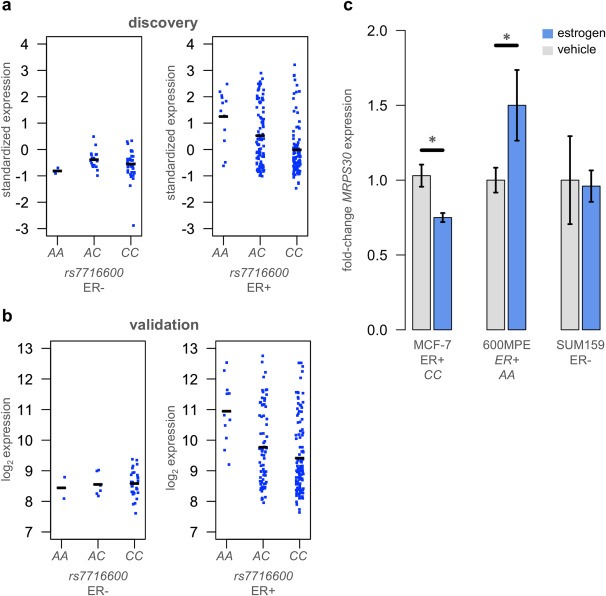
Expression of MRPS30 is influenced by estrogen levels in MCF‐7 cells. (a) Mean‐centered standardized expression of MRPS30 plotted against rs7716600 genotype in discovery ER‐negative and ER‐positive tumors, demonstrating that this locus is only associated with MRPS30 expression in ER‐positive tumors. Horizontal bars indicate mean expression level per genotype. (b) Log2 expression of MRPS30 plotted against rs7716600 genotype in validation ER‐negative and ER‐positive tumors. (c) Expression of MRPS30 in ER‐positive MCF‐7 and 600MPE and ER‐negative SUM159 cell lines after 12 h of estrogen exposure (blue bar) compared to vehicle (gray bar), indicating MRPS30 expression responds directly to estrogen exposure in ER‐positive cells and that the direction of response at 12 h is associated with rs7716600 genotype. Error bars indicate 1 s.d.
Since the 5p12 locus is relevant only in ER‐positive tumors, we compared MRPS30 co‐expression networks in ER‐positive and ER‐negative tumors separately to suggest estrogen‐mediated differences in MRPS30 function. The genes most significantly correlated in each condition were distinct and functionally enriched for different functions. In ER‐positive tumors MRPS30 expression was correlated significantly with 282 genes (Supplemental Table 3). Among the strongest direct correlations were genes in the estrogen signaling pathway, including the estrogen receptor itself (ESR1) and other genes crucial for the estrogen response such as GATA3 and FOXA1 (Table 2). The 282 ER‐positive genes were significantly enriched for roles in response to estrogen stimulus, anti‐apoptosis, positive regulation of epithelial cell proliferation, and cell differentiation (all corrected P < 8 × 10⁻⁴, hypergeometric test, see Methods ).
Table 2.
MRPS30 expression is correlated with estrogen signaling genes in ER‐positive tumors.
| symbol | ER‐positive | ER‐negative | ||
|---|---|---|---|---|
| rho | P | rho | P | |
| SLC39A6 | 0.50 | 2 × 10⁻¹⁷ | 0.23 | 0.02 |
| TPRG1 | 0.48 | 2 × 10⁻¹⁵ | −0.12 | 0.30 |
| ESR1 | 0.45 | 2 × 10⁻¹⁴ | 0.04 | 0.70 |
| P4HTM | 0.44 | 4 × 10⁻¹⁴ | 0.10 | 0.30 |
| CA12 | 0.44 | 8 × 10⁻¹⁴ | −0.06 | 0.60 |
| MAGED2 | 0.44 | 1 × 10⁻¹³ | 0.09 | 0.40 |
| SIAH2 | 0.43 | 5 × 10⁻¹³ | 0.30 | 4 × 10⁻³ |
| ELP2 | 0.42 | 6 × 10⁻¹³ | 0.27 | 8 × 10⁻³ |
| HEXIM2 | 0.41 | 4 × 10⁻¹² | −0.02 | 0.80 |
| C17orf75 | 0.41 | 4 × 10⁻¹² | 0.29 | 5 × 10⁻³ |
| HPN | 0.41 | 5 × 10⁻¹² | 0.09 | 0.40 |
| GATA3 | 0.40 | 4 × 10⁻¹¹ | 0.04 | 0.70 |
| WWP1 | 0.40 | 1 × 10⁻¹¹ | 0.02 | 0.90 |
| SEMA3B | 0.40 | 2 × 10⁻¹¹ | NA | NA |
| POLB | 0.40 | 2 × 10⁻¹¹ | 0.37 | 2 × 10⁻⁴ |
| COMMD4 | 0.39 | 4 × 10⁻¹¹ | 0.22 | 0.03 |
| UGCG | 0.39 | 7 × 10⁻¹¹ | −0.13 | 0.20 |
| C6orf211 | 0.39 | 9 × 10⁻¹¹ | 0.24 | 0.02 |
| FOXA1 | 0.39 | 8 × 10⁻¹¹ | −0.07 | 0.50 |
| C6orf97 | 0.39 | 1 × 10⁻¹⁰ | NA | NA |
This ranked list of the 20 genes most significantly correlated with MRPS30 in ER‐positive tumors shows MRPS30 expression is significantly correlated with key estrogen pathway genes including ESR1, GATA3, and FOXA1. The rho columns indicate Spearman's rho values, while the P columns indicate the P values.
The ER‐negative correlation list (Table 3) comprised 248 genes enriched for roles in the M phase of the mitotic cell cycle (P = 6 × 10⁻¹³, see Methods and Supplemental Table 4) and RNA metabolism (P = 4 × 10⁻⁵), which was not the case in ER‐positive tumors. The strongest correlations were with PES1 (pescadillo ribosomal biogenesis factor 1) and BRIX1 (biogenesis of ribosomes), genes essential for ribosomal assembly (Kaser et al., 2001; Lerch‐Gaggl et al., 2002). In the normal breast tissue cohort no gene was significantly correlated with MRPS30, and no tested SNP had a significant eQTL for MRPS30 expression (P > 0.05). Searching at lower stringency, we did not find evidence for a correlation between MRPS30 and genes in the estrogen response signature in normal tissue (data not shown). These results were concordant with role of MRPS30 in mitochondrial protein synthesis in ER‐negative tissues, but suggested that MRPS30 transcription levels are affected by the estrogen signaling pathway in ER‐positive tumors.
Table 3.
MRPS30 expression is correlated with Mitochondrial & Mitotic genes in ER‐negative tumors.
| symbol | ER‐positive | ER‐negative | ||
|---|---|---|---|---|
| rho | P | rho | P | |
| PES1 | −0.05 | 0.40 | 0.51 | 1 × 10⁻⁷ |
| BRIX1 | 0.06 | 0.30 | 0.47 | 2 × 10⁻⁶ |
| KIAA1524 | 0.04 | 0.50 | 0.46 | 3 × 10⁻⁶ |
| SKP2 | NA | NA | 0.45 | 9 × 10⁻⁶ |
| CECR5 | −0.01 | 0.90 | 0.44 | 1 × 10⁻⁵ |
| UBQLN4 | 0.05 | 0.40 | 0.44 | 1 × 10⁻⁵ |
| PAIP1 | 0.25 | 5 × 10⁻⁵ | 0.43 | 2 × 10⁻⁵ |
| MRPL3 | 0.10 | 0.10 | 0.43 | 4 × 10⁻⁵ |
| RAD1 | 0.18 | 3 × 10‐3 | 0.42 | 3 × 10⁻⁵ |
| CKM | NA | NA | 0.42 | 6 × 10⁻⁵ |
| NHEJ1 | −0.03 | 0.70 | 0.40 | 6 × 10⁻⁵ |
| TADA1 | 0.13 | 0.03 | 0.40 | 7 × 10⁻⁵ |
| HDDC2 | −0.08 | 0.20 | 0.40 | 6 × 10⁻⁵ |
| MAD2L2 | −0.01 | 0.90 | 0.40 | 8 × 10⁻⁵ |
| NIPSNAP1 | 0.06 | 0.40 | 0.40 | 7 × 10⁻⁵ |
| MINPP1 | 0.19 | 2 × 10⁻³ | 0.40 | 7 × 10⁻⁵ |
| NIF3L1 | 0.18 | 4 × 10⁻³ | 0.40 | 9 × 10⁻⁵ |
| RASA1 | 0.21 | 7 × 10⁻⁴ | 0.39 | 8 × 10⁻⁵ |
| OIP5 | 0.12 | 0.06 | 0.39 | 1 × 10‐4 |
| NADKD1 | 0.22 | 3 × 10⁻⁴ | 0.39 | 9 × 10⁻⁵ |
This ranked list of the 20 genes most significantly correlated with MRPS30 shows that in ER‐negative tumors, by contrast, the most significant correlations are with ribosomal biogenesis genes such as PES1 and BRIX1 and cell cycle checkpoint genes such as SKP2, RAD1, and MAD2L2. The rho columns indicate Spearman's rho values, while the P columns indicate the P values.
We next tested whether MRPS30 transcription responds directly to estrogen stimulus, and whether this response is distinct depending on rs7716600 genotype. Published SNP data (Heiser et al., 2012) predicted the luminal breast cancer lines cell lines 600MPE and MCF‐7 would have the genotypes AA and CC respectively at rs7716600. We confirmed by Sanger sequencing that MCF‐7 has the more common CC genotype, while 600MPE has the rarer risk‐associated AA genotype. After 12 h of estrogen treatment, 600MPE cells express on average 1.5 times more MRPS30 (P = 0.002, t test, Figure 2c, see Methods ). In contrast, after 12 h of estrogen exposure, MCF‐7 cells express modestly but significantly less MRPS30 at the same time point (0.75‐fold decrease, P = 0.004, t test, Figure 2c). As a negative control we also tested ER‐negative SUM159 cells, which showed as expected no significant change in MRPS30 expression levels after 12 h of exposure (P = 0.35, t test, Figure 2c). These data suggested that MRPS30 expression was responsive to estrogen stimulus in estrogen‐responsive tumor cells and that the direction of the response was associated with rs7716600 genotype.
3.3. MRPS30 promoter availability is associated with variation at rs7716600
Reversible increases in histone methylation at gene promoters wind chromatin loops more tightly, reducing DNA availability and thereby affecting transcription levels. We tested whether allelic variation in rs7716600 was associated with methylation of DNA at the MRPS30 promoter using the Illumina HumanMethylation450 microarray in 123 tumor samples from the discovery cohort. Decreased methylation of a probe located immediately 5‐prime of MRPS30 was significantly associated with the A allele of the rs7716600 genotype in ER‐positive but not ER‐negative tumors (P = 0.0004 vs. P = 0.37, Figure 3a). Methylation at this locus and expression of MRPS30 were significantly and inversely related, only in ER‐positive tumors (P < 2 × 10⁻¹⁶ vs. P = 0.99, Figure 3b). Levels of methylation in ER‐negative tumors were high in all three genotypes.
Figure 3.
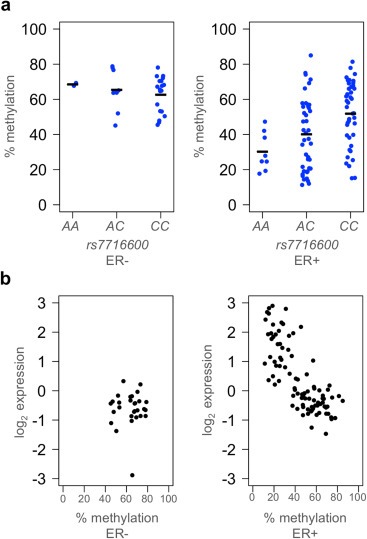
Allelic variation at rs7716600 is associated with methylation of MRPS30. (a) Degree of methylation of the region immediately upstream of the MRPS30 transcription start site plotted against genotype in ER‐negative and ER‐positive tumors. Horizontal bars indicate mean methylation level per genotype. (b) Methylation percentage of the same locus plotted against expression of MRPS30 measured in the same tumors in ER‐negative (c) and ER‐positive (d) tumors.
Since rs7716600 is 60 kB downstream of MRPS30 and yet was more strongly associated with MRPS30 expression than any SNP within one megabase of the MRPS30 transcription start site in both the discovery and validation cohorts, we hypothesized that a trans‐acting locus may be affecting MRPS30 expression via chromatin remodeling at or near the MRPS30 promoter. Genomic regions hypersensitive to the enzyme DNase I are free of nucleosomes and often bound by enhancers such as the insulator‐binding protein CCCTC‐binding factor (CCTF) (Gross and Garrard, 1988; Maurano et al., 2012). Data from the ENCODE consortium indicated that a locus 700 bases from rs7716600 contains a DNase I hypersensitivity cluster, binding sites for numerous transcription factors, and histone marks in Human Mammary Epithelial Cells (HMEC) associated with promoters and enhancers (Supplemental Figure 2) (Dunham et al., 2012).
We performed ChIP‐PCR to test whether ER‐alpha binding at the MRPS30 promoter region and the DNase hypersensitive region near rs7716600 increased after 12 h of estrogen exposure. We measured a two‐fold increase in ER‐alpha binding at the MRPS30 promoter after estrogen exposure compared to vehicle (P = 0.055, t test, Figure 4a) and a 42% increase in ER‐alpha binding at the DNase locus (P = 0.006, t test, Figure 4b) in MCF‐7 cells carrying the CC genotype, but no significant increase in 600MPE cells that carry the AA genotype. It was recently reported that binding of ESR1 and the pioneer factor FOXA1 to rs7716600 significantly increase after short‐term estrogen exposure in MCF‐7 cells (Cowper‐Sal et al., 2012), corroborating these findings. Since ENCODE data suggested that both the MRPS30 promoter and a region approximately 12 kB upstream from the SNP contained CTCF binding sites in immortalized HMEC cells (Supplemental Figure 2), we measured the estrogen‐dependent binding of CTCF at these loci. Both the MRPS30 promoter and the CTCF locus bound a significantly greater amount of CTCF in response to estrogen stimulus in MCF‐7 cells but not 600MPE cells carrying the AA genotype (P = 0.02 vs. P = 0.43, P = 0.016 vs. P = 0.21, t test, Figure 4c, d).
Figure 4.
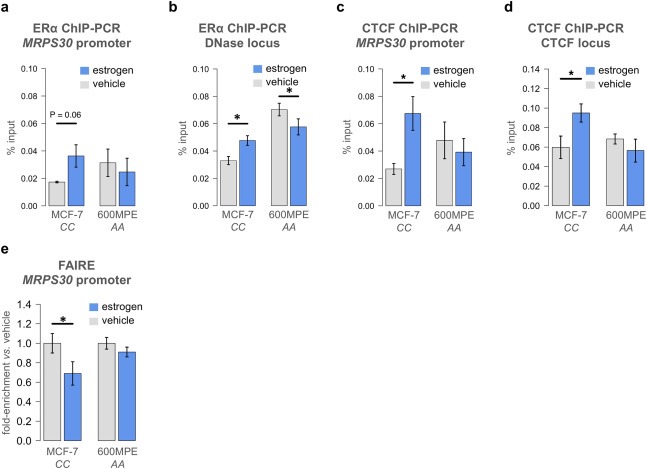
Increased binding of ER & CTCF to MRPS30 in MCF‐7 but not 600MPE cells after estrogen exposure. ER‐alpha binding levels at the MRPS30 promoter (a) and near rs7716600 (b) after 12 h of estrogen exposure in MCF‐7 and 600MPE cells, indicating that ER‐alpha binding levels were increased at both loci in MCF‐7 but not 600MPE cells. CTCF binding levels at the MRPS30 promoter (c) and a predicted CTCF binding site 12 Kb from rs7716600 (d) after 12 h of estrogen exposure in MCF‐7 and 600MPE cells, indicating that CTCF binding was increased only in MCF‐7 cells. (e) Results from FAIRE analysis of the MRPS30 promoter in response to 12 h of estrogen exposure showing a significant decrease in nucleosome availability in MCF‐7 cells but no change in 600MPE cells. All error bars indicate 1 s.d.
We performed a formaldehyde‐assisted isolation of regulatory elements (FAIRE) experiment (Giresi and Lieb, 2009; Gilfillan et al., 2012) to assess whether chromatin changes were induced by estrogen and whether they were associated with rs7716600 genotype. We found reduced euchromatic conditions at the MRPS30 promoter in MCF‐7 cells after 12 h of estrogen treatment (P = 0.018, t test, Figure 4e). In contrast, no significant chromatin changes were observed at the same locus in the 600MPE cell line (P = 0.205). These data are compatible with a model (Figure 5) in which transcription of MRPS30 is affected by methylation and chromatin status at its promoter conditional on the rs7716600 genotype.
Figure 5.
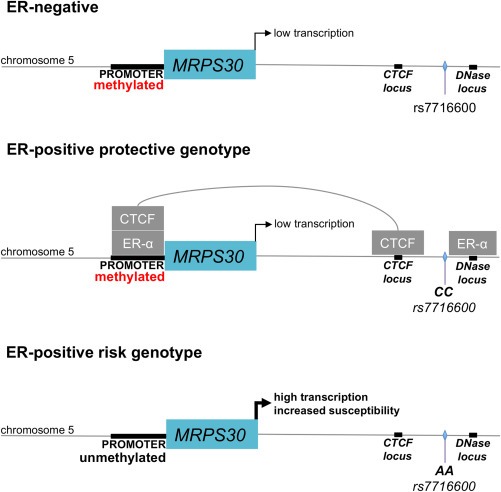
A model for control of MRPS30 gene expression in ER‐positive tumors by chromatin remodeling. In the absence of estrogen, the MRPS30 promoter is methylated. MRPS30 expression is correlated with the production of mitochondrial ribosomes. In tissues which respond to estrogen and possess the more common rs17716600 CC genotype, estrogen stimulation causes ER‐alpha and CTCF to bind to MRPS30 and MRPS30 transcription is repressed. This is not the case in estrogen‐responsive tissues with the susceptibility‐linked rs17716600 A allele. These tumors lack MRPS30 promoter methylation and respond to estrogen stimulation with increased expression of MRPS30.
4. Discussion
We have used eQTL analysis of breast tumors to show the rs7716600 risk allele is associated with elevated MRPS30 expression and decreased methylation at the MRPS30 promoter. We hypothesize that elevated MRPS30 expression increases risk. In this model DNA methylation appears to play a protective role. In ER‐positive breast tumor cells that carry only the protective C allele of rs7716600, estrogen stimulus causes increased ER and CTCF binding to MRPS30 and decreased availability of the MRPS30 promoter. We speculate that a chromatin loop mediated by CTCF binding can connect the region near rs7716600 to the MRPS30 promoter (Phillips and Corces, 2009; Splinter et al., 2006), and that this is the mechanism of the variant's action at a distance. Many ER‐responsive genes are affected by ER binding at loci distant from the promoter and interact with the promoter via chromatin loops (Pan et al., 2008). Although CTCF binding sites have been reported to be largely invariant between cell lines (Kim et al., 2007) and CTCF binding is not ubiquitously affected by estrogen treatment in breast cancer cell lines, cell‐line specific changes in ER‐mediated CTCF binding have been observed (Ross‐Innes et al., 2011).
This model, summarized in Figure 5, is compatible with the risk effect being present only in ER‐positive tumors, and with the effect on MRPS30 expression not being detectable in normal tissue, which contains a mix of ER‐positive and ER‐negative cells. Our previous eQTL analysis of normal tissue and matched tumors demonstrated that germline influence on cancer susceptibility mediated by gene expression is altered during tumor progression (Quigley et al., 2011). The present study had modest power to identify eQTL in normal breast tissue; to our knowledge no larger study of normal breast tissue has yet been published. Because we did not detect a MRPS30 eQTL in normal tissue, we hypothesize that this locus is relevant after an ER‐positive tumor has been initiated.
The causal variant or variants affecting MRPS30 expression are unknown. A limitation of our study is that MCF‐7 and 600MPE cells contain many differences apart from their genotype at rs7716600; generating an isogenic MCF‐7 cell line containing the MRPS30 region from 600MPE was beyond the scope of this work. Other groups have reported that SNPs upstream of the MRPS30 promoter are linked to susceptibility, and the low recombination rate in this region makes isolation of a narrow risk locus more difficult. Although eQTL studies are frequently used to suggest a functional consequence of disease risk variants (Emilsson et al., 2008; Michailidou et al., 2013; Quigley et al., 2009), we did not formally demonstrate a link between elevated MRPS30 expression and risk. This work does not address the question of why elevated MRPS30 expression would increase breast cancer risk. Changes in MRPS30 expression may affect the probability of apoptosis by altering mitochondrial pathways. The mitochondria are crucial in the induction of apoptosis, and transgenic expression of MRPS30 (also called p52 and PDCD9) in mouse fibroblasts induces apoptosis (Sun et al., 1998). It is not clear whether the modest changes in constitutive MRPS30 expression induced by estrogen in physiologically relevant doses would have the same effect. A study examining interactions between 27 breast cancer risk alleles and occupational radiation exposure reported that the only nominally significant interaction was at the risk allele at 5p12 in MRPS30 (Bhatti et al., 2010). That study, which was not stratified by ER status, is consistent with an effect of MRPS30 genotype on radiation‐induced apoptosis and breast cancer risk. Alternatively, MRPS30 could affect ATP production in a way that stimulates tumor growth.
Our study was motivated by the hypothesis that some susceptibility loci function by affecting basal gene expression levels in tumors, but this is unlikely to be true for all variants. Our unbiased screen of the genome identified only one GWAS locus associated with gene expression. Mechanisms which would not be detected by this approach include variants which modify gene function, protein localization, or post‐translational modification but not expression levels. Somatic variations affecting expression which are not associated with germline variation reduce the proportion of variance attributable to the germline, increasing the difficulty of isolating eQTL effects (Quigley et al., 2011). However, when somatic variation is allele‐specific we will still be able to detect a germline effect. Normal breast tissue and breast tumors have distinct genetic architectures, and both tissues must be analyzed to understand how and when a risk allele is relevant. This study demonstrates that eQTL studies in tumors should be integrated with genetic analysis of DNA methylation and functional assays to identify a candidate mechanism behind risk variants, and that one way variants can affect the response to estrogen stimulation is by changing gene promoter availability.
Author's contributions
Performed in vitro work: EF, DAQ. Planned and supervised in vitro work: AH. Performed statistical analysis: DAQ. Contributed to analysis: SN. Contributed genotyping data: PVL, GGA, JT, JO. Contributed expression data: HKV, IRB. Contributed methylation data: TF. Planned and supervised the study: VK, ABD, AB. Wrote the manuscript: DAQ. All authors read and approved the final manuscript.
Competing interests
The authors declare no competing interests.
Database references
Supporting information
The following is the supplementary data related to this article:
Supplementary Table 1 is a full list of genes with significant tumor eQTL in the discovery dataset. Supplementary Table 2 is a full list of genes with significant normal eQTL. Supplementary Table 3 lists all genes with significant correlation with MRPS30 in ER‐positive tumors. Supplementary Table 4 lists all genes with significant correlation with MRPS30 in ER‐negative tumors. Supplementary Figure 1 is a flowchart illustrating the analysis that resulted in a validated MRPS30 eQTL. Supplementary Figure 2 is a screen shot from the UCSC Genome Browser (genome.ucsc.edu) indicating the physical location of MRPS30, the three locations targeted by protein binding assays, the location of DNase clusters, and the location of relevant histone marks.
Acknowledgements
DAQ thanks Penguin Computing Inc. for a donation of computer processing time, Matthew Ritchie for assistance with CRLMM, Stephen Turner for sharing code to generate Manhattan plots, and Harry Quigley for comments on the manuscript. This work was supported by NCI grants CA084244‐15 and CA141455‐01 to AB. ABD acknowledges DNK grant 4196283563; VK acknowledges DNK grant 4196163832; ABD and VK acknowledge NFR‐FUGE grant 193387/V50 from the Norwegian Research Council and Helse Sø‐Øst grant 2011042 from the South‐Eastern Norway Regional Health Authority. Thanks to the UNIFOR and Eckbo legater for supporting the genotyping. PVL is a postdoctoral researcher of the Research Foundation – Flanders (FWO).
Supplementary data 1.
Supplementary data related to this article can be found at http://dx.doi.org/10.1016/j.molonc.2013.11.008.
Quigley David A., Fiorito Elisa, Nord Silje, Van Loo Peter, Alnæs Grethe Grenaker, Fleischer Thomas, Tost Jorg, Moen Vollan Hans Kristian, Tramm Trine, Overgaard Jens, Bukholm Ida R., Hurtado Antoni, Balmain Allan, Børresen-Dale Anne-Lise and Kristensen Vessela, (2014), The 5p12 breast cancer susceptibility locus affects MRPS30 expression in estrogen‐receptor positive tumors, Molecular Oncology, 8, doi: 10.1016/j.molonc.2013.11.008.
Contributor Information
David A. Quigley, Email: dquigley@cc.ucsf.edu
Elisa Fiorito, Email: elisa.fiorito@ncmm.uio.no.
Silje Nord, Email: silje.nord@rr-research.no.
Peter Van Loo, Email: pvl@sanger.ac.uk.
Grethe Grenaker Alnæs, Email: Grethe.I.Grenaker.Alnas@rr-research.no.
Thomas Fleischer, Email: thofle@rr-research.no.
Jorg Tost, Email: tost@cng.fr.
Hans Kristian Moen Vollan, Email: Hans.Kristian.Moen.Vollan@rr-research.no.
Trine Tramm, Email: TRAMM@ONCOLOGY.DK.
Jens Overgaard, Email: jens@oncology.dk.
Ida R. Bukholm, Email: i.r.k.bukholm@medisin.uio.no
Antoni Hurtado, Email: a.h.rodriguez@ncmm.uio.no.
Allan Balmain, Email: abalmain@cc.ucsf.edu.
Anne-Lise Børresen-Dale, Email: a.l.borresen-dale@medisin.uio.no.
Vessela Kristensen, Email: Vessela.N.Kristensen@rr-research.no, Email: vessela@ulrik.uio.no.
References
- Bhatti, P. , Doody, M.M. , Rajaraman, P. , Alexander, B.H. , Yeager, M. , Hutchinson, A. , 2010. Novel breast cancer risk alleles and interaction with ionizing radiation among U.S. radiologic technologists. Radiat. Res.. 173, 214–224. [DOI] [PMC free article] [PubMed] [Google Scholar]
- Brem, R.B. , Yvert, G. , Clinton, R. , Kruglyak, L. , 2002. Genetic dissection of transcriptional regulation in budding yeast. Science. 296, 752–755. [DOI] [PubMed] [Google Scholar]
- Churchill, G.A. , Doerge, R.W. , 1994. Empirical threshold values for quantitative trait mapping. Genetics. 138, 963–971. [DOI] [PMC free article] [PubMed] [Google Scholar]
- Cowper-Sal lari, R. , Zhang, X. , Wright, J.B. , Bailey, S.D. , Cole, M.D. , Eeckhoute, J. , 2012. Breast cancer risk-associated SNPs modulate the affinity of chromatin for FOXA1 and alter gene expression. Nat. Genet.. 44, 1191–1198. [DOI] [PMC free article] [PubMed] [Google Scholar]
- Curtis, C. , Shah, S.P. , Chin, S.F. , Turashvili, G. , Rueda, O.M. , Dunning, M.J. , 2012. The genomic and transcriptomic architecture of 2,000 breast tumours reveals novel subgroups. Nature. 486, 346–352. [DOI] [PMC free article] [PubMed] [Google Scholar]
- Dimas, A. , Deutsch, S. , Stranger, B. , Montgomery, S. , Borel, C. , Attar-Cohen, H. , 2012. Common regulatory variation Impacts gene expression in a cell type-dependent manner. Science. 325, 1246–1250. [DOI] [PMC free article] [PubMed] [Google Scholar]
- Dunham, I. , Kundaje, A. , Aldred, S.F. , Collins, P.J. , Davis, C.A. , Doyle, F. , 2012. An integrated encyclopedia of DNA elements in the human genome. Nature. 489, 57–74. [DOI] [PMC free article] [PubMed] [Google Scholar]
- Emilsson, V. , Thorleifsson, G. , Zhang, B. , Leonardson, A.S. , Zink, F. , 2008. Genetics of gene expression and its effect on disease. Nature. 452, 423–428. [DOI] [PubMed] [Google Scholar]
- Garcia-Closas, M. , Couch, F.J. , Lindstrom, S. , Michailidou, K. , Schmidt, M.K. , Brook, M.N. , 2013. Genome-wide association studies identify four ER negative-specific breast cancer risk loci. Nat. Genet.. 45, 392–398. 398e391-392 [DOI] [PMC free article] [PubMed] [Google Scholar]
- Gentleman, R. , 2005. Bioinformatics and Computational Biology Solutions Using R and Bioconductor Springer Science+Business Media; New York: [Google Scholar]
- Gilfillan, S. , Fiorito, E. , Hurtado, A. , 2012. Functional genomic methods to study estrogen receptor activity. J. Mammary Gland Biol. Neoplasia. 17, 147–153. [DOI] [PubMed] [Google Scholar]
- Giresi, P.G. , Lieb, J.D. , 2009. Isolation of active regulatory elements from eukaryotic chromatin using FAIRE (Formaldehyde Assisted Isolation of Regulatory Elements). Methods. 48, 233–239. [DOI] [PMC free article] [PubMed] [Google Scholar]
- Gross, D.S. , Garrard, W.T. , 1988. Nuclease hypersensitive sites in chromatin. Annu. Rev. Biochem.. 57, 159–197. [DOI] [PubMed] [Google Scholar]
- Heiser, L.M. , Sadanandam, A. , Kuo, W.L. , Benz, S.C. , Goldstein, T.C. , Ng, S. , 2012. Subtype and pathway specific responses to anticancer compounds in breast cancer. Proc. Natl. Acad. Sci. USA. 109, 2724–2729. [DOI] [PMC free article] [PubMed] [Google Scholar]
- Howie, B.N. , Donnelly, P. , Marchini, J. , 2009. A flexible and accurate genotype imputation method for the next generation of genome-wide association studies. PLoS Genet.. 5, e1000529 [DOI] [PMC free article] [PubMed] [Google Scholar]
- Hunter, D.J. , Kraft, P. , Jacobs, K.B. , Cox, D.G. , Yeager, M. , Hankinson, S.E. , 2007. A genome-wide association study identifies alleles in FGFR2 associated with risk of sporadic postmenopausal breast cancer. Nat. Genet.. 39, 870–874. [DOI] [PMC free article] [PubMed] [Google Scholar]
- Ji-Hyung Shin, S.B. , McNeney, Brad , Graham, Jinko , 2006. LDheatmap: an R function for graphical display of pairwise linkage disequilibria between single nucleotide polymorphisms. J. Stat. Softw. Code Snippets. 16, 1–9. [Google Scholar]
- Johnson, W.E. , Li, C. , Rabinovic, A. , 2007. Adjusting batch effects in microarray expression data using empirical Bayes methods. Biostatistics. 8, 118–127. [DOI] [PubMed] [Google Scholar]
- Kaser, A. , Bogengruber, E. , Hallegger, M. , Doppler, E. , Lepperdinger, G. , Jantsch, M. , 2001. Brix from xenopus laevis and brx1p from yeast define a new family of proteins involved in the biogenesis of large ribosomal subunits. Biol. Chem.. 382, 1637–1647. [DOI] [PubMed] [Google Scholar]
- Kim, H.C. , Lee, J.Y. , Sung, H. , Choi, J.Y. , Park, S.K. , Lee, K.M. , 2012. A genome-wide association study identifies a breast cancer risk variant in ERBB4 at 2q34: results from the Seoul Breast Cancer Study. Breast Cancer Res.. 14, R56 [DOI] [PMC free article] [PubMed] [Google Scholar]
- Kim, T.H. , Abdullaev, Z.K. , Smith, A.D. , Ching, K.A. , Loukinov, D.I. , Green, R.D. , 2007. Analysis of the vertebrate insulator protein CTCF-binding sites in the human genome. Cell. 128, 1231–1245. [DOI] [PMC free article] [PubMed] [Google Scholar]
- Lerch-Gaggl, A. , Haque, J. , Li, J. , Ning, G. , Traktman, P. , Duncan, S.A. , 2002. Pescadillo is essential for nucleolar assembly, ribosome biogenesis, and mammalian cell proliferation. J. Biol. Chem.. 277, 45347–45355. [DOI] [PubMed] [Google Scholar]
- Li, J. , Humphreys, K. , Heikkinen, T. , Aittomäki, K. , Blomqvist, C. , Pharoah, P.D.P. , 2011. A combined analysis of genome-wide association studies in breast cancer. Breast Cancer Res. Treat. 126, 717–727. [DOI] [PubMed] [Google Scholar]
- Li, Q. , Seo, J.H. , Stranger, B. , McKenna, A. , Pe'er, I. , Laframboise, 2013. Integrative eQTL-based analyses reveal the biology of breast cancer risk loci. Cell. 152, 633–641. [DOI] [PMC free article] [PubMed] [Google Scholar]
- Maere, S. , Heymans, K. , Kuiper, M. , 2005. BiNGO: a Cytoscape plugin to assess overrepresentation of gene ontology categories in biological networks. Bioinformatics. 21, 3448–3449. [DOI] [PubMed] [Google Scholar]
- Maurano, M.T. , Humbert, R. , Rynes, E. , Thurman, R.E. , Haugen, E. , Wang, H. , 2012. Systematic localization of common disease-associated variation in regulatory DNA. Science. 337, 1190–1195. [DOI] [PMC free article] [PubMed] [Google Scholar]
- Michailidou, K. , Hall, P. , Gonzalez-Neira, A. , Ghoussaini, M. , Dennis, J. , Milne, R.L. , 2013. Large-scale genotyping identifies 41 new loci associated with breast cancer risk. Nat. Genet.. 45, 353–361. [DOI] [PMC free article] [PubMed] [Google Scholar]
- Milne, R.L. , Goode, E.L. , Garcia-Closas, M. , Couch, F.J. , Severi, G. , Hein, R. , 2011. Confirmation of 5p12 as a susceptibility locus for progesterone-receptor-positive, lower grade breast cancer. Cancer Epidemiol. Biomarkers Prev.. 20, 2222–2231. [DOI] [PMC free article] [PubMed] [Google Scholar]
- Morley, M. , Molony, C.M. , Weber, T.M. , Devlin, J.L. , Ewens, K.G. , Spielman, R.S. , 2004. Genetic analysis of genome-wide variation in human gene expression. Nature. 430, 743–747. [DOI] [PMC free article] [PubMed] [Google Scholar]
- Myers, A.J. , Gibbs, J.R. , Webster, J.A. , Rohrer, K. , Zhao, A. , Marlowe, L. , 2007. A survey of genetic human cortical gene expression. Nat. Genet.. 39, 1494–1499. [DOI] [PubMed] [Google Scholar]
- Nica, A.C. , Parts, L. , Glass, D. , Nisbet, J. , Barrett, A. , Sekowska, M. , 2011. The architecture of gene regulatory variation across multiple human tissues: the MuTHER study. PLoS Genet.. 7, e1002003 [DOI] [PMC free article] [PubMed] [Google Scholar]
- Pan, Y.F. , Wansa, K.D. , Liu, M.H. , Zhao, B. , Hong, S.Z. , Tan, P.Y. , 2008. Regulation of estrogen receptor-mediated long range transcription via evolutionarily conserved distal response elements. J. Biol. Chem.. 283, 32977–32988. [DOI] [PubMed] [Google Scholar]
- Phillips, J.E. , Corces, V.G. , 2009. CTCF: master weaver of the genome. Cell. 137, 1194–1211. [DOI] [PMC free article] [PubMed] [Google Scholar]
- Pickrell, J.K. , Marioni, J.C. , Pai, A.A. , Degner, J.F. , Engelhardt, B.E. , Nkadori, 2010. Understanding mechanisms underlying human gene expression variation with RNA sequencing. Nature. 464, 768–772. [DOI] [PMC free article] [PubMed] [Google Scholar]
- Polyak, K. , 2007. Breast cancer: origins and evolution. J. Clin. Invest.. 117, 3155–3163. [DOI] [PMC free article] [PubMed] [Google Scholar]
- Purcell, S. , Neale, B. , Todd-Brown, K. , Thomas, L. , Ferreira, M.A. , Bender, D. , 2007. PLINK: a tool set for whole-genome association and population-based linkage analyses. Am. J. Hum. Genet.. 81, 559–575. [DOI] [PMC free article] [PubMed] [Google Scholar]
- Quigley, D. , Balmain, A. , 2009. Systems genetics analysis of cancer susceptibility: from mouse models to humans. Nat. Rev. Genet.. 10, 651–657. [DOI] [PubMed] [Google Scholar]
- Quigley, D. , To, M. , Pérez-Losada, J. , Pelorosso, F. , Mao, J. , Nagase, H. , 2009. Genetic architecture of mouse skin inflammation and tumour susceptibility. Nature. 458, 505–508. [DOI] [PMC free article] [PubMed] [Google Scholar]
- Quigley, D.A. , To, M.D. , Kim, I.J. , Lin, K.K. , Albertson, D.G. , Sjolund, 2011. Network analysis of skin tumor progression identifies a rewired genetic architecture affecting inflammation and tumor susceptibility. Genome Biol.. 12, R5 [DOI] [PMC free article] [PubMed] [Google Scholar]
- R Development Core Team, 2012. R: a Language and Environment for Statistical Computing. Vienna [Google Scholar]
- Ramasamy, A. , Trabzuni, D. , Gibbs, J.R. , Dillman, A. , Hernandez, D.G. , Arepalli, S. , 2013. Resolving the polymorphism-in-probe problem is critical for correct interpretation of expression QTL studies. Nucleic Acids Res.. 41, e88 [DOI] [PMC free article] [PubMed] [Google Scholar]
- Ritchie, M.E. , Carvalho, B.S. , Hetrick, K.N. , Tavare, S. , Irizarry, R.A. , 2009. R/bioconductor software for Illumina's Infinium whole-genome genotyping BeadChips. Bioinformatics. 25, 2621–2623. [DOI] [PMC free article] [PubMed] [Google Scholar]
- Ross-Innes, C.S. , Brown, G.D. , Carroll, J.S. , 2011. A co-ordinated interaction between CTCF and ER in breast cancer cells. BMC Genom.. 12, 593 [DOI] [PMC free article] [PubMed] [Google Scholar]
- Ruiz-Narvaez, E.A. , Rosenberg, L. , Rotimi, C.N. , Cupples, L.A. , Boggs, D.A. , Adeyemo, A. , 2010. Genetic variants on chromosome 5p12 are associated with risk of breast cancer in African American women: the Black Women's Health Study. Breast Cancer Res. Treat. 123, 525–530. [DOI] [PMC free article] [PubMed] [Google Scholar]
- Schadt, E.E. , Molony, C. , Chudin, E. , Hao, K. , Yang, X. , Lum, P.Y. , 2008. Mapping the genetic architecture of gene expression in human liver. PLoS Biol.. 6, e107 [DOI] [PMC free article] [PubMed] [Google Scholar]
- Sorlie, T. , Perou, C.M. , Tibshirani, R. , Aas, T. , Geisler, S. , Johnsen, H. , 2001. Gene expression patterns of breast carcinomas distinguish tumor subclasses with clinical implications. Proc. Natl. Acad. Sci. USA. 98, 10869–10874. [DOI] [PMC free article] [PubMed] [Google Scholar]
- Splinter, E. , Heath, H. , Kooren, J. , Palstra, R.J. , Klous, P. , Grosveld, F. , 2006. CTCF mediates long-range chromatin looping and local histone modification in the beta-globin locus. Genes Dev.. 20, 2349–2354. [DOI] [PMC free article] [PubMed] [Google Scholar]
- Stacey, S.N. , Manolescu, A. , Sulem, P. , Thorlacius, S. , Gudjonsson, S.A. , Jonsson, G.F. , 2008. Common variants on chromosome 5p12 confer susceptibility to estrogen receptor-positive breast cancer. Nat. Genet.. 40, 703–706. [DOI] [PubMed] [Google Scholar]
- Stranger, B.E. , Nica, A.C. , Forrest, M.S. , Dimas, A. , Bird, C.P. , Beazley, C. , 2007. Population genomics of human gene expression. Nat. Genet.. 39, 1217–1224. [DOI] [PMC free article] [PubMed] [Google Scholar]
- Sun, L. , Liu, Y. , Fremont, M. , Schwarz, S. , Siegmann, M. , Matthies, R. , 1998. A novel 52 kDa protein induces apoptosis and concurrently activates c-Jun N-terminal kinase 1 (JNK1) in mouse C3H10T1/2 fibroblasts. Gene. 208, 157–166. [DOI] [PubMed] [Google Scholar]
Associated Data
This section collects any data citations, data availability statements, or supplementary materials included in this article.
Supplementary Materials
The following is the supplementary data related to this article:
Supplementary Table 1 is a full list of genes with significant tumor eQTL in the discovery dataset. Supplementary Table 2 is a full list of genes with significant normal eQTL. Supplementary Table 3 lists all genes with significant correlation with MRPS30 in ER‐positive tumors. Supplementary Table 4 lists all genes with significant correlation with MRPS30 in ER‐negative tumors. Supplementary Figure 1 is a flowchart illustrating the analysis that resulted in a validated MRPS30 eQTL. Supplementary Figure 2 is a screen shot from the UCSC Genome Browser (genome.ucsc.edu) indicating the physical location of MRPS30, the three locations targeted by protein binding assays, the location of DNase clusters, and the location of relevant histone marks.