Abstract
Protein partner exchange plays a key role in regulating many biological switches. Although widespread, the mechanisms dictating protein partner identity and, therefore, the outcome of a switch have been determined for a limited number of systems. The Escherichia coli protein BirA undergoes a switch between posttranslational biotin attachment and transcription repression in response to cellular biotin demand. Moreover, the functional switch reflects formation of alternative mutually exclusive protein:protein interactions by BirA. Previous studies provided a set of alanine-substituted BirA variants with altered kinetic and equilibrium parameters of forming these interactions. In this work, DNase I footprinting measurements were employed to investigate the consequences of these altered properties for the outcome of the BirA functional switch. The results support a mechanism in which BirA availability for DNA binding and, therefore, transcription repression is controlled by the rate of the competing protein:protein interaction. However, occupancy of the transcriptional regulatory site on DNA by BirA is exquisitely tuned by the equilibrium constant governing its homodimerization.
Keywords: protein:protein interactions, biological switch, kinetic versus equilibrium control
Introduction
Protein:protein interactions in biological switches
Many biological switches including the stress response [1] and biofilm formation [2] in bacteria and inflammation [3] and development [4] in higher organisms are controlled at the level of protein: protein interactions. In each of these systems, the switch involves swapping of one protein interaction partner for another. Although many of these switches have been characterized at biological and/or structural levels, mechanistic understanding based on the kinetic and equilibrium parameters that govern the interactions is lacking. This level of understanding requires quantitative measurements of the relevant protein:protein interactions and their impact on downstream events in the switch. Results of such studies enable construction of realistic predictive models that can connect outcomes of biological switches to the physical chemistry of the contributing interactions.
Protein:protein interactions in the biotin transcriptional switch
The Escherichia coli Biotin Regulatory System provides a model for investigation of the mechanism of protein partner swapping in a transcriptional switch. The central protein in the system, BirA, functions as an essential metabolic enzyme and as a transcription repressor (Fig. 1) [6–8]. As an enzyme, the protein catalyzes posttranslational biotin addition to the biotin carboxyl carrier protein (BCCP) subunit of acetyl CoA carboxylase. BirA also functions as the transcriptional repressor of the biotin biosynthetic operon to regulate biotin production. The functional switch between biotin transfer and transcription repression is regulated by cellular demand for biotin. At rapid growth rates, in which transcription of the genes that encode acetyl CoA carboxylase is activated and the intracellular apoBCCP concentration is high, BirA functions as an enzyme [9,10]. Once cellular demand for biotin decreases, for example, during slowed growth, BirA switches to its transcription repression role. HoloBirA (BirA: biotinoyl-5′-AMP complex), the adenylate-bound form of BirA, is the active species in both biotin transfer to BCCP and transcription repression [11]. While biotin transfer requires formation of a heterodimer between holoBirA and apoBCCP, transcription repression is carried out by the holoBirA homodimer [12,13].
Fig. 1.
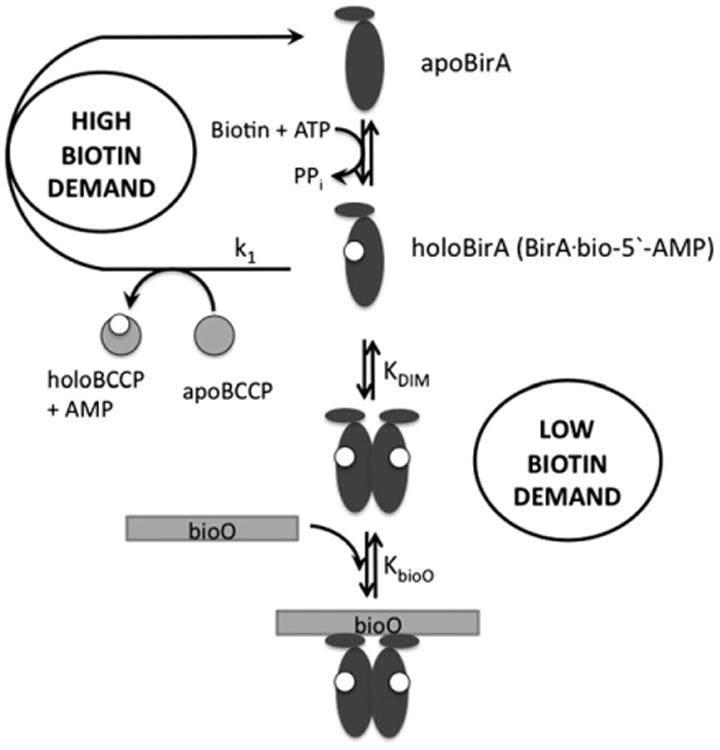
Metabolic demand for biotin controls assembly of the E. coli biotin biosynthetic operon transcription repression complex. The apoBirA monomer binds to biotin and ATP to catalyze bio-5′-AMP synthesis, forming holoBirA. In conditions of high biotin demand, holoBirA associates with apoBCCP to transfer biotin and regenerate apoBirA. Low biotin demand allows holoBirA dimerization followed by bioO binding.
Structural basis of alternative BirA functions
Structural data indicate that BirA functional switching reflects the formation of alternative, mutually exclusive protein:protein interactions (Fig. 2) [13–16]. The BirA homodimer that functions in transcription regulation is formed by side-by-side antiparallel alignment of the central domain β-sheets of each monomer to form an extended intermolecular sheet. Likewise, extension of the same central domain sheet in BirA occurs in the complex of holoBirA bound to apoBCCP, albeit through a parallel interaction. In addition to these sheet interactions, several loops are present in both interfaces (Fig. 2) and results of previous studies of alanine-substituted BirA variants indicate sensitivity of homodimerization to amino acid changes in any of these five interface loops [17,18]. By contrast, the heterodimeric interaction of holoBirA with apoBCCP is sensitive primarily to substitutions in the loops composed of residues 116–124 and 170–176 [18,19].
Fig. 2.
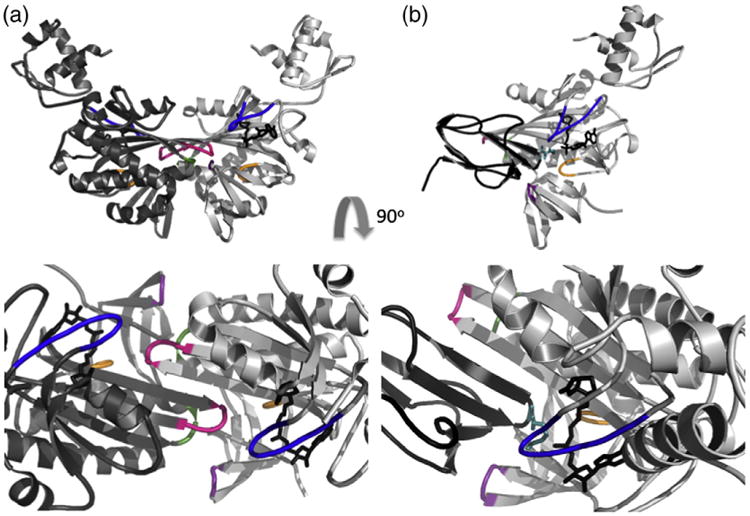
A single BirA surface is used for the BirA homodimer (left) and holoBirA:apoBCCP heterodimer (right). Rotation of the models by 90° displays their cross sections with the loops highlighted: 112–124 (blue), 140–146 (green), 170–176 (orange), 193–199 (pink), and 280–283 (purple). All figures were created using PyMOL [5] with input file 2EWN for the homodimer and a heterodimer model constructed using the holoBirA monomer coordinates from 2EWN and the apoBCCP87 coordinates from 1BDO with the experimentally determined structure of the Pyrococcus horikoshii biotin protein ligase:BCCP complex serving as a template (Protein Data Bank file 2EJG, Zachary Wood).
Protein:Protein Interactions in a Biological Switch
The functional switch between biotin transfer and transcription repression occurs by swapping of protein interaction partners by holoBirA and accumulated evidence supports a kinetic model for switch control. Combined equilibrium and kinetic measurements of repression complex assembly indicate obligatory formation of the holoBirA homodimer prior to DNA binding [20,21]. Kinetic measurements indicate that the rate of biotin transfer is controlled by the rate constant for bimolecular association of the holoBirA monomer with apoBCCP [22] or k1 in the following scheme:
| (1) |
In the presence of apoBCCP, holoBirA binding to the biotin operator (bioO) is decreased in a manner consistent with inhibition of the holoBirA dimerization step [23]. The two competing dimerization reactions are characterized by distinct bimolecular association rate constants with hetero-association estimated to be approximately 100-fold faster than homodimerization [22,24]. Thus, in a rapidly dividing cell, this difference in intrinsic rates coupled with the higher apoBCCP concentration guarantees partitioning of BirA into its enzymatic function when biotin is needed for fatty acid biosynthesis. Decreased growth rates, which are accompanied by lower apoBCCP levels, allow slow homodimerization with resulting bioO binding and transcription repression.
BirA variants with alanine substitutions in the dimer interface loops provide tools to directly test the hypothesized kinetic control of the holoBirA switch. The variants are characterized by homodimerization equilibrium constants ranging from millimolar to nanomolar, corresponding to Gibbs free energies ranging from −3 to −10 kcal/mol [18]. This range of self-association properties can be exploited to investigate the relationship of dimerization energetics to repression complex assembly and the functional switch. These same variants, which are characterized by bimolecular association rate constants with apoBCCP ranging from 20 to 17,000 M−1 s−1 [18], can be used to determine the relationship of the hetero-association rate to the switch from transcription repression to posttranslational biotin addition.
In this work, the consequences of alterations in holoBirA homo- and heterodimerization properties for repression complex assembly and the switch to biotin transfer were investigated. DNase I footprint titrations reveal that the total free energy of the two-step assembly of holoBirA on the bioO sequence tracks nearly perfectly with the dimerization free energy. Inhibition DNase I footprint titrations indicate a correlation between the rate constant for heterodimerization and the switch from transcription repression to posttranslational biotin attachment. By contrast, the magnitude of the equilibrium homodimerization energetics shows no correlation with the switching probability. The combined results support a switching mechanism in which the rate of heterodimerization with apoBCCP controls the holoBirA monomer supply and the equilibrium constant of homodimerization tunes the bioO occupancy and, consequently, transcription initiation at the biotin operon.
Results
Homodimerization energetics tune assembly of the repression complex
Previous kinetic studies of holoBirA assembly on bioO indicate a two-step process in which dimer formation precedes bioO binding. Moreover, the rapid kinetics of dimer binding to bioO DNA suggests that it acts as a “sensor” of the holoBirA dimer pool [21]. In this work, the relationship of dimerization energetics to assembly of the biotin repressor on bioO was measured using DNase I footprint titrations. Alanine replacement of the residues in four surface loops, comprising residues 140–146, 170–176, 193–199, and 280–283, yields proteins with dimerization free energies ranging from −2.4 to −10.6 kcal/mol [18]. The footprint titrations were performed to assess the extent to which these perturbations to dimerization influence both the overall assembly process and binding of the holoBirA dimer to bioO.
Since bioO binding is a two-step process (Fig. 3a), DNase I footprint titrations report on the total equilibrium constant, KTOT = KDIM*KbioO, from which the total Gibbs free energy of binding, ΔG°TOT = −RTlnKTOT, is calculated. As demonstrated in the DNase I footprint titration obtained for the G196A variant (Fig. 3b), increased occupancy of the bioO site occurs with increasing protein concentration. Analysis of the binding isotherm obtained from quantitation of the band intensities in the bioO site as a function of repressor concentration (Materials and Methods) (Fig. 3c), using Eq. (3), yields KTOT and ΔG°TOT values of 8.0 (±1.0) × 1015 M−2 and −21.2 ± 0.1 kcal/mol, respectively, values similar to those measured for wild-type holoBirA (Table 1).
Fig. 3.
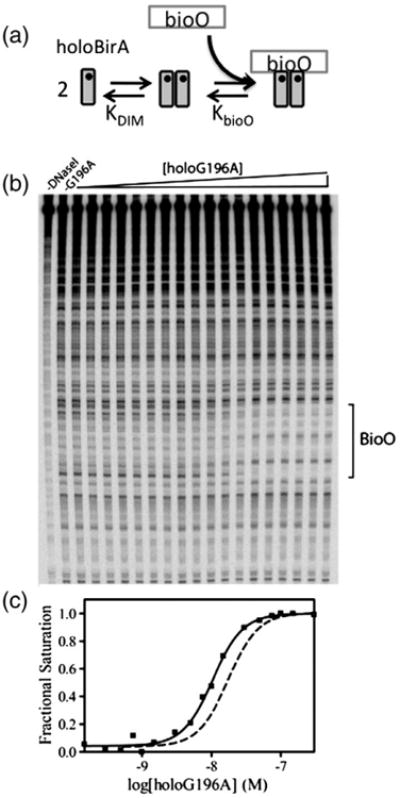
(a) Two-step assembly of holoBirA on bioO. (b) The DNase I footprint titration of bioO with BirA G196A. (c) The binding isotherm obtained from quantitation of the bioO band intensities. The continuous line represents the best-fit curve obtained from nonlinear least squares analysis of the data using Eq. (3). The isotherm obtained with wild-type BirA is shown for comparison (broken line).
Table 1. Energetic parameters for assembly of BirA variants on bioO.
| BirA variant | KTOT(M−2)a | ΔG°TOT (kcal/mol)b | ΔG°bioO (kcal/mol)c,d |
|---|---|---|---|
| Wild type | 4.0 (±2.0) × 1015 | −20.7 (±0.4) | −13.8 (±0.5) |
| E140A | 1.1 (±0.5) × 1015 | −20.0 (±0.3) | −13.7 (±0.4) |
| Q141A | 2.3 (±0.9) × 1015 | −20.5 (±0.2) | −13.1 (±0.5) |
| G142A | 3.0 (±0.8) × 1012 | −16.6 (±0.2) | −14.2 (±0.7) |
| P143A | 1.86 (±0.01) × 1014 | −19.062 (±0.002) | −13.3 (±0.2) |
| R170A | 9.0 (±4.0) × 1014 | −19.9 (±0.3) | −13.9 (±0.4) |
| V171A | 5.3 (±2.3) × 1016 | −22.3 (±0.3) | −13.5 (±0.7) |
| K172A | 7.3 (±2.1) × 1013 | −18.5 (±0.2) | −14.3 (±0.5) |
| N175A | 1.13 (±0.09) × 1015 | −20.10 (±0.05) | −14.4 (±0.2) |
| D176A | 1.2 (±0.6) × 1013 | −17.4 (±0.3) | −14.4 (±0.5) |
| G193A | 1.4 (±0.3) × 1016 | −21.6 (±0.1) | −13.1 (±0.5) |
| K194A | 2.8 (±0.1) × 1017 | −23.31 (±0.02) | −12.7 (±2.4) |
| T195A | 2.5 (±0.4) × 1014 | −19.22 (±0.08) | −13.9 (±0.2) |
| G196A | 8.0 (±1.0) × 1015 | −21.2 (±0.1) | −14.1 (±0.4) |
| D197A | 2.2 (±0.2) × 1013 | −17.81 (±0.04) | −13.3 (±0.3) |
| I280A | 1.4 (±0.4) × 1013 | −17.5 (±0.1) | −14.3 (±0.7) |
| G281A | 6.0 (±2.0) × 1014 | −19.7 (±0.2) | −14.3 (±0.3) |
| D282A | 1.15 (±0.05) × 1016 | −21.46 (±0.02) | −13.6 (±0.6) |
| K283A | 6.52 (±0.05) × 1014 | −19.789 (±0.005) | −13.2 (±0.4) |
Equilibrium constant, KTOT, was measured in standard buffer [10 mM Tris–HCl (pH 7.50 ± 0.02 at 20 °C), 200 mM KCl, 2.5 mM MgCl2, 1 mM CaCl2, 2 μg/ml sonicated calf-thymus DNA, 100 μg/ml bovine serum albumin, 50 μM biotin, and 500 μM ATP (or bio-5′-AMP)] as described in Materials and Methods.
The errors represent the standard error of two independent measurements.
ΔG°TOT = −RTlnKTOT.
ΔG°bioO = ΔG°TOT − ΔG°DIM using dimerization free energies obtained from sedimentation measurements.
The reported uncertainties in ΔG°bioO for each variant were obtained using standard error propagation methods.
Footprint titrations obtained for all 18 alanine-substituted variants yield a broad range of KTOT values from 3 × 10¹² M−2 to 3 × 10¹⁷ M−2, corresponding to total assembly free energies, ΔG°TOT, ranging from −16.6 to −23.3 kcal/mol (Table 1). This 6.7-kcal/mol span in assembly free energies is similar in magnitude to the 7.5-kcal/mol span previously reported for the dimerization free energies [18]. The calculated ΔΔG°TOT values, the differences in total assembly free energies for the variants relative to that determined for the wild-type protein (Fig. 4a), further illustrate the breadth of total assembly energetics.
Fig. 4.
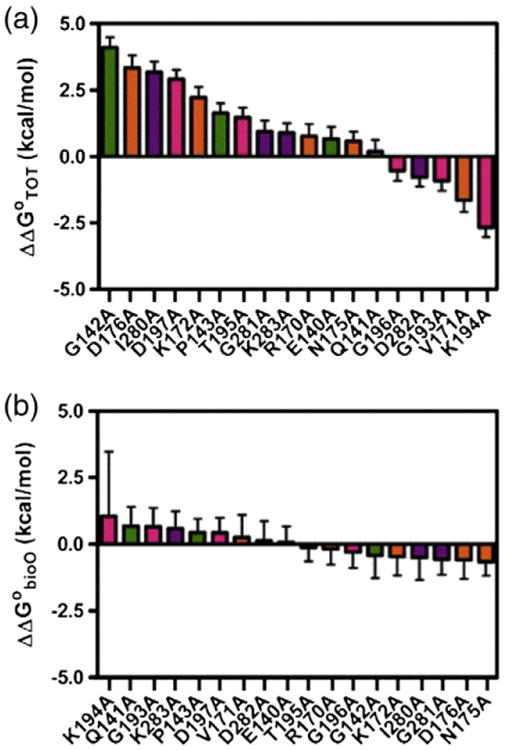
Difference in the Gibbs free energy for each variant and wild-type BirA for (a) total transcription repression complex assembly, ΔΔG°TOT, and (b) holoBirA dimer binding to bioO, ΔΔG°bioO.
HoloBirA dimer binding to BioO is insensitive to perturbations in the dimer interface
Perturbation to homodimerization free energy has no consequences for holoBirA dimer binding to bioO. Since the total equilibrium constant for two-step binding of holoBirA to bioO, KTOT, is the product of the constants for dimerization and bioO binding by the dimer, the Gibbs free energy of holoBirA dimer binding to bioO, ΔG°bioO, is calculated from the total assembly and dimerization free energies using the relationship:
| (2) |
Dimerization free energies used in these calculations were previously obtained from sedimentation equilibrium measurements [18]. All alanine variants exhibit ΔG°bioO values similar in magnitude to that measured for wild-type BirA (Table 1). The largest difference in the free energy of the dimer–bioO interaction relative to that measured for wild-type BirA, ΔΔG°bioO, is 1.1 kcal/mol (Fig. 4b). However, since this value pertains to the K194A variant, for which the equilibrium dimerization constant has a large uncertainty, [18] a similarly large uncertainty is associated with the ΔG°bioO. The ΔΔG°bioO values indicate a span of 1.7 kcal/mol, significantly narrower than the 6.7-kcal/mol span in total assembly energetics (Fig. 4b). Indeed, taking into consideration the errors associated with the ΔΔG°bioO values, most are indistinguishable from zero.
The switch from repression complex assembly to biotin transfer correlates with the holoBirA–apoBCCP association rate
The relationship between the bimolecular association rate constant for holoBirA binding to apoBCCP to functional switching was investigated using inhibition DNase I footprint titrations. Several of the surface loop alanine variants are slower than wild-type BirA in their rates of heterodimerization [18]. In the context of a kinetically controlled switch mechanism, slower rates of hetero-association should decrease switching from assembly on bioO to posttranslational biotin addition to BCCP.
Addition of apoBCCP87, a C-terminal fragment of BCCP that is kinetically equivalent to the full-length protein in BirA-catalyzed biotin transfer [25], to a DNA binding reaction results in partitioning of some fraction of the holoBirA away from repression complex assembly. This is because association of apoBCCP87 with holoBirA leads to biotin transfer with resulting production of apoBirA, a species that dimerizes very weakly (Fig. 5a) [23]. Because the dimer is an obligatory intermediate in bioO binding, this depletion of the holoBirA dimer pool decreases bioO occupancy. In the inhibition DNase I footprint titration, the dependence of the loss of the bioO footprint on apoBCCP concentration provides a measure of the switch from dimerization and DNA binding to biotin transfer. Nonlinear least squares analysis of the inhibition footprint titration data using Eq. (4) (Materials and Methods) yields the inhibition constant, KI, a quantitative measure of the apoBCCP:holoBirA interaction [23].
Fig. 5.
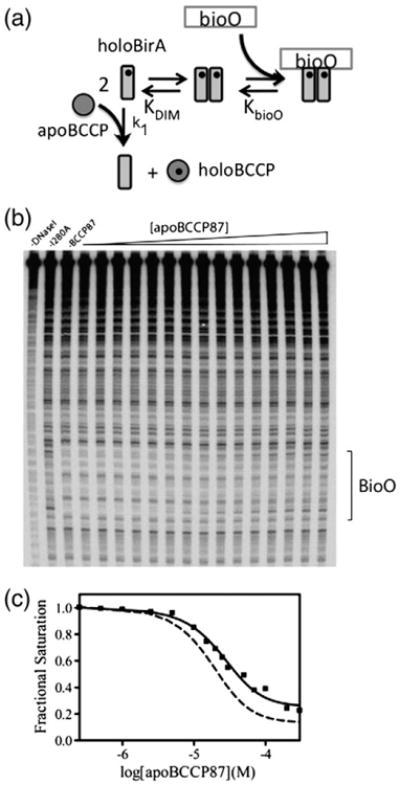
Inhibition DNase I footprint titrations. (a) ApoBCCP-mediated inhibition of the two-step assembly of holoBirA on bioO. (b) Inhibition DNase I footprint titration of bioO obtained for holoBirA I280A. (c) The inhibition isotherm obtained from quantitation of the footprint in (b). The continuous line represents the best-fit curve obtained from nonlinear least squares analysis of the data using Eq. (4). The broken line shows the inhibition footprint titration for wild-type holoBirA.
The inhibition DNase I footprint titration is performed at a total BirA concentration at which the bioO site is just saturated, a concentration at which the system is poised for inhibition by apoBCCP87. This concentration was determined for each variant from the direct DNase I footprint titrations described above. As illustrated in the inhibition titration obtained for BirAI280A (Fig. 5b), as acceptor protein concentration is increased, the bioO footprint acquired in the absence of acceptor protein is progressively lost. Analysis of the titration data yields a KI of 12 (±2) × 10−6 M, a value approximately fourfold greater than that obtained for wild-type BirA (Fig. 5c). In addition to this weaker interaction with apoBCCP, the inhibition isotherm obtained with the I280A variant exhibits a lower asymptote of the curve at the highest apoBCCP87 concentrations that is larger than that for wild-type holoBirA. However, as previously described [23], the magnitude of this lower asymptote depends on the total holoBirA concentration employed, with higher concentrations yielding larger lower plateau values. Because of its weak dimerization, the I280A concentration used in this experiment was 1 μM, significantly higher than the 7.5 × 10⁻⁸ M concentration employed for wild-type BirA.
Inhibition DNase I footprint titrations carried out with the 18 alanine-substituted BirA variants, which are all well described by the inhibition model [Eq. (4)], yield a range of KI values (Table 2). Assuming that the inhibition constant is an indicator of the strength of the holoBirA:apoBCCP interaction for each protein, apparent interaction free energies were calculated using the expression ΔGI = RTlnKI. Relative to wild-type holoBirA, several of the variants including G142A, K172A, D176A, K194A, and G196A are altered in their apparent free energies of interaction with apoBCCP by 1 kcal/mol or more.
Table 2. Parameters for inhibition of BirA variant assembly on bioO.
| BirA variant | KI (M)a | ΔG°I(kcal/mol)b,c |
|---|---|---|
| Wild type | 2.8 (±0.9) × 10−6 | −7.4 (±0.2) |
| E140A | 4.0 (±1.0) × 10−6 | −7.3 (±0.2) |
| Q141A | 4.0 (±1.0) × 10−6 | −7.3 (±0.2) |
| G142A | 15 (±5) × 10−6 | −6.5 (±0.2) |
| P143A | 7.0 (±1.0) × 10−6 | −6.9 (±0.1) |
| R170A | 3.8 (±0.2) × 10−6 | −7.24 (±0.02) |
| V171A | 9.0 (±2.0) × 10−6 | −6.8 (±0.1) |
| K172A | 20 (±0.7) × 10−6 | −6.21 (±0.02) |
| N175A | 4.0 (±0.4) × 10−6 | −7.2 (±0.1) |
| D176A | 200 (±1) × 10−6 | −5.022 (±0.003) |
| G193A | 5.0 (±0.5) × 10−6 | −7.1 (±0.1) |
| K194A | 15 (±0.4) × 10−6 | −6.44 (±0.02) |
| T195A | 9.0 (±1.0) × 10−6 | −6.8 (±0.1) |
| G196A | 22 (±5.0) × 10−6 | −6.2 (±0.1) |
| D197A | 9.0 (±0.1) × 10−6 | −6.735 (±0.005) |
| I280A | 12 (±2) × 10−6 | −6.6 (±0.1) |
| G281A | 6.0 (±0.8) × 10−6 | −6.9 (±0.1) |
| D282A | 4.0 (±1.0) × 10−6 | −7.3 (±0.2) |
| K283A | 4.85 (±0.02) × 10−6 | −7.09 (±0.03) |
The inhibition constants and Gibbs free energies were determined as described in Materials and Methods.
Nonlinear least squares analysis of each inhibition isotherm yielded KA,I from which the inverse, KI, was calculated. The errors represent the standard error of two independent experiments.
ΔG°I values were calculated using the equation ΔG°I = RTlnKI.
The reported uncertainties for each variant represent the standard error of two independent experiments.
Combined kinetic measurements and inhibition DNase I footprint titrations reveal that rates of biotin transfer to apoBCCP87, which is controlled by the rate of heterodimerization, correlate with the switch (Fig. 6) [22]. This is evident in comparing the ΔlnKI and Δlnk1, the differences in the natural logarithm of the inhibition constant and rate constants of heterodimerization values of the variants and wild-type BirA (Fig. 6a and b). Variants with larger ΔlnKI values including G142A, K172A, D176A, K194A, and G196A also exhibit the largest perturbations to lnk1.
Fig. 6.
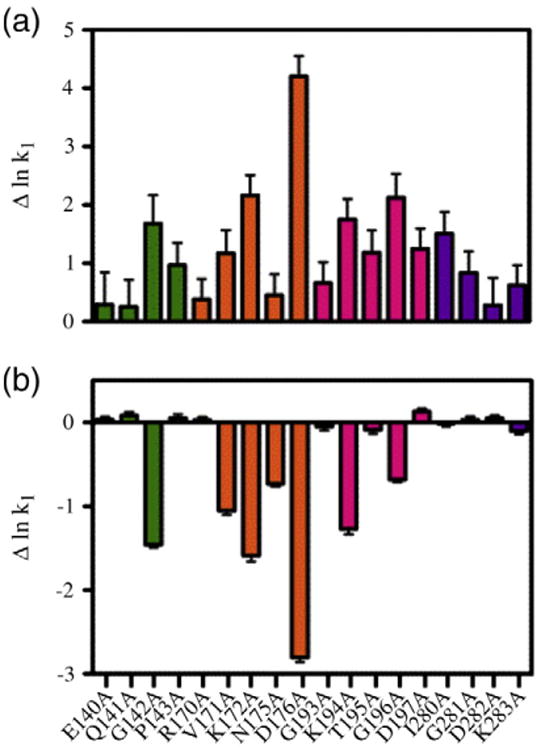
BCCP inhibition of repression complex assembly tracks with its rate of hetero-association with the holoBirA variant. (a) The difference in inhibition constant for each variant from that measured for wild-type BirA: ΔlnKI = lnKI(variant) − lnKI(wt). (b) The difference in bimolecular association rate constant for each variant with apoBCCP from that measured for wild-type BirA: Δlnk1 = Δlnk1(variant) − lnk1(wt). The k1 values were previously reported [18]. In both graphs, a logarithmic scale is used because of its direct relationship to energy. The errors for (a) were calculated using standard error propagation. The errors in (b) represent the standard error of two independent experiments.
Discussion
Protein:protein interactions in control of repression complex assembly
DNase I footprint titrations performed on the alanine-substituted variants in the interface loops indicate nearly perfect correlation between the total free energy of holoBirA assembly and the homodimerization energetics. A correlation analysis of the dependence of the total Gibbs free energy of assembly, ΔG°TOT, on the Gibbs free energy of dimerization, ΔG°DIM, yields a coefficient of 0.9556 (Fig. 7a). Thus, for this set of BirA variants, the dimerization free energy tunes the energetics of assembly of the transcription repression complex.
Fig. 7.
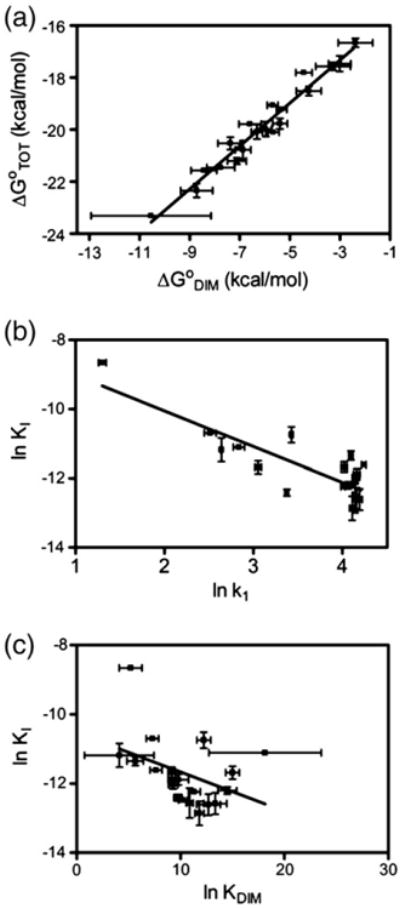
Relationship of holoBirA protein interactions to repression complex assembly and the holoBirA switch. Correlation analysis for (a) ΔG°TOT versus ΔG°DIM (r2 = 0.9556), (b) lnKI versus lnk1 (r2 = 0.7190), and (c) lnKI versus lnKDIM (r2 = 0.1702). The error bars for lnKI and lnKDIM are the standard errors from at least two independent measurements of KI and KDIM, and those in lnk1 were obtained from the analysis of kinetic data as described by Adikaram and Beckett [18].
The nearly perfect correlation between homodimerization and total assembly energetics indicates that holoBirA dimer binding to bioO is completely insensitive to dimer interface perturbations. This insensitivity has at least two possible origins. The first is that, despite the location of the altered residues in flexible loops in the dimer interface, only minor structural perturbations accompany the alanine substitutions (Fig. 8). Unfortunately, the structures of the alanine-substituted variants cannot be modeled using, for example, Rosetta Backrub,† which incorporates backbone flexibility into prediction of a protein interface structure, because the modeling methods cannot handle the adenylate ligand [26–28]. However, the distinct energetic effects of −3.8 and +2.3 kcal/ mol accompanying alanine replacements of the two neighboring charged residues, K194 and D197 (Fig. 8), respectively, are difficult to rationalize without invoking contributions beyond loss of a single electrostatic interaction for each. Ongoing x-ray crystallographic studies of the variants will reveal the structural consequences of the alanine substitutions. An alternative explanation for the insensitivity of bioO binding to dimer interface perturbation lies in the ability of the winged helix–turn–helix DNA binding domain to move relative to the central domain of BirA. Alignment of the unliganded, biotin-bound and adenylate-bound BirA structures reveals a variation of over 19° in the relative positions of the two domains [29]. This flexibility may be critical for the DNA binding mechanism. The BirA dimer binds to 40 base pairs of DNA and detailed chemical and DNase I footprints are consistent with a structure of the complex in which each monomer contacts approximately 12 base pairs at each terminus of the operator sequence with the center lacking any protein contacts [30]. The recently published SAXS-derived structure of the complex of Staphylococcus aureus holoBirA bound to its operator confirms this model [16]. Both the center of the operator sequence and the segments that contact each of the DNA binding domains undergo distortion upon binding to holoBirA. The flexible linkage of the DNA binding and dimerization domains in BirA may facilitate accommodation of the protein to the DNA.
Fig. 8.
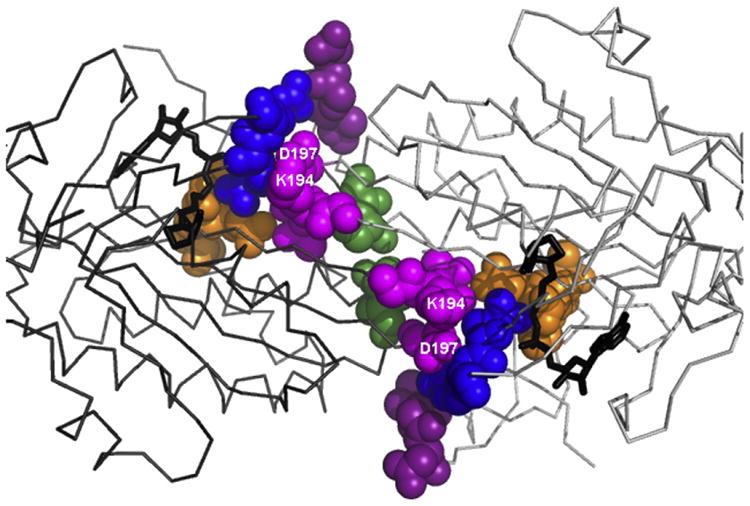
Amino acid positions in the holoBirA dimer interface at which amino acid substitutions are accompanied by a ≥1 kcal/mol change in the absolute value of the dimerization free energy. The color coding is identical with that used for the interface loops in Fig. 2a. The model was prepared in PyMOL [5] using Protein Data Bank file 2EWN as input. Please refer to the text for discussion of side chains K194 and D197.
The bimolecular association of holoBirA with apoBCCP controls inhibition of bioO occupancy
The close relationship of the heterodimerization kinetics to the BirA functional switch is illustrated in correlation analysis. Linear regression of the dependence of the lnKI on lnk1 yields a correlation coefficient of 0.7190 (Fig. 7b), indicating the significance of the heterodimerization rate for the ability of a variant to drive holoBirA from homodimerization and assembly on bioO to biotin transfer to apoBCCP. By contrast, tracking of the inhibition constant with equilibrium constant for homodimerization yields a correlation coefficient of 0.1702 (Fig. 7c), indicating little influence of the strength of homodimerization reaction on the switch. This does not, however, preclude a role for the homodimer association rate in controlling holoBirA function. In fact, in any kinetic partitioning process, it is the relative magnitude of the rates of the competing steps that determines the outcome. The less than perfect correlation between the measured inhibition constants and the hetero-association rates may reflect variations in the magnitudes of the bimolecular association rates governing formation of the variant homodimers.
Combined kinetic and equilibrium control of the outcome of the biotin regulatory switch
In combination, the results of direct and indirect DNase I footprinting titrations reveal the central role of protein: protein interactions in determining the outcome of the biotin regulatory switch. The correlation between the magnitude of the bimolecular rate constant for association of holoBirA with apoBCCP and the effect of acceptor protein on bioO occupancy by holoBirA indicates the importance of the heterodimerization kinetics in controlling partitioning of BirA between its two distinct functions. This kinetic control limits the availability of holoBirA for dimerization and bioO binding. The excellent correlation between the total repression complex assembly and equilibrium dimerization energetics for the BirA variants indicates that at any single repressor concentration, bioO occupancy is tuned by the extent of self-association, which is dictated by the equilibrium dimerization constant and holoBirA monomer concentration. This “tuning” is consistent with the previous indications from kinetic measurements that the bioO DNA serves as a “sensor” of the holoBirA dimer population [21]. Thus, while apoBCCP limits the holoBirA supply through the rate at which it binds to holoBirA, bioO occupancy, and thus transcription initiation, is dictated by a combination of this supply and the homodimerization energetics [31]. Finally, results of previous kinetic and equilibrium measurements of hetero- and homodimerization of the BirA variants coupled with the results presented in the present work illustrate the importance of quantitative studies in determining the mechanism of control of complex regulatory biology.
Materials and Methods
Chemicals and biochemicals
All chemicals were at least reagent grade. The DNase I was purchased from Sigma-Aldrich. The OneTaq HotStart DNA Polymerase and T4 Polynucleotide Kinase were purchased from New England Biolabs. The γ-32P-ATP (specific activity, 6000 Ci/mmol) used for labeling DNA was obtained from Perkin Elmer and the dNTPs were purchased from Promega. Biotin and ATP were purchased from Sigma-Aldrich and stock solutions were prepared as previously described [18] and the biotinoyl-5′-adenylate (bio-5′-AMP) was synthesized and purified as previously described [32,33].
Expression and purification of BirA variants
Mutations in the BirA coding sequences were introduced using the QuikChange II XL Site-Directed Mutagenesis Kit (Stratagene) in the pBTac2 plasmid, which contains the BirA coding sequence under transcriptional control of the tac promoter. The variant proteins, which were produced with a carboxyl terminal (His)6 tag to enable separation of the variant from the chromosomally encoded wild-type protein, were purified as previously described [18,34]. Each purified protein was dialyzed against storage buffer [10 mM Tris–HCl (pH 7.50 ± 0.02 at 4 °C), 200 mM KCl, 0.1 mM dithiothreitol, and 5% (v/v) glycerol] and stored at −70 °C. Protein concentrations were determined spectrophotometrically at 280 nm using the extinction coefficient of 47,510 M−1 cm−1, calculated from the amino acid composition [35]. The proteins were >95% pure as assessed by SDS-PAGE analysis, and >90% active in bio-5′-AMP binding, as determined by stoichiometric titrations monitored using steady-state fluorescence emission spectroscopy [33].
Preparation of bioO DNA for DNase I footprinting
End labeling of the DNA for footprinting measurements was accomplished by polymerase chain reaction amplification of a fragment in which one of the primers was 32P - labeled. Two primers (HindIIIpBioZ: GCCTGACTGCGTTAGCAATTTAAC; PstIpBioZ: GGAAGCTAGAGTAAGTAGTTCGCC) were designed to flank the HindIII and PstI restriction sites of plasmid pBioZ [33,36]. First, the HindIIIpBioZ primer (4 μM) was radiolabeled using γ-32P ATP (0.8 μM) with T4 polynucleotide kinase. The labeling reaction, which also contained 10× kinase buffer and unlabeled ATP (0.8 μM), was allowed to proceed for 30 min at 37 °C, and then quenched with the addition of 10 μl of formamide dye [80% deionized formamide, 1× TBE (Tris–borate–ethylenediaminetetraacetic acid) buffer, 0.02% (w/v) bromophenol blue, and 0.02% xylene cyanol (w/v)]. The resulting sample was incubated at 95 °C for 3 min [36] and the labeled DNA was separated from unincorporated nucleotides by electrophoresis on a 20% denaturing polyacrylamide gel (29:1 acrylamide/bisacrylamide in 8 M urea) at 300 V. The labeled oligonucleotide was removed from the gel by electro-elution, purified through an Elutip-D column (Schleicher & Schuell), and concentrated by ethanol precipitation [36]. The PCR for production of the labeled DNA fragment contained 1 nM pBioZ plasmid, 100–150 nM of each of the two primers, 200 μM deoxynucleotide triphosphates, and 0.05 U of Taq DNA Polymerase in reaction buffer in a total volume of 50 μl. The PCR cycle included one step at 95 °C for 2 min, followed by 30 steps of 95 °C for 1 min, 54 °C for 1 min, and 72 °C for 1 min, and a final 72 °C extension step for 5 min. The PCR product was separated from template and primers by electrophoresis on a 1% agarose gel. After locating the band by phosphorimaging, the DNA was electro-eluted from the gel, purified through an Elutip-D column, and concentrated by ethanol precipitation. The final labeled DNA was stored in TE buffer at a final concentration of ≤20,000 cpm/μl at 4 °C for up to 1 month.
DNase I footprint titrations
Direct DNase I footprint titrations
The DNase I footprinting reactions were performed as described in Refs. [33,37], with a few modifications. The labeled DNA at a final concentration of 60 pM was combined with BirA protein, wild type or variant, at a range of concentrations in binding buffer containing 10 mM Tris–HCl (pH 7.5 at 20 °C), 200 mM KCl, 2.5 mM MgCl2, 1 mM CaCl2, 2 μg/ml sonicated calf-thymus DNA, 100 μg/ml bovine serum biotin, and 500 μM ATP (or bio-5′-AMP at twice the highest final BirA concentration for those variants incapable of bio-5′-AMP synthesis). After incubating at 20 °C for at least 45 min, DNA cleavage was initiated by the addition of 5 μl of DNase I (diluted to 0.0028 mg/ml in binding buffer minus the ligands, calf-thymus DNA, and bovine serum albumin), the sample was mixed by gently vortexing, and cleavage was allowed to proceed for 2 min. The reaction was quenched by addition of 33 μl of 50 mM Na2EDTA, the sample was rapidly vortexed, and the DNA was precipitated by addition of 700 μl of solution containing 0.4 M NH4OAc and 50 μg/ml yeast phenylalanyl tRNA in ethanol. After a 20-min incubation in a dry ice/ethanol bath, the DNA was pelleted by centrifugation at 13,000 rpm for 20 min and the resulting pellets were washed with 80% ethanol twice. The dried pellets were resuspended in 7 μl of formamide dye [80% deionized formamide, 1× TBE buffer, 0.02% (w/v) bromophenol blue, and 0.02% xylene cyanol (w/v)], and samples were heated to 90 °C for 10 min, quick cooled on ice, loaded onto a 10% denaturing polyacrylamide gel (19:1 acrylamide/bisacrylamide in 8 M urea), and electrophoresed at 93 W. The gel was dried and exposed to a phosphorimager screen for at least 36 h prior to scanning using a STORM phosphorimaging system (Perkin Elmer).
Inhibition DNase I footprint titrations
Inhibition DNase I footprinting titrations, a modification of standard quantitative DNase I footprint titrations, were performed as previously described [23,37]. The holoBirA concentration used in each titration, which was determined from direct DNase I footprint titrations, is the concentration at which the bioO is just saturated by a particular holoBirA variant [18]. Reactions were prepared in binding buffer containing 10 mM Tris–HCl (pH 7.5 at 20 °C), 200 mM KCl, 2.5 mM MgCl2, 1 mM CaCl2, 2 μg/ml sonicated calf-thymus DNA, 100 μg/ml bovine serum albumin, 50 μM biotin, and 500 μM ATP, or, for variants that are incapable of adenylate synthesis, bio-5′-AMP at twice the total BirA concentration. Each titration reaction contained approximately 10,000 cpm of radiolabeled DNA and varying apoBCCP87 concentrations in a total reaction volume of 45 μl. These samples, plus a sample of wild-type or variant BirA at 10× the final desired concentration, were preincubated at 20 °C for at least 45 min. Binding reactions were initiated by addition of 5 μl of holoBirA to a tube containing BCCP87 and operator DNA. After mixing by gentle vortexing, the sample was incubated at 20 °C for 80 s at which time bioO occupancy was probed by addition of 5 μl of DNase I (diluted to 0.003 mg/ml in binding buffer minus the ligands, calf-thymus DNA, and bovine serum albumin). After 30 s, the cleavage reaction was quenched by addition of 33 μl of a 50 mM Na2EDTA solution, the sample was rapidly vortexed, and the DNA was precipitated by addition of 700 μl of solution containing 0.4 M NH4OAc and 50 μg/ml yeast phenylalanyl tRNA in ethanol. All remaining steps were identical with those outlined in the previous section for direct footprint titrations.
Data analysis
For all footprinting images, the intensities of the DNA bands in the bioO site were quantified relative to a standard band outside of the site (ImageQuant). The optical densities were used to calculate the fractional saturation of bioO, at each holoBirA concentration [37], and the resulting binding isotherms were subjected to nonlinear least square analysis (GraphPad Prism 4.0), using the following equation:
| (3) |
to obtain values for KTOT, the equilibrium constant governing combined repressor dimerization and dimer binding to bioO for each variant. The Gibbs free energies for total assembly and holoBirA dimer binding to bioO were calculated as described in Results.
Inhibition footprinting images were processed as described for the direct titrations above and resulting optical density information was used to produce binding isotherms [37] that were subjected to nonlinear least squares analysis (GraphPad Prism 4.0), using the following equation [23]:
| (4) |
in which KTOT, the total equilibrium constant governing the two-step assembly of holoBirA with bioO, is the product of the equilibrium association constant for dimerization and the association constant for dimer binding to bioO. In the analysis, its value for each variant is fixed at the experimentally obtained value obtained from DNase I footprint titrations. The [holoBirA] and [apoBCCP] refer to the total concentrations of those two proteins in monomer units. The constant Ka,I, the inhibition association constant governing the interaction between holoBirA and apoBCCP, is obtained from the analysis, and its inverse, the inhibition dissociation constant, KI, is reported in Results.
Acknowledgments
This work was supported in part by National Institutes of Health Grant R01GM46511 to D.B.
Abbreviations used
- bio-5′-AMP
biotinoyl-5′-adenylate
- bioO
biotin operator
- BCCP
biotin carboxyl carrier protein
- BCCP87
C-terminal fragment of BCCP
- holoBirA
BirA:biotinoyl-5′-AMP complex
Footnotes
References
- 1.Herrou J, Rotskoff G, Luo Y, Roux B, Crosson S. Structural basis of a protein partner switch that regulates the general stress response of alpha-proteobacteria. Proc Natl Acad Sci USA. 2012;109:1415–23. doi: 10.1073/pnas.1116887109. [DOI] [PMC free article] [PubMed] [Google Scholar]
- 2.Newman JA, Rodrigues C, Lewis RJ. Molecular basis of the activity of sinr protein, the master regulator of biofilm formation in Bacillus subtilis. J Biol Chem. 2013;288:10766–78. doi: 10.1074/jbc.M113.455592. [DOI] [PMC free article] [PubMed] [Google Scholar]
- 3.Hailey KL, Capraro DT, Barkho S, Jennings PA. Allosteric switching of agonist/antagonist activity by a single point mutation in the interluekin-1 receptor antagonist, IL-1Ra. J Mol Biol. 2013;425:2382–92. doi: 10.1016/j.jmb.2013.03.016. [DOI] [PMC free article] [PubMed] [Google Scholar]
- 4.Aksoy I, Jauch R, Chen J, Dyla M, Divakar U, Bogu GK, et al. Oct4 switches partnering from Sox2 to Sox17 to reinterpret the enhancer code and specify endoderm. EMBO J. 2013;32:938–53. doi: 10.1038/emboj.2013.31. [DOI] [PMC free article] [PubMed] [Google Scholar]
- 5.DeLano WL. The PyMOL Molecular Graphics System, Version 1.2r3pre. Schrödinger, LLC; 2002. [Google Scholar]
- 6.Barker DF, Campbell AM. The birA gene of Escherichia coli encodes a biotin holoenzyme synthetase. J Mol Biol. 1981;146:451–67. doi: 10.1016/0022-2836(81)90042-5. [DOI] [PubMed] [Google Scholar]
- 7.Barker DF, Campbell AM. Genetic and biochemical characterization of the birA gene and its product: evidence for a direct role of biotin holoenzyme synthetase in repression of the biotin operon in Escherichia coli. J Mol Biol. 1981;146:469–92. doi: 10.1016/0022-2836(81)90043-7. [DOI] [PubMed] [Google Scholar]
- 8.Cronan JE., Jr The E. coli bio operon: transcriptional repression by an essential protein modification enzyme. Cell. 1989;58:427–9. doi: 10.1016/0092-8674(89)90421-2. [DOI] [PubMed] [Google Scholar]
- 9.Li SJ, Cronan JE., Jr Growth rate regulation of Escherichia coli acetyl coenzyme A carboxylase, which catalyzes the first committed step of lipid biosynthesis. J Bacteriol. 1993;175:332–40. doi: 10.1128/jb.175.2.332-340.1993. [DOI] [PMC free article] [PubMed] [Google Scholar]
- 10.Cronan JE., Jr Expression of the biotin biosynthetic operon of Escherichia coli is regulated by the rate of protein biotination. J Biol Chem. 1988;263:10332–6. [PubMed] [Google Scholar]
- 11.Prakash O, Eisenberg MA. Biotinyl 5′-adenylate: corepressor role in the regulation of the biotin genes of Escherichia coli K-12. Proc Natl Acad Sci USA. 1979;76:5592–5. doi: 10.1073/pnas.76.11.5592. [DOI] [PMC free article] [PubMed] [Google Scholar]
- 12.Eisenstein E, Beckett D. Dimerization of the Escherichia coli biotin repressor:corepressor function in protein assembly. Biochemistry. 1999;38:13077–84. doi: 10.1021/bi991241q. [DOI] [PubMed] [Google Scholar]
- 13.Weaver LH, Kwon K, Beckett D, Matthews BW. Competing protein:protein interactions are proposed to control the biological switch of the E coli biotin repressor. Protein Sci. 2001;10:2618–22. doi: 10.1110/ps.32701. [DOI] [PMC free article] [PubMed] [Google Scholar]
- 14.Weaver LH, Kwon K, Beckett D, Matthews BW. Corepressor-induced organization and assembly of the biotin repressor:a model for allosteric activation of a transcriptional regulator. Proc Natl Acad Sci USA. 2001;98:6045–50. doi: 10.1073/pnas.111128198. [DOI] [PMC free article] [PubMed] [Google Scholar]
- 15.Bagautdinov B, Matsuura Y, Bagautdinova S, Kunishima N. Protein biotinylation visualized by a complex structure of biotin protein ligase with a substrate. J Biol Chem. 2008;283:14739–50. doi: 10.1074/jbc.M709116200. [DOI] [PubMed] [Google Scholar]
- 16.Pendini NR, Yap MY, Polyak SW, Cowieson NP, Abell A, Booker GW, et al. Structural characterization of Staphylococcus aureus biotin protein ligase and interaction partners: an antibiotic target. Protein Sci. 2013;22:762–73. doi: 10.1002/pro.2262. [DOI] [PMC free article] [PubMed] [Google Scholar]
- 17.Kwon K, Streaker ED, Ruparelia S, Beckett D. Multiple disordered loops function in corepressor-induced dimerization of the biotin repressor. J Mol Biol. 2000;304:821–33. doi: 10.1006/jmbi.2000.4249. [DOI] [PubMed] [Google Scholar]
- 18.Adikaram PR, Beckett D. Functional versatility of a single protein surface in two protein:protein interactions. J Mol Biol. 2012;419:223–33. doi: 10.1016/j.jmb.2012.03.010. [DOI] [PMC free article] [PubMed] [Google Scholar]
- 19.Zhao H, Naganathan S, Beckett D. Thermodynamic and structural investigation of bispecificity in protein–protein interactions. J Mol Biol. 2009;389:336–48. doi: 10.1016/j.jmb.2009.04.009. [DOI] [PMC free article] [PubMed] [Google Scholar]
- 20.Streaker ED, Gupta A, Beckett D. The biotin repressor: thermodynamic coupling of corepressor binding, protein assembly, and sequence-specific DNA binding. Biochemistry. 2002;41:14263–71. doi: 10.1021/bi0203839. [DOI] [PubMed] [Google Scholar]
- 21.Streaker ED, Beckett D. Coupling of protein assembly and DNA binding:biotin repressor dimerization preceeds biotin operator binding. J Mol Biol. 2003;325:937–48. doi: 10.1016/s0022-2836(02)01308-6. [DOI] [PubMed] [Google Scholar]
- 22.Ingaramo M, Beckett D. Biotinylation, a post-translational modification controlled by the rate of protein–protein association. J Biol Chem. 2011;286:13071–8. doi: 10.1074/jbc.M110.183624. [DOI] [PMC free article] [PubMed] [Google Scholar]
- 23.Streaker ED, Beckett D. The biotin regulatory system: kinetic control of a transcriptional switch. Biochemistry. 2006;45:6417–25. doi: 10.1021/bi052599r. [DOI] [PubMed] [Google Scholar]
- 24.Zhao H, Beckett D. Kinetic partitioning between alternative protein–protein interactions controls a transcriptional switch. J Mol Biol. 2008;380:223–36. doi: 10.1016/j.jmb.2008.04.068. [DOI] [PMC free article] [PubMed] [Google Scholar]
- 25.Nenortas E, Beckett D. Purification and characterization of intact and truncated forms of the Escherichia coli biotin carboxyl carrier subunit of acetyl-CoA carboxylase. J Biol Chem. 1996;271:7559–67. doi: 10.1074/jbc.271.13.7559. [DOI] [PubMed] [Google Scholar]
- 26.Davis IW, Arendall WB, 3rd, Richardson DC, Richardson JS. The backrub motion: how protein backbone shrugs when a sidechain dances. Structure. 2006;14:265–74. doi: 10.1016/j.str.2005.10.007. [DOI] [PubMed] [Google Scholar]
- 27.Smith CA, Kortemme T. Backrub-like backbone simulation recapitulates natural protein conformational variability and improves mutant side-chain prediction. J Mol Biol. 2008;380:742–56. doi: 10.1016/j.jmb.2008.05.023. [DOI] [PMC free article] [PubMed] [Google Scholar]
- 28.Lauck F, Smith CA, Friedland GF, Humphris EL, Kortemme T. RosettaBackrub—a web server for flexible backbone protein structure modeling and design. Nucleic Acids Res. 2010;38:W569–75. doi: 10.1093/nar/gkq369. [DOI] [PMC free article] [PubMed] [Google Scholar]
- 29.Wood Z, Weaver LH, Brown PH, Beckett D, Matthews BW. Co-repressor induced order and biotin repressor dimerization: a case for divergent followed by convergent evolution. J Mol Biol. 2006;357:509–23. doi: 10.1016/j.jmb.2005.12.066. [DOI] [PubMed] [Google Scholar]
- 30.Streaker ED, Beckett D. A map of the biotin repressor–biotin operator interface: binding of a winged helix–turn–helix protein dimer to a forty base-pair site. J Mol Biol. 1998;278:787–800. doi: 10.1006/jmbi.1998.1733. [DOI] [PubMed] [Google Scholar]
- 31.Tungtur S, Skinner H, Zhan H, Swint-Kruse L, Beckett D. In vivo tests of thermodynamic models of transcription repressor function. Biophys Chem. 2011;159:142–51. doi: 10.1016/j.bpc.2011.06.005. [DOI] [PMC free article] [PubMed] [Google Scholar]
- 32.Lane MD, Rominger KL, Young DL, Lynen F. The enzymatic synthesis of holotranscarboxylase from apotranscarboxylase and (+)-biotin. J Biol Chem. 1964;239:2865–71. [PubMed] [Google Scholar]
- 33.Abbott J, Beckett D. Cooperative binding of the Escherichia coli repressor of biotin biosynthesis to the biotin operator sequence. Biochemistry. 1993;32:9649–56. doi: 10.1021/bi00088a017. [DOI] [PubMed] [Google Scholar]
- 34.Naganathan S, Beckett D. Nucleation of an allosteric response via ligand-induced loop folding. J Mol Biol. 2007;373:96–111. doi: 10.1016/j.jmb.2007.07.020. [DOI] [PMC free article] [PubMed] [Google Scholar]
- 35.Gill SC, von Hippel PH. Calculation of protein extinction coefficients from amino acid sequence data. Anal Biochem. 1989;182:319–26. doi: 10.1016/0003-2697(89)90602-7. [DOI] [PubMed] [Google Scholar]
- 36.Iannello RC. DNase I footprinting using PCR-generated end-labeled DNA probes. Methods Mol Biol. 1995;37:379–91. doi: 10.1385/0-89603-288-4:379. [DOI] [PubMed] [Google Scholar]
- 37.Brenowitz M, Senear DF, Shea MA, Ackers GK. Quantitative DNase footprint titration: a method for studying protein–DNA interactions. Methods Enzymol. 1986;130:132–81. doi: 10.1016/0076-6879(86)30011-9. [DOI] [PubMed] [Google Scholar]


