Our understanding of the interactions leading to high affinity binding between RNA aptamers and their target protein lag significantly behind advancements in aptamer-based diagnostics and therapeutics. This study investigates the function and 2.0-Å cocrystal structure of a methodically minimized RNA aptamer that targets hen egg white lysozyme with nanomolar affinity. The analyses reveal a novel minimalist protein–nucleic acid interface featuring a single Na+ ion stabilizing the protein-binding platform, an unusually small electrostatic component to the total free binding energy, and a surprising mode of inhibition by an RNA aptamer.
Keywords: aptamer, footprinting, crystal structure, lysozyme, inhibition, catalysis
Abstract
RNA aptamers are being developed as inhibitors of macromolecular and cellular function, diagnostic tools, and potential therapeutics. Our understanding of the physical nature of this emerging class of nucleic acid–protein complexes is limited; few atomic resolution structures have been reported for aptamers bound to their protein target. Guided by chemical mapping, we systematically minimized an RNA aptamer (Lys1) selected against hen egg white lysozyme. The resultant 59-nucleotide compact aptamer (Lys1.2minE) retains nanomolar binding affinity and the ability to inhibit lysozyme's catalytic activity. Our 2.0-Å crystal structure of the aptamer–protein complex reveals a helical stem stabilizing two loops to form a protein binding platform that binds lysozyme distal to the catalytic cleft. This structure along with complementary solution analyses illuminate a novel protein–nucleic acid interface; (1) only 410 Å2 of solvent accessible surface are buried by aptamer binding; (2) an unusually small fraction (∼18%) of the RNA-protein interaction is electrostatic, consistent with the limited protein phosphate backbone contacts observed in the structure; (3) a single Na+ stabilizes the loops that constitute the protein-binding platform, and consistent with this observation, Lys1.2minE–lysozyme complex formation takes up rather than displaces cations at low ionic strength; (4) Lys1.2minE inhibits catalysis of large cell wall substrates but not catalysis of small model substrates; and (5) the helical stem of Lys1.2minE can be shortened to four base pairs (Lys1.2minF) without compromising binding affinity, yielding a 45-nucleotide aptamer whose structure may be an adaptable protein binding platform.
INTRODUCTION
RNA aptamers are structured single-stranded oligonucleotides selected to specifically bind to a broad spectrum of biomolecular targets with nM to pM affinity (Jayasena 1999; Bunka and Stockley 2006; Keefe et al. 2010). The structural stability and binding specificity of aptamers are conducive to their use as binding and catalytic inhibitors, diagnostic tools, and potential therapeutic agents (Lee et al. 2005; Pestourie et al. 2005). Aptamers are particularly attractive as therapeutics since they are not immunogenic, can be chemically synthesized and are amenable to chemical modifications (Kusser 2000). Target-specific aptamers are created through SELEX (Hall et al. 2009; Piasecki et al. 2009) against many types of targets, ranging from small organic molecules like neomycin (Cowan et al. 2000), viral peptides like HIV-1 Rev (Ye et al. 1999), to large macromolecules such as thrombin (Macaya et al. 1993). Of the hundred odd aptamer structures that have been deposited into the PDB, only six are protein–RNA aptamer complexes,2 and only three of these represent proteins that do not natively bind nucleic acids. Clearly our understanding of how aptamers recognize and bind to specific regions on the surface of proteins, the nature and range of their structural folds, and the mechanism by which they inhibit function lag behind advances in their applications.
Atomic resolution structures of aptamers and aptamer–protein complexes have been determined by both X-ray diffraction and nuclear magnetic resonance (NMR) spectroscopy. Although each technique has its strengths and challenges (Lukavsky 2005; Tzakos et al. 2006; Obayashi et al. 2007), the success rate of either approach increases with decreasing aptamer size and flexibility. The size limitation is particularly acute for NMR; RNA molecules must be ≤75 nucleotides for facile 3D structure determination by this method. Consequently, aptamer minimization to the smallest compact structure that retains activity is an essential first step toward the determination of any high-resolution aptamer or aptamer-complex structure. Small aptamers also are advantageous as diagnostics or therapeutics as they can be readily synthesized in bulk.
The long-term goal of our studies is to develop an approach that will facilitate the solution of sufficient numbers of aptamer–target structures so that generalizations can be reliably drawn about the range of accessible structural scaffolds and the nature of the molecular interfaces that are obtained by SELEX. We are particularly interested in the similarities and differences between selected and evolutionarily derived RNA molecules that bind proteins. We chose hen egg white lysozyme (HEWL) for the development of a guided approach to aptamer minimization for practical reasons; an aptamer had been selected against it (Cox and Ellington 2001), the protein is inexpensive and easily purified by purchase, and is small and readily crystallized (Alderton and Fevold 1946). We were therefore surprised when the aptamer that had been selected against this well-studied protein was revealed to have a novel cation-stabilized structural fold, an unexpectedly small electrostatic contribution to protein binding, and an unusual form of inhibition of catalytic activity. These observations support our overarching hypothesis that there is much to learn by broadly surveying the structure and binding of nucleic acid aptamers selected against macromolecular targets.
RESULTS
Determination of the aptamer secondary structure
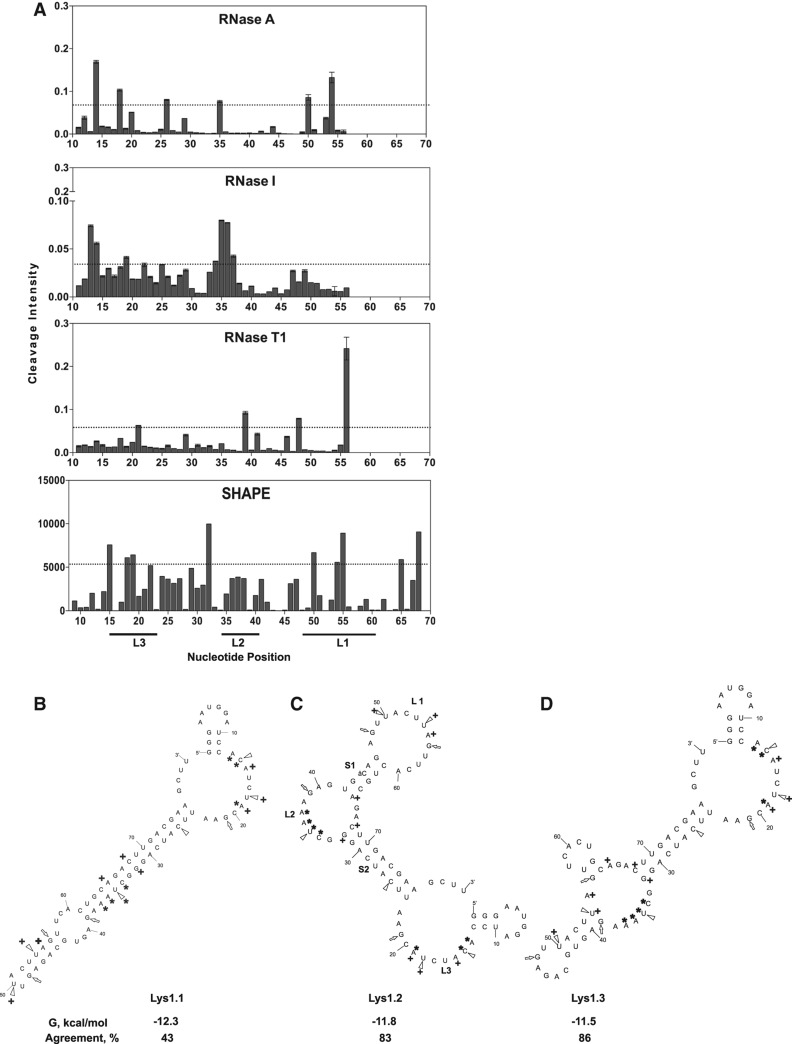
SELEX against lysozyme by Cox and Ellington (2001) yielded unrelated aptamer sequences. Thus, comparative M-fold (Zuker 2003) analysis was unable to identify the correct secondary structure, and we therefore used chemical and enzymatic mapping (footprinting) to experimentally identify the correct secondary structure of their Lys1 aptamer from the family of M-fold predictions. Three RNases and SHAPE analysis (Wilkinson et al. 2006; Deigan et al. 2009) were used to distinguish paired and unpaired nucleotides. RNase T1 cleaves unpaired G, RNase A cleaves the 3′ phosphate of unpaired pyrimidines, and RNase I cleaves unpaired residues without sequence specificity (Clarke 1999). The cleavage intensities calculated from each footprinting probe were mapped onto the predicted secondary structures (Fig. 1). A nucleotide was annotated as a “hit” if the cleavage intensity is greater than twice the standard deviation (i.e., all values above the dotted black bars in Fig. 1). These results were codified using a simple metric relating experimental “hits” to predicted structure. “Percent agreement” is calculated by dividing the number of hits that agreed with the predicted secondary structure by the total.
FIGURE 1.
Enzymatic and chemical footprinting-based determination of the correct Lys1 secondary structure. (A) Enzymatic (RNase A, RNase I, and RNase T1) cleavage and SHAPE modification of Lys1. Dotted horizontal bars represent two standard deviations from the mean cleavage intensity. Nucleotides whose intensity lies above the bar denote cleavage hits. The M-fold predicted secondary structures of lowest energy are shown. (B) Lys1.1 with M-fold predicted ΔG = −12.3 kcal/mol and percent agreement with footprinting = 43; (C) Lys1.2 with ΔG = −11.8 kcal/mol and percent agreement = 83; and (D) Lys1.3 with ΔG = −11.5 kcal/mol and percent agreement = 86. For each predicted secondary structure, open triangles indicate RNase A cleavage sites, open arrowheads indicate RNase T1 cleavage sites, and asterisks indicate RNase I cleavage sites. Nucleotides that readily react with NMIA (SHAPE reagent), indicating flexible and single-stranded nucleotides, are marked with a crosshair.
The lowest energy predicted structure (Lys1.1) is unequivocally excluded as RNase A cleaves nucleotides 14, 18, 26, 35, 50, and 54, and RNase T1 cleaves nucleotides 21, 39, 48, and 56 (Fig. 1). Nucleotides 24–76 are predicted to predominantly reside in a long stem in Lys1.1 (Fig. 1). In contrast, these cleavage sites occur within predicted loops in Lys1.2 and Lys1.3 (Fig. 1) and to a slightly lesser degree in Lys1.4 and Lys1.5 (data not shown). Robust RNase I cleavage is detected within the A/U-rich regions designated L2 and L3 in predicted structures Lys1.2 and Lys1.3 (Figs. 1, 2). SHAPE analysis produces covalent adducts on nucleotides 15, 18–19, 32, 50, 54–55, 65, and 68 that confirm the predicted single stranded loops of structures Lys1.2–5 (Lys1.4 and Lys1.5 not shown). Overall, the structures of Lys1.2 and Lys1.3 had the highest agreement between prediction and experimental measure but are not distinguishable from one another.
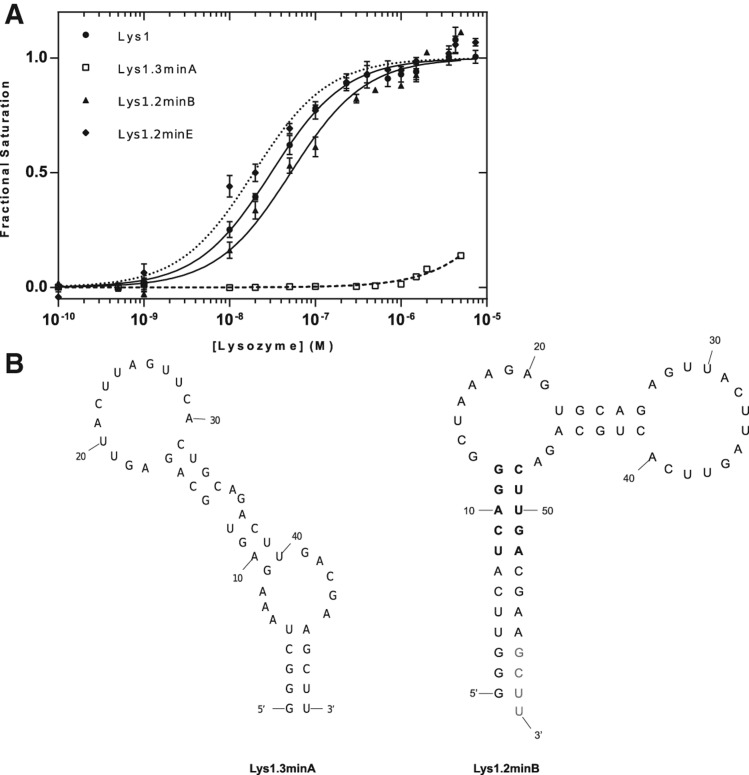
FIGURE 2.
Binding affinities for Lys1 constructs. (A) Binding affinities of full-length aptamer and deletion variants based on footprinting data. (B) Minimization of Lys1 using the predicted secondary structure 1.3 (Lys1.3minA) and secondary structure 1.2 (Lys1.2minB). Residues in gray were changed to CCC to form a thermodynamically stable stem in the Lys1.2minE construct. Residues in bold compose the five Watson-Crick based stems of Lys1.2minF, where UCAGG was replaced with GGGCG and AGUUC was replaced with CCCGC.
Minimizing the aptamer and identifying the protein-binding interface
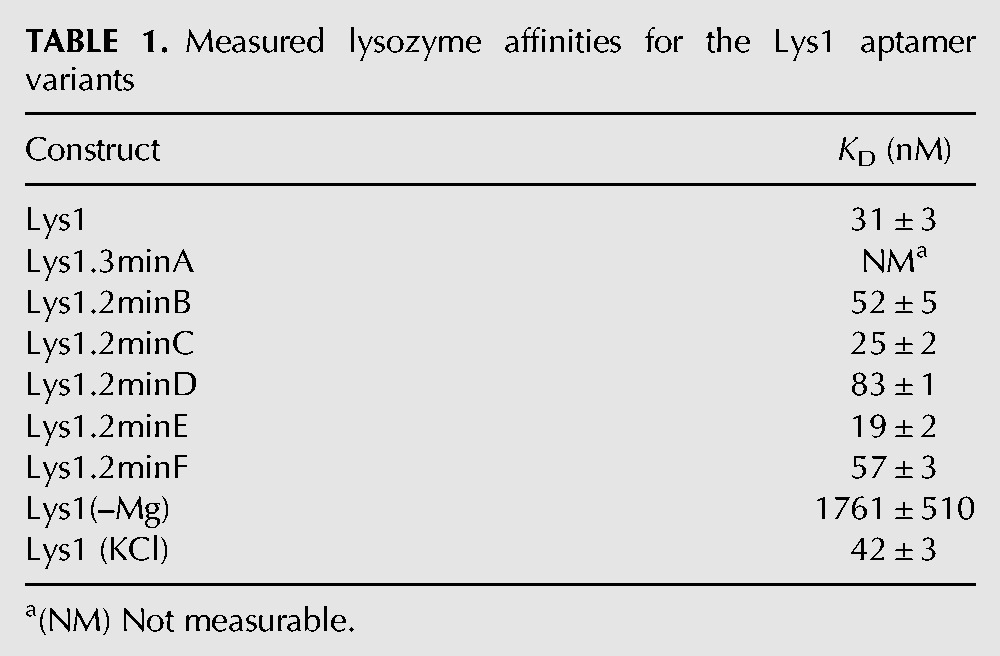
We distinguished structures Lys1.2 and Lys1.3 by trimming nucleotides predicted by each to be largely unstructured. Removal of nucleotides 1–30 (Lys1.3minA) eliminates detectable lysozyme binding, whereas deletion of nucleotides 1–23 (Lys1.2minB) has little effect on binding (Fig. 2A; Table 1). Since nucleotides 1–30 and 1–23 are predicted to be unpaired in Lys1.3 and Lys1.2, respectively, these results support Lys1.2 as the correct representation. This conclusion is confirmed by deletion of nucleotides 77–80 (Lys1.2minC) and simultaneous deletion of nucleotides 1–23 and 77–80 (Lys1.2minD); these aptamers bind lysozyme with affinity close to that of the parent Lys1 (Fig. 2; Table 1). The helical stem formed by the 3′ and 5′ nucleotides of the necessary and sufficient residues 24–76 was stabilized by engineering a Watson-Crick base-paired extension to the stem to enhance its thermodynamic stability (Lys1.2minE) (Fig. 2B, gray; Table 1).
TABLE 1.
Measured lysozyme affinities for the Lys1 aptamer variants
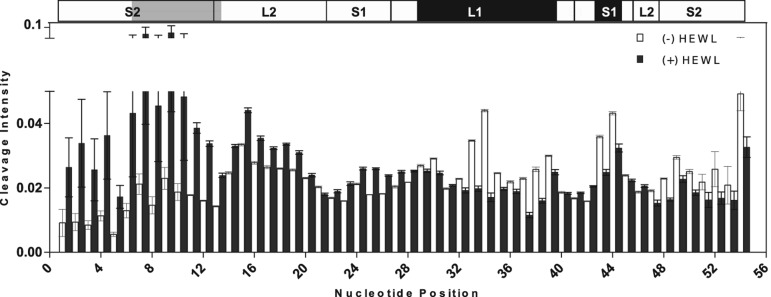
The nucleotides of Lys1.2minE that contact lysozyme were identified by hydroxyl radical (•OH) footprinting (Tullius and Greenbaum 2005). Because •OH is comparable in size to water, the susceptibility of a particular nucleotide to •OH reflects its solvent accessibility. Footprinting Lys1.2minE using •OH in the presence and absence of lysozyme reveals that nucleotides 29–39 and 43–44 are protected from cleavage in the protein complex and the cleavage of nucleotides 6–13 is enhanced (Fig. 3, black and gray, respectively).
FIGURE 3.
Hydroxyl radical footprinting of Lys1.2minE. The fractional hydroxyl radical cleavage for each nucleotide is shown in open bars for the free aptamer and in filled bars for the protein–aptamer complex. The secondary structure of Lys1.2minE is shown above, with regions of minE showing lysozyme protection highlighted in black, whereas regions that are more susceptible to cleavage in the presence of lysozyme are highlighted in gray.
Cation contributions to aptamer structure and lysozyme binding
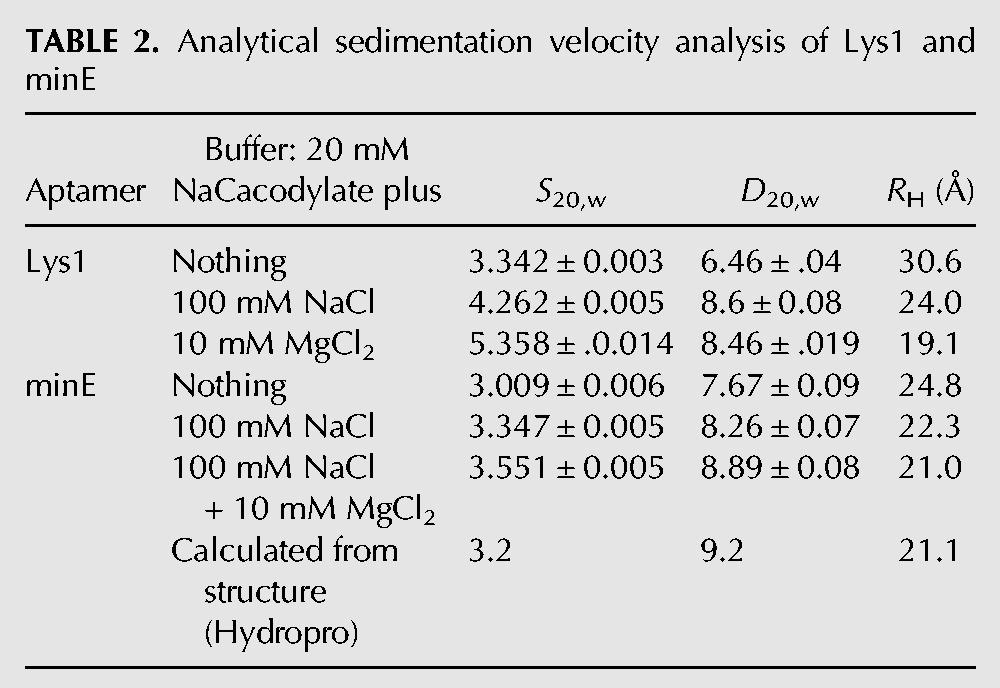
Cations are well-documented contributors to the stability of RNA tertiary structure (Draper et al. 2005; Leipply et al. 2009) and equally well-documented competitors of protein binding (Draper 2008). Both the parent Lys1 and the minimized Lys1.2minE become more compact at higher ionic strength; in sedimentation velocity experiments, both S20,w and D20,w increase significantly when 100 mM Na+ is added to the solution (Table 2). The addition of 10 mM Mg2+ to this solution further compacts the RNA. The magnitudes of the changes are much smaller for Lys1.2minE compared with the parent Lys1 (Table 2).
TABLE 2.
Analytical sedimentation velocity analysis of Lys1 and minE
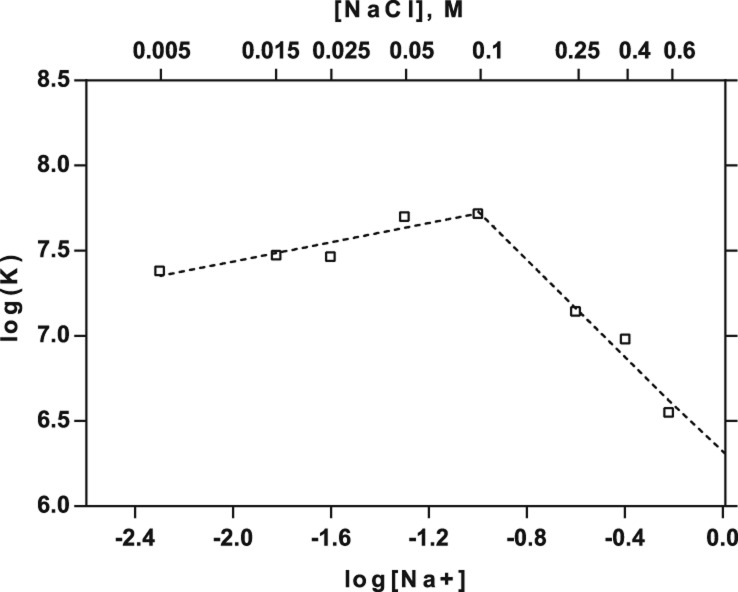
Since the selection of Lys1 was carried out in the presence of both Mg2+and Na+, we tested whether the divalent cation is required for lysozyme binding. Eliminating Mg2+ while retaining 100 mM Na+ reduced lysozyme binding by Lys1 by ≥67-fold (2 μM vs. 26 nM) (Table 1). Thus, at moderate ionic strength, Mg2+ is required for high affinity binding by the Lys1 aptamer. We followed the binding of Lys1.2minE to lysozyme as a function of [NaCl] at constant 5 mM MgCl2 in order to estimate the electrostatic contribution to the RNA–protein interaction. Linkage plots typically are linear with negative slopes at moderate to high salt concentrations even in the presence of Mg2+ (Uchida et al. 2002; Blakaj et al. 2006). In contrast, a biphasic linkage relationship is measured for Lys1.2minE binding to lysozyme (Fig. 4). At concentrations of Na+ below 100 mM a positive slope of 0.28 is measured, indicative of net monovalent cation uptake. Above 100 mM the expected negative slope indicative of monovalent cation displacement upon complex formation is observed. However, the slope of −1.4 is surprisingly small. These data suggest that a thermodynamic average of 1–2 cations is displaced upon aptamer binding to lysozyme at high ionic strength, and a maximum of only 18% of the total binding energy is electrostatic in origin. Thus, nonelectrostatic interactions dominate this RNA–protein interaction. These data suggest that two reactions occur during formation of the Lys1.2minE–lysozyme complex: (1) canonical displacement of cations from the phosphodiester backbone at the protein–RNA interface; and (2) cation uptake by one of the components of the protein–RNA complex. We note that another aptamer whose interactions with lysozyme are characterized elsewhere is unrelated to Lys1 (Potty et al. 2011).
FIGURE 4.
Ion uptake and displacement in the aptamer–lysozyme complex. In the dual log plot of KA (affinity constant) vs. Na+ concentration a positive slope of 0.28 is measured at concentrations of Na+ below 0.1 M, indicating a net monovalent cation uptake. However, at [Na+] above 0.1 M, the expected negative slope demonstrates a monovalent cation displacement upon complex formation. The slope of −1.43 is surprisingly small resulting in an abscissa intercept of log 6.3.
The structure of the Lys1.2minE–lysozyme complex
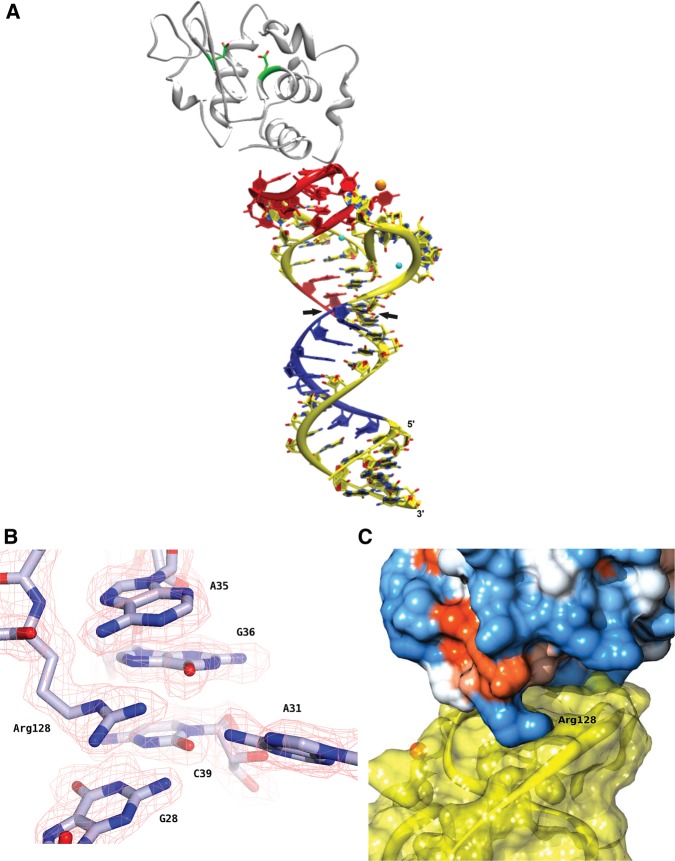
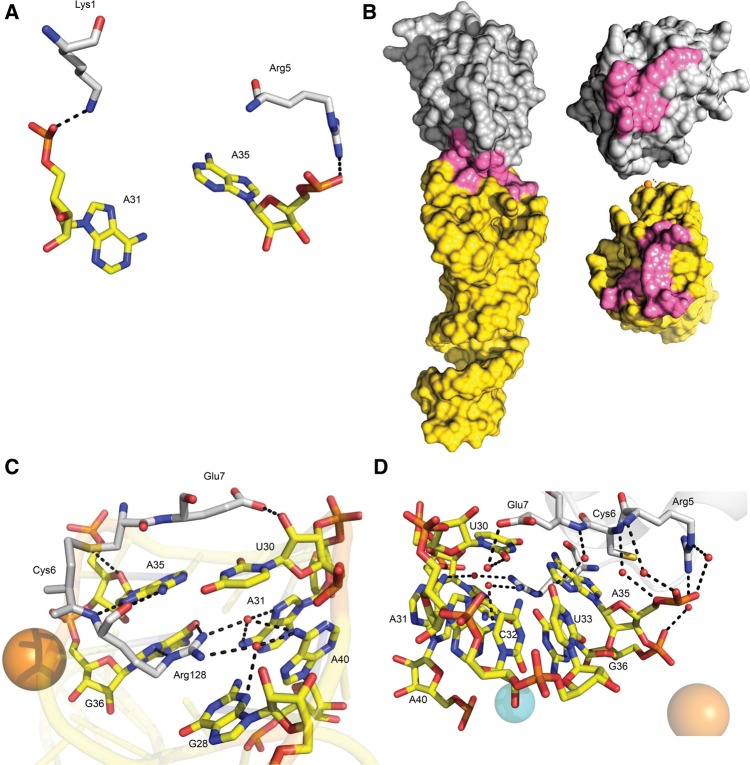
Having reduced the original Lys1 aptamer to the minimal features necessary for stability and high affinity, we proceeded to crystallize Lys1.2minE in complex with lysozyme and determined its crystal structure at a resolution of 2.0 Å (Fig. 5; Table 3). An enduring generalization of nucleic acid–protein interactions is that positive charges on the protein at the macromolecular interface balance the high negative charge of the phosphodiester backbone. Surfaces of positive protein potential are typically the targets of selected aptamers (Convery et al. 1998; Allain et al. 2000; Long et al. 2008; Reiter et al. 2008). Despite the small electrostatic contribution to the formation of the Lys1.2minE–lysozyme complex noted above, the complex fits within the paradigm. Lys1.2minE binds to a basic patch formed by the N- and C-terminal helices of lysozyme distal to the catalytic site (Fig. 5C). Consistent with the small electrostatic contribution calculated from the linkage analysis, only two phosphate-protein salt bridges are observed to directly participate in mediating the protein–RNA interface (Fig. 6A).
FIGURE 5.
Crystal structure of the Lys1.2minE–lysozyme complex. (A) Ribbon diagram with Lys1.2minE shown in yellow (with the regions of protection and deprotection observed by hydroxyl radical footprinting shown in red and blue, respectively), lysozyme backbone shown in gray with the side chains of catalytic residues Glu35 and Asp52 colored by atom type; (Na+) orange; (Mg2+ ) cyan. Black arrowheads indicate where stem has been trimmed for Lys1.2minF construct. (B) The Lys1.2minE structure superimposed onto the simulated annealing omit electron density map contoured at 1 σ. (C) Lys1.2minE binds to a basic patch on the surface of lysozyme, as observed by the electrostatic potential surface map of hen egg white lysozyme. Arg128 anchors the inside loop of minE, making several important contacts with neighboring nucleotides and water molecules.
TABLE 3.
Crystallographic data collection and refinement statistics
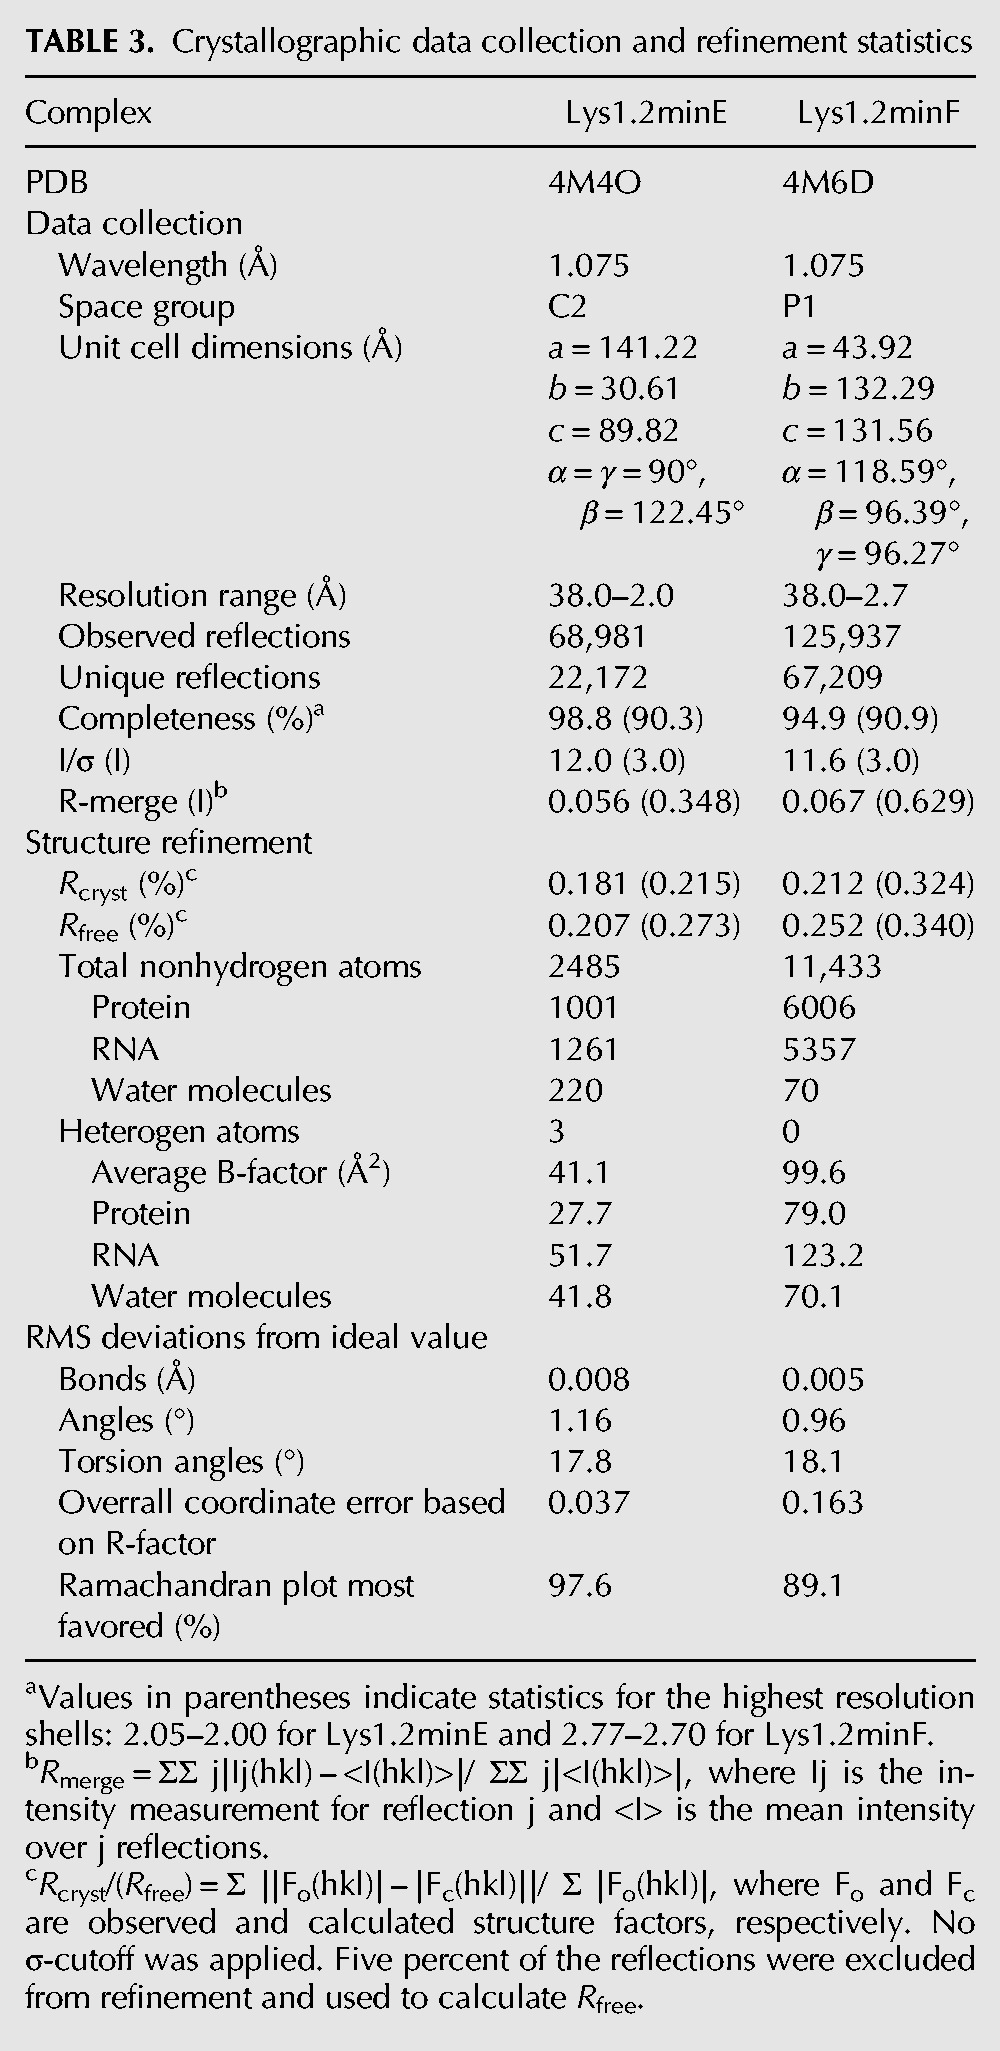
FIGURE 6.
The lysozyme–Lys1.2minE interface. (A) The anionic phosphates of A31 and A35 bind with positively charged side chains of Lys1 and Arg5. (B) The binding surface area (highlighted in pink) is surprisingly small in comparison to other protein–RNA aptamer complexes. (C,D) Eight water molecules (red spheres) coordinate lysozyme residues with minE bases at the binding interface.
The base of the aptamer is a canonical A-form helix that is disrupted following the U15–A45 base pair by the formation of loops L1 and L2. L1 comprises nucleotides A27–A40, as predicted by M-fold. L2 is composed of nucleotides A16–U22 and is slightly smaller than predicted. Together, L1 and L2 form the “platform” to which lysozyme docks, burying 410 Å2 of the protein's solvent accessible surface and 377 Å2 on the aptamer (Fig. 6B). The binding surface of the aptamer in the crystal structure is consistent with that observed by •OH footprinting in solution, in which nucleotides 29–39 and 43–44 are protected against •OH cleavage (Fig. 3).
At the interface, a single arginine residue mediates multiple interactions with Lys1.2minE. The guanidinium moiety of Arg128 is positioned at an optimal distance to form several hydrogen bonds with nucleotides A35 and G36 (Fig. 6C). Only one additional hydrogen bond is evident at the protein–RNA interface; the OE2 of Glu7 hydrogen bonds with O2′ of U30. The bases of U30 and A35 form a platform that packs against the side chains of Cys6 and Glu7, as well as the protein backbone. Eight water molecules form bridging hydrogen bonds between lysozyme side chains and Lys1.2minE nucleotides (Fig. 6D). Residues Glu7, Cys6, Arg5, Arg125, and Arg128 coordinate via water to nucleotides including G28, U30–U33, A35–G36, and A40. As noted above, two salt bridges are observed in the molecular interface (Fig. 6A). The Lys1 side chain forms a 2.5-Å salt bridge with the phosphate of A31, and the Arg5 side chain pairs with the backbone phosphate of A35 at a distance of 2.9 Å.
The origin of the monovalent cation uptake observed in the binding linkage studies is readily rationalized by the structure. A single sodium ion coordinates residues from loops L1 and L2, thereby stabilizing the groove near the foot of the protein-binding platform formed by the loops (Fig. 7A). Analysis of the coordination geometry is consistent with the presence of Na+ rather than water or Mg2+. Bases in proximity to the bound cation flip outward to mediate this interaction. Specifically, O6 of G21 makes direct contact with the monovalent cation, at a distance of 2.34 Å. Although a systematic analysis of cation specificity has not yet been conducted, K+ can substitute for Na+ with only a small loss in lysozyme binding affinity (Fig. 7B). Thus, aptamer selection in a buffer containing Na+ and Mg2+ did not select against species capable of utilizing cations of slightly greater ionic radius. Two Mg2+ ions, one at the base of L1 and the second in the central cavity of L2, are also observed in the structure. These hydrated divalent ions appear to neutralize the highly electronegative potential of the loops of Lys1.2minE, as opposed to mediating base-specific contacts (Fig. 7C). Only one Mg2+ makes direct contact with a nonbridging oxygen atom of the A17 phosphate.
FIGURE 7.
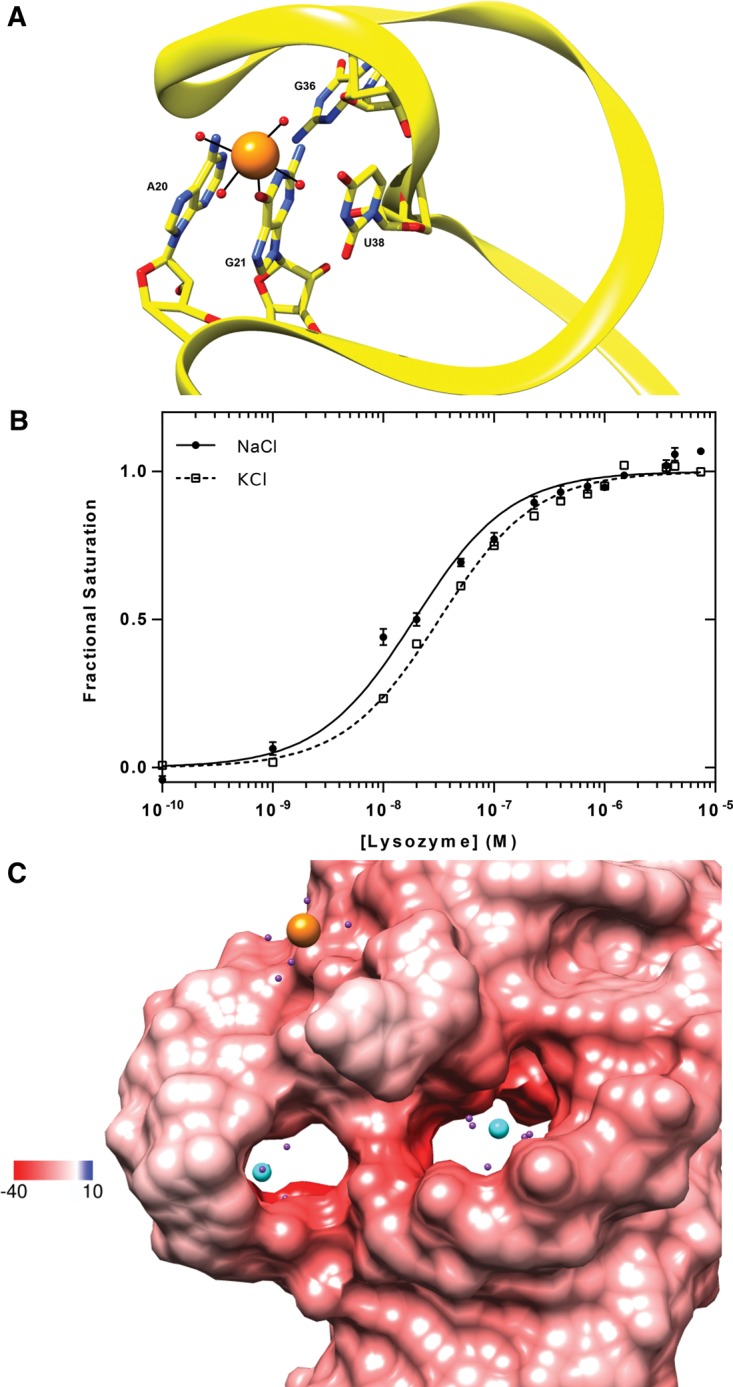
Cation binding sites in Lys1.2minE. (A) Coordination geometry of Na+ to surrounding atoms that stabilize loops 1 and 2. (B) The effect of monovalent cation type on lysozyme affinity. (C) Locations of the two ordered Mg2+ ions in the regions of the most negative electrostatic potential in the loops of the RNA. Water molecules are depicted as purple spheres.
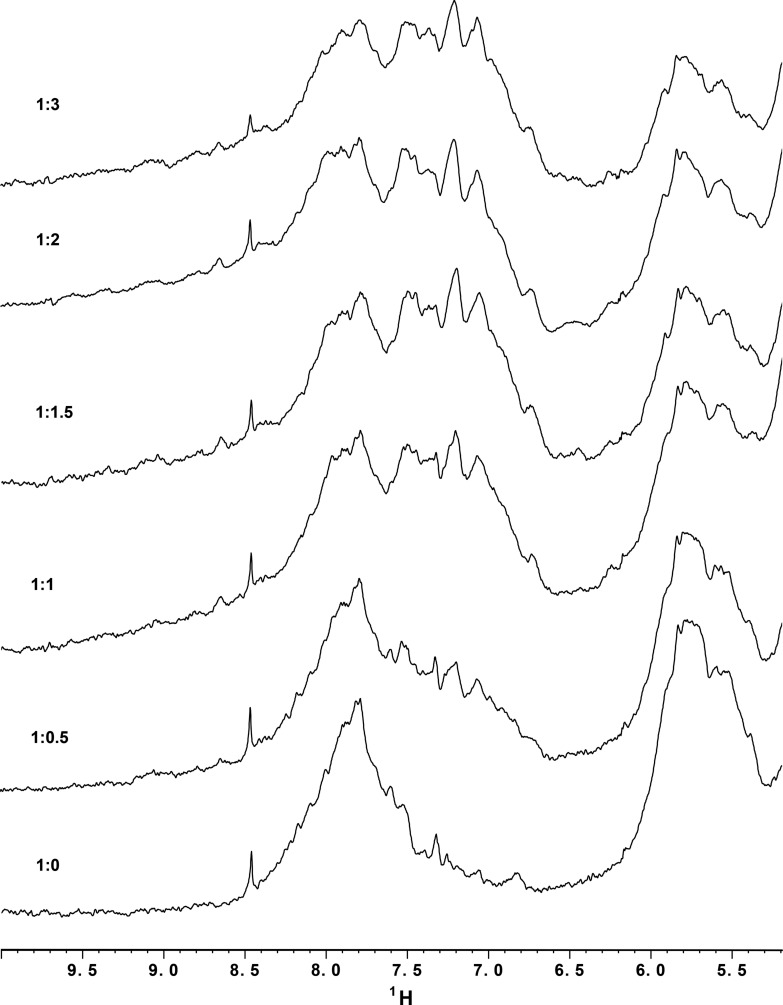
The structure of lysozyme within the complex is indistinguishable from previously published structures of the protein with an RMSD of 0.21–0.33 Å for the 129 aligned Cα atoms in 15 HEWL structures.3 Although we have been unable to crystallize the free aptamer, two independent lines of evidence suggest that the structure of Lys1.2minE is only modestly affected by complex formation: (1) The sedimentation parameters calculated for the aptamer alone taken from the structure are in close agreement with those measured for the free aptamer (Table 2); and (2) the secondary structure of the free aptamer mapped by chemical and enzymatic footprinting differs only slightly from the secondary structure present in aptamer–protein complex. Thus, the global conformation of the aptamer does not appear to appreciably change upon protein binding. However, the free aptamer is more dynamic than when bound to lysozyme. The base protons signals in the 1D NMR spectrum of the free aptamer are broad and overlapped (Fig. 8). On addition of lysozyme, these resonances sharpen and become more disperse, saturating at a 1:1 lysozyme to aptamer stoichiometry.
FIGURE 8.
1D 1H NMR spectra of 150 μM Lys1.2minE in the presence of increasing amounts of lysozyme. The Lys1.2minE base proton signals are overlapped in the absence of lysozyme but are increasingly resolved on the addition of 0.5 and 1.0 equivalents of lysozyme. There are no further differences in the aromatic region of the RNA spectra at higher lysozyme concentrations.
An even smaller aptamer, Lys1.2minF binds lysozyme with high affinity
After viewing the Lys1.2minE–lysozyme structure, we hypothesized that the role of the helical stem was simply to stabilize the cation-mediated protein binding platform composed of loops L1 and L2. To test this hypothesis, the terminal stem of Lys1.2minE was shortened to four Watson-Crick base pairs. The 45 nucleotides of Lys1.2minF are sufficient for high affinity lysozyme binding (Fig. 2B; Table 1). The Lys1.2minF–lysozyme complex yielded crystals that diffract to 2.7 Å. The structures of the protein interfaces of Lys1.2minE and Lys1.2minF are highly similar, with a backbone RMSD of 0.64 Å (Fig. 9). The shortened stem of Lys1.2minF stem is more disordered than the longer stem of Lys1.2minE, as might be expected from the reduced number of base pairs stabilizing it. The high affinity binding of Lys1.2minF renders moot the significance of enhanced •OH reactivity of nucleotides 6–13 within the stem of Lys1.2minE to the mechanism of lysozyme binding, since they are absent in Lys1.2.minF (Fig. 2B, bold; Table 1).
FIGURE 9.

Superposition of Lys1.2minE-HEWL (gray) and Lys1.2minF-HEWL (black) crystal structures. Lys1.2minE and F superimpose with an RMSD of 0.64 Å for the backbone atoms.
Does aptamer binding affect lysozyme's catalytic activity?
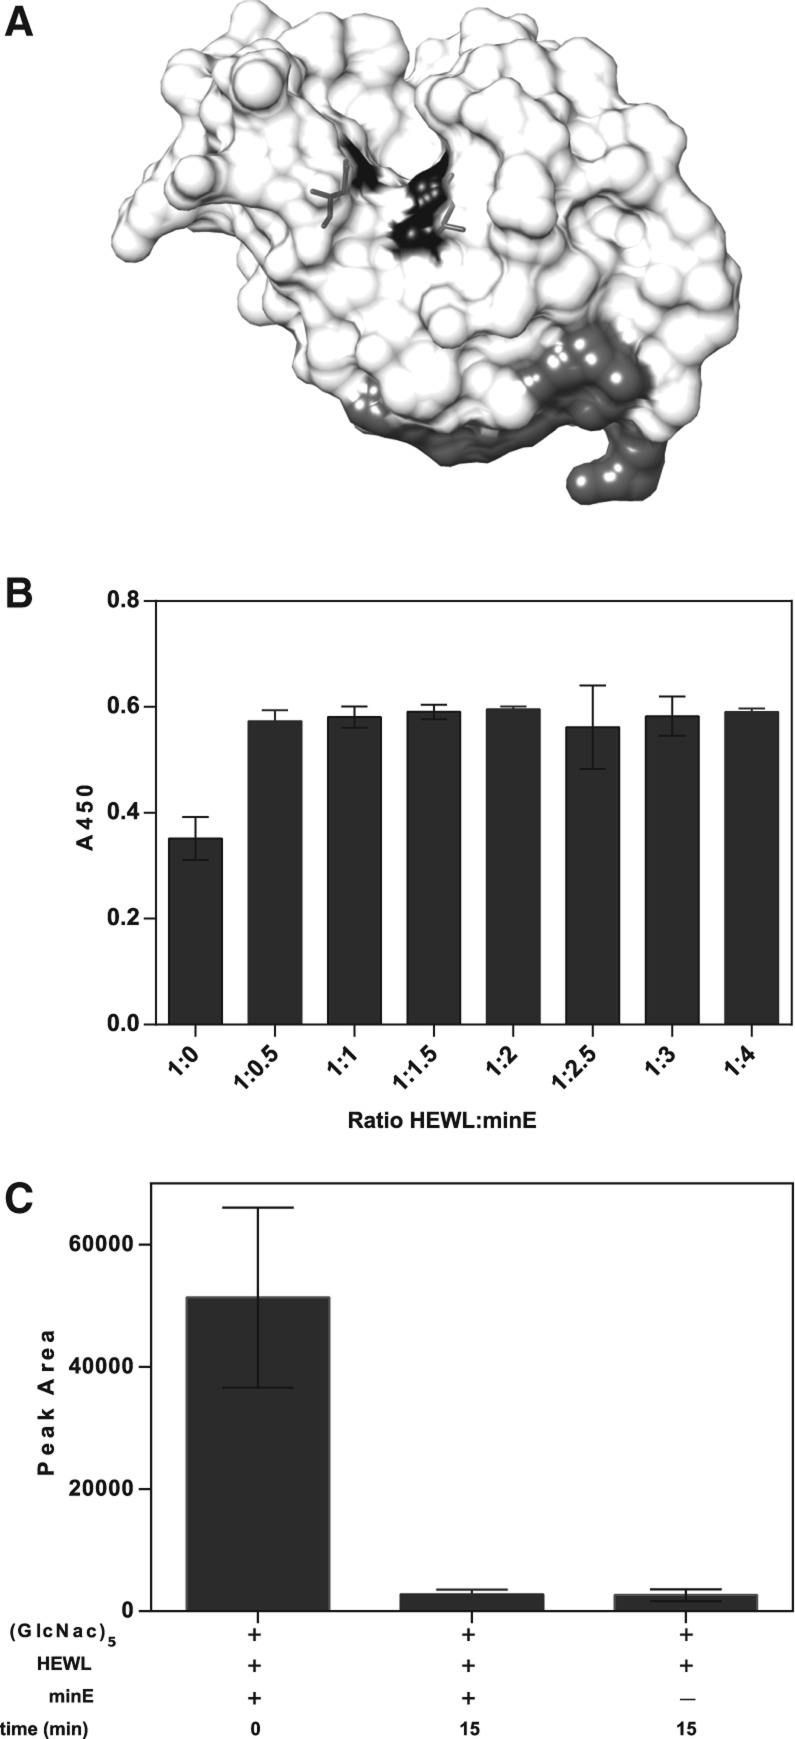
Lysozyme hydrolyzes substrates that include the N-acetyl muramic acid (NAM) and N-acetyl glucosamine (NAG) copolymers that constitute the basic unit of bacterial cell walls. The parent Lys1 aptamer was reported to inhibit lysozyme's catalytic activity in vitro (Cox and Ellington 2001), an observation not readily rationalized with Lys1.2minE binding distal to the protein's active site (Fig. 10A) and the invariance of the protein structure on aptamer binding. To directly correlate the modulation of enzyme function with our structure, the effect of Lys1.2minE on enzymatic function was evaluated using the standard cell wall hydrolysis assay for the enzyme (Gorin et al. 1971; Grossowicz et al. 1979). As had been observed for Lys1, addition of a stoichiometric amount of Lys1.2minE completely inhibits lysozyme activity in this assay (Fig. 10B). The absence of any observable conformational change argues against classic allosteric inhibition (Fenton 2008).
FIGURE 10.
Effect of Lys1.2minE on catalytic activity of lysozyme. (A) Crystal structure of Lys1.2minE–lysozyme complex depicting the active site catalytic residues (Glu35 and Asp52) of lysozyme in black and the aptamer binding interface in gray. (B) Lysozyme activity against M. lysodeikticus cell walls. The turbidity (OD450) from the cell wall material remaining after 60 min in the presence of 0.3 μM lysozyme is shown for increasing aptamer stoichiometries. (C) MALDI-TOF activity assay monitoring lysozyme hydrolysis of chitopentaose after 15 min in the absence and presence of equimolar Lys1.2minE.
Alternative mechanisms are allosteric regulation through modulation of protein dynamics (Bahar et al. 2007; Goodney and Benkovic 2008) or steric inhibition of the binding of large cell wall substrate by the bulky and highly charged aptamer. Hydrolysis of a smaller substrate was used to distinguish between these alternatives. Lysozyme catalyzes the hydrolysis of β(1,4) glycosidic bonds, which can be found in chitin derivatives such as N,N′,N′′,N′′′,N′′′′-pentaacetylchitopentaose, a GlcNAcβ1–4GlcNAc polymer. The lysozyme-catalyzed hydrolysis of chitopentaose was monitored by MALDI-TOF mass spectrometry. Under conditions in which Lys1.2minE fully inhibits cell wall hydrolysis, complete hydrolysis of dp5 (degree of polymerization [dp]) to shorter polymers was observed within 15 min with no inhibition by the aptamer (Fig. 10C). Thus, Lys1.2minE inhibits catalytic activity by inhibiting the binding of large natural substrates.
DISCUSSION
We combined chemical and enzymatic footprinting to identify the functional core of the nM affinity RNA aptamer Lys1 that had been selected against hen egg white lysozyme (Cox and Ellington 2001). Our minimized aptamers (Lys1.2minE and Lys1.2minF) retain both the high affinity binding and inhibition of cell wall hydrolysis of the parent aptamer. Solution of the structure of the Lys1.2minE–lysozyme complex reveals unexpected insights into the nature of aptamer–protein complexes and their ability to modulate protein function. Clearly there is much that can be learned from “old” aptamers selected against “boring” proteins.
Since high-resolution structural analysis, as well the development of diagnostic tools and potential therapeutics, benefits from the identification of a minimally sized functional aptamer, a variety of minimization methods have been used for this purpose. The simplest method for aptamer minimization is to “trim the ends,” ignoring the secondary structure and the contribution of the constant regions that flank the selected residues in stabilizing an aptamer's structure. For Lys1, truncation of the 3′ constant region compromises binding by approximately fivefold, whereas truncation of the 5′ constant region obliterates protein binding (data not shown).
Minimization based upon the RNA secondary structure is a more nuanced approach in which constructs are designed based on predicted folds or conserved motifs identified from the sequences of active selected aptamers (Wilner et al. 2012). Cycles of minimization are iteratively designed and tested following function analysis; this process typically takes two or three cycles to achieve a final minimized construct. However, the most stable predicted secondary structure is often not the structure adopted by a molecule; this characteristic of folded RNA can take cycles of minimization down the wrong path, thus wasting time and resources. The correct secondary structure can be efficiently determined by chemical and enzymatic structure mapping; this approach showed that the actual secondary structure of Lys1 is not the one that is predicted to be the most stable. In the present case, we were unable to distinguish between the two most probable structures, and thus used a single round of truncation to conclusively show that Lys1.2 is the correct secondary structure (Fig. 1). Trimming off and stabilizing “the loose ends” of the predicted secondary structure resulted in the compact molecule Lys1.2minE (Table 2), whose crystal structure was determined. Hydroxyl radical footprinting of Lys1.2minE against lysozyme confirmed that the minimized aptamer contained the protein-binding site. The technical simplicity and straightforward analysis of enzymatic and chemical mapping makes this approach adaptable to large-scale analyses of RNA structures that also provides solution structural correlates to experimentally determined crystal structures.
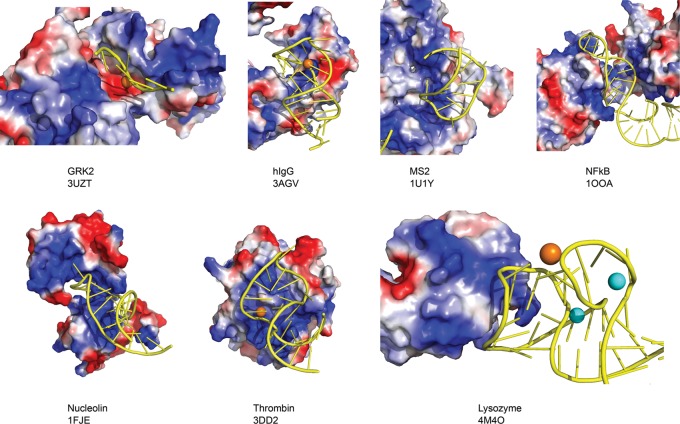
Our Lys1.2minE–lysozyme structure is the seventh RNA aptamer–target protein complex whose structure has been determined at atomic resolution. The other complexes that have been deposited in the Protein Data Bank (PDB) to date are nucleolin (Allain et al. 2000; Bouvet et al. 2001), NF-κB (Huang et al. 2003), bacteriophage MS2 (Convery et al. 1998; Horn et al. 2004), thrombin (Long et al. 2008), human IgG (Nomura et al. 2010), and the G protein-coupled receptor kinase GRK2 (Tesmer et al. 2012). A feature common to these specific aptamer–protein interactions is the positive potential of protein surfaces to which each aptamer binds (Fig. 11). This observation supports the generally held assumption that electrostatic interactions between the negatively charged phosphate backbone and positively charged side chains contribute to aptamer–protein stabilization. However, the small area of the interface and the few direct phosphate contacts observed in the Lys1.2minE–lysozyme complex, together with the small number of displaced cations and electrostatic contribution calculated from linkage analysis (Fig. 4) shows that nM affinity aptamer–protein complex formation is achieved without a dominant electrostatic driving force. Thus, the selection of aptamers against targets lacking extensive positive potential may be more feasible than has been presumed, although some positive charge may be required to form the initial protein–RNA encounter complexes.
FIGURE 11.
Electrostatic surface potentials of protein-binding aptamer structures that have been solved: NF-KB (1OOA), MS2 (1U1Y), Nucleolin (1FJE), Thrombin (3DD2), hIgG-Fc1 (3AGV), GPCR kinase 2 (3UZT), and Lysozyme-minE (4M4O).
Another unique characteristic of the Lys1.2minE–lysozyme structure is its cation-stabilized protein-binding fold. The observation of clear electron density reflects site-specific rather than delocalized cation binding. The essential role of this monovalent cation is confirmed by the [Na+] dependence of the aptamer–lysozyme association; the positive slope to the linkage plot below 100 mM Na+ reflects a cation uptake reaction that counterbalances the cation displacement accompanying complex formation. Ten mM Mg2+ does not substitute for the monovalent cation, suggesting valence specificity to the interaction. Equimolar substitution of K+ for Na+ results in only a 1.5-fold reduction of protein binding affinity; the absence of a rigid size or charge density requirement to binding of this cation can be rationalized by the structure as there is evident plasticity to the organization of loops L1 and L2 that constitute the binding platform. Future studies will explore in more detail the specificity, stability, and structural consequence of this functionally important cation. It would also be of interest to explore whether aptamers of this structural fold could be selected with specificity for a particular cation.
The mechanisms by which aptamers inhibit the activity of their targets is presumed to be manifest through interactions of the aptamer with the target's catalytic or active site. Such direct inhibition has been inferred from aptamer–protein structures such as NFκB or GRK2 (Reiter et al. 2008; Tesmer et al. 2012). However, Lys1.2minE (and Lys1.2minF) inhibits lysozyme cleavage of large substrates by an unexpected mechanism. The aptamer neither occludes the catalytic site nor induces an allosteric transition. Indeed, bound aptamer has no effect on catalysis of small substrates. Rather the bound aptamer precludes access of the enzyme to the M. lysodeikticus cell walls that are an appropriate mimic of natural substrates. Whether inhibition of large substrate cleavage is due to the electronegativity of the aptamer or that its binding site overlaps a key contact surface to which the substrates bind is not presently known. However, this observation suggests that catalytic sites may not need to be exclusively targeted if the goal is alteration of enzymatic or binding activity by an aptamer.
Although the binding of Lys1.2minE to lysozyme causes no changes in the conformation of the protein, the RNA becomes more structured upon protein binding. Reduction of conformational heterogeneity is typically observed when aptamers bind to their targets. For example, the loop regions of the 22-nucleotide nucleolin aptamer and the 29-nucleotide NFκB RNA aptamer in the unbound state exchange between different conformations (Bouvet et al. 2001; Reiter et al. 2008). It is unsurprising that aptamer-protein recognition is mediated in part by flexible regions in the unbound aptamer that provide adaptability in binding. Once the aptamer is bound, a well-ordered structure is formed.
The first hint of RNA conformational change was seen in the •OH footprinting analysis as nucleotides in the helical stem of Lys1.2minE become more accessible upon lysozyme binding (Fig. 4). NMR titration data revealed that Lys1.2minE is less structured when it is not bound to its target protein, as observed by broadened, unresolved resonances in the aromatic region of the 1H spectra (Fig. 8). The addition of stoichiometric amounts of lysozyme results in sharpening and dispersal of the aromatic proton chemical shifts that is clear evidence of further structuring of the aptamer upon complex formation. These changes are best described as “structuring” rather than “folding” as the sedimentation velocity analysis shows the global structure of the free aptamer to be indistinguishable from when it is bound to lysozyme (Table 2). The flexibility of the unbound aptamer explains our inability to crystallize free Lys1.2minE crystals for diffraction analysis.
Lys1.2minE achieves its nanomolar affinity for lysozyme via a modest 410-Å2 binding surface that makes use of only two direct ionic interactions, four direct hydrogen bonds, and eight bridging hydrogen bonds from water molecules, a π-π stacking interaction between Arg128 and G28, and weaker van der Waals packing. How does this interface compare with those from other aptamer–protein complexes? Nucleolin, NF-κB, and bacteriophage MS2 all naturally bind nucleic acids in vivo, whereas Human IgG Fc1 (hFc1), thrombin, and GPCR kinase 2 (GRK2) do not. Although we note that both the thrombin and the IgG aptamers are composed of non-natural 2′F RNA, the interactions between human IgG, thrombin, GRK2, and their selected RNA aptamers are the appropriate comparisons for analyzing the interaction of aptamer RNA with sites not evolved to interact with nucleic acids.
The 2.15-Å crystal structure of an aptamer–IgG hFc1 complex (KD = 110 nM; KA1 = 3 × 10⁴ M−1 s−1; KD1 = 3.3 × 10⁻³ s−1) (Nomura et al. 2010) also shows a relatively small binding interface of moderate positive charge density that is comparable to the Lys1.2minE-lysozyme interface in size (580 Å2 vs. 410 Å2, respectively). Like Lys1.2minE, the aptamer–IgG complex does not appear to rely heavily on electrostatics; the RNA–protein contacts are mediated by multiple weak forces supported mainly by van der Waals contacts, two protein-RNA and four bridging water hydrogen bonds, and only a single salt bridge. Binding of the aptamer results in no significant change in the hFc1 structure, with an RMSD of 1.1 Å of the backbone Cα atoms. Similar to our full-length Lys1 aptamer, divalent ions play an important role in stabilizing the IgG aptamer structure. In the absence of Mg2+, Lys1 binds to HEWL with a 60-fold lower affinity (Table 1). Ca2+ was present during the selection of the IgG aptamer, and this hydrated ion is located in the major groove in the aptamer crystal structure. Similar to Lys1.2minE, the divalent ion makes limited contact with the RNA, binding only to a nonbridging phosphate oxygen of G7. In the crystal structure, G7 stacks on the side chain of Tyr373. Therefore, the Ca2+ ion serves to maintain a unique conformation of G7 to allow for proper hFc1 binding. A Mg2+ ion may also presumably occupy the same site, as the aptamer could bind to IgG in the presence of Mg2+. Addition of a chelating agent such as EDTA reversibly inhibits binding of the IgG aptamer. Clearly, divalent ions play an important role in modulating hFc1 affinity.
The higher affinity (KD = 562 pM) anti-thrombin RNA aptamer also binds to a basic region on the surface of thrombin (exosite-2), but contacts a considerably larger 1193 Å2 of accessible surface area (Long et al. 2008). This interface involves a greater number of direct protein-RNA polar interactions, including 10 direct and three indirect hydrogen bonds and six salt bridges, and employs an unusual feature—an extended adenine–arginine zipper, where the π-π stacking of the conserved adenine bases with the arginine side chains contributes to affinity and specificity and accounts for the bulk of the interfacial surface area. In the crystal structure of the aptamer–thrombin complex, a single Mg2+ ion was observed near the stacking interface. Mg2+ was present at high concentrations in the crystallization conditions that ultimately gave rise to the crystals. As previously observed in the IgG aptamer, the divalent ion in the thrombin structure does not bind base-specifically to the aptamer. Rather, it coordinates to four water molecules, as well as the nonbridging oxygen atoms of phosphates A8 and A9, which do not form the absolutely conserved adenine–arginine zipper.
More recently, an aptamer family (C13.28 and C13.18) in complex with GRK2 was structurally characterized by crystallography. In this more specialized case, the aptamer targets the substrate ATP binding of the enzyme, with A51 of the aptamer and a Mg2+ ion forming the contacts normally made by ATP and one of the two Mg2+ required for catalysis. A detailed analysis of all of the RNA–protein interactions is not possible, since only a small portion (nucleotides 47–52) of the aptamer is well-ordered in the structure. However it is clear that the aptamer binds to a positively charged region of the protein, buries at least 1140 Å2 of accessible surface on the protein, and, as observed previously for some small molecule ligands, induces a change in inter-lobe orientation in the kinase on binding.
Although the structural terrain of RNA aptamer–protein interactions is only beginning to be explored, it is already apparent that aptamers can achieve high binding affinity using a variety of architectures that can differ significantly from those typically seen in native protein–nucleic acid complexes. The aptamer binding interface can be remarkably small and make only minor use of electrostatic interactions, as demonstrated here for Lys1. Divalent cations can neutralize regions of high negative charge density to stabilize loops or other local conformations that help form or buttress the binding site. Other components of the selection buffer can be incorporated into the target–aptamer complex as an essential structural element, such as the required Na+ ion in Lys1, suggesting the possibility of selecting aptamer switches that require a particular ion or other small molecule for binding to their target (Di Palma et al. 2013; Smestad and Maher 2013). With only a limited number of examples, our view of the range of aptamer–protein interactions is far from complete. Hopefully a robust method for identifying compact aptamer cores suitable for structural study, such as the footprinting approach developed here, will lead to both a more comprehensive understanding of these interactions and potential improvements in library design biased toward successful fold elements.
MATERIALS AND METHODS
RNA preparation
The primers required to synthesize the RNA molecules that we analyzed were obtained from Integrated DNA Technologies. Aptamers were transcribed in vitro using T7 RNA polymerase, purified on an 8% polyacrylamide gel containing 7 M urea, ethanol precipitated, and resuspended in folding buffer (20 mM Tris-HCl, pH 7.5, 100 mM NaCl, 5 mM MgCl2) (Nilsen and Rio 2012). After their purification, the RNA aptamers were heated for 5 min to 70°C and then allowed to cool to room temperature for 15 min prior to the experiment.
Chemical mapping (footprinting)
Lys1 was 5′-kinased with [γ-32P] ATP, gel purified, and the recovered RNA was resuspended in folding buffer. Ribonuclease (T1, A, and I) reactions were conducted for 15 min at room temperature and quenched by ethanol precipitation (Ehresmann et al. 1987; Parker and Steitz 1989). The RNA reaction products were separated using a 15% denaturing polyacrylamide gel. The sites of ribonuclease cleavage were mapped by comparison against an RNase T1 cleavage ladder.
Selective 2′-hydroxyl acylation by primer extension (SHAPE) was used to map single stranded nucleotides (Wilkinson et al. 2006; Deigan et al. 2009). Ten picomoles Lys1 was modified with N-methylisatoic anhydride (NMIA) for 45 min at 37°C. The modified RNA was recovered by ethanol precipitation and reverse transcribed using Cy5-labeled primer. cDNA fragments were resolved by single capillary electrophoresis (Beckman CEQ 8000). The peak areas from the raw electropherogram were integrated and transformed into SHAPE reactivities using ShapeFinder software (Vasa et al. 2008).
Hydroxyl radical (•OH) footprinting was carried out following published protocols (Shcherbakova and Mitra 2009). Briefly, the reaction was initiated by adding 5 μL “reaction buffer” to 95 μL of 1 × 10⁵ cpm Lys1 to a final concentration of 0.1 mM Fe(NH4)2(SO4)2, 0.11 mM EDTA, and 6.6 mM sodium L-ascorbate. Oxidation of the RNA was allowed to proceed for 30 min at 25°C. The reaction was quenched with absolute ethanol, and the oxidized RNA products were precipitated and separated by denaturing gel electrophoresis using a 15% denaturing PAGE. The reaction products were visualized by exposure of the gel to a phosphor screen and scanned on a Molecular Dynamics Storm 820 Phosphorimager. The program SAFA (semi-automated footprinting analysis) (Das et al. 2005), was used to quantitate the intensity of the individual bands. The band densities were normalized to fractional protection. The peak profile was analyzed using GraphPad Prism 6.
Equilibrium binding
RNA aptamers were internally labeled with [α-32P]-GTP and allowed to bind to lysozyme for 1 h at room temperature. The bound complex was passed through a dual filter dot blot system attached to a vacuum manifold. The nitrocellulose membrane captures the aptamer–protein complexes while unbound aptamers are trapped by the nylon filter directly beneath. Both filters are visualized by phosphor storage imaging, and the fraction protein bound was calculated by determining the volume of radioactivity retained on the nitrocellulose divided by the total radioactivity retained by both filters. Although dual filters were used, we fit these data to fractional saturation  by
by
 |
(1) |
where f is the integrated band density; Kd is the equilibration dissociation constant; [L] is the ligand concentration; nH is the Hill coefficient; and LL and UL are the lower and upper limits, respectively (Senear et al. 1998). Since nH was equal to one within experimental error in all of the data analyzed, this parameter was fixed to 1.0 in the analysis of all of the binding curves shown.
Salt uptake and release is a stoichiometric component of protein–nucleic acid interactions. The Wyman linkage relationship provides a general formalism for the determination of the thermodynamic average of the number of ions (SK) taken up or released upon complex formation (Blakaj et al. 2006). Lysozyme–aptamer binding isotherms obtained in buffer containing NaCl at concentrations ranging from 0.005 to 0.60 M were used to determine SK from
 |
(2) |
where K is the equilibrium association constant, and m+ is the monovalent cation activity. Values of SK were determined by linear regression using GraphPad Prism 6. Extrapolation of the regression to the ordinate yields the electrostatic contribution to the binding reaction.
Analytical ultracentrifugation
Sedimentation velocity experiments were performed on a Beckman XL-I using a standard procedure (Cole et al. 2008; Mitra 2009). The rotor speed was 33,300 rpm, and data were collected at a wavelength of 260 nm. The program SEDNTERP was used to estimate the values of several hydrodynamic parameters including the density (ρ) and viscosity (η) of the buffer used (Laue et al. 1992). The data from each AUC cell was individually analyzed in DCDT+, using 0.53 cm3/g as the partial specific volume (ν) of the RNA, to determine the S20,w and D20,w values of the RNA aptamers under each buffer condition specified in Table 2 (Philo 2000).
Enzymatic activity
Turbidimetric assays
A standard lysozyme activity assay was used (Gorin et al. 1971; Grossowicz et al. 1979). Briefly, lyophilized Micrococcus lysodeikticus cells (Sigma-Aldrich) were suspended in the aptamer selection buffer at an OD450 = 0.6. An aliquot (250 μL) of suspended cells was placed in a microplate tray in which either nothing, HEWL (0.3 μM), RNA, or combination of HEWL and RNA was added (total volume 300 μL). Assay wells were measured for their absorbance at 450 nm for 1 h in a Synergy H4 Hybrid multimode microplate reader (Bio-Tek Instruments).
Chitopentaose hydrolysis assays
All hydrolysis assays were performed in 10 mM sodium acetate pH 5.2, 5 mM MgCl2 containing 1 mM of the N-acetyl chitopentaose substrate and 100 μM HEWL or a 1:1.1 HEWL:Lys1.2minE complex. Reactions were initiated by the addition of the substrate and were allowed to proceed for 15 min. The reaction was quenched with an equal volume of MALDI matrix (saturated 2,5-dihydroxybenzoicacid [2,5-DHB] in acetonitrile) and cocrystallized on a conventional stainless steel target. MALDI-TOF mass spectra were recorded on a 4800 Plus MALDI TOF/TOF Analyzer (Applied Biosystems).
X-ray diffraction data collection and crystallographic refinement
The lysozyme–Lys1.2minE complex was screened for crystallization by sitting drop vapor diffusion. The best diffracting crystals were grown from 0.17 M sodium acetate, 0.085 M Tris-HCl pH 8.5, 25.5% (w/v) PEG-4000, and 15% (v/v) glycerol. Crystals with overall dimensions 0.03 × 0.05 × 0.3 mm3 were mounted in cryoloops directly from the crystallization droplet and flash-cooled in liquid nitrogen. Diffraction data were collected on a Quantum 315 CCD detector (Area Detector Systems Corporation) with 1.075 Å wavelength radiation on the X29A beamline (National Synchrotron Light Source, Brookhaven National Laboratory). Intensities were integrated using the HKL2000 program and reduced to amplitudes using the SCALEPACK2MTZ program (Collaborative Computational Project 1994; Otwinowski and Minor 1997). The structure of the lysozyme–minE complex was determined using the molecular replacement method with PHASER (Storoni et al. 2004) and the PDB 3EMS lysozyme structure as a search model. Model building and refinement were performed with the programs COOT and REFMAC (Collaborative Computational Project 1994; Emsley and Cowtan 2004). The quality of the final structures were verified with composite omit maps, and stereochemistry was checked with the program MolProbity (Chen et al. 2010). LSQKAB and SSM algorithms were used for structural superpositions (Collaborative Computational Project 1994; Krissinel and Henrick 2004). Structural figures were prepared using PyMOL (Schrödinger, LLC) and Chimera (Pettersen et al. 2004).
NMR spectroscopy
NMR spectra were acquired at 600 MHz on a Bruker DRX spectrometer and processed using Xwinnmr. All 1D 1H spectra were acquired at 298K using 128 transients. For the NMR samples, 150 μM Lys1.2minE and 5 mM lysozyme stock solutions were separately prepared in folding buffer made up in 2H2O. Samples of the Lys1.2minE:HEWL complex were generated by direct mixing of HEWL with the aptamer to give aptamer:lysozyme ratios of 1:0, 1:0.5, 1:1, 1:1.5, 1:2, and 1:3.
DATA DEPOSITION
The structure factors and atomic coordinates for the Lys1.2minE–lysozyme and Lys1.2minF–lysozyme complex have been deposited into the Protein Data Bank as entries 4M4O and 4M6D, respectively.
ACKNOWLEDGMENTS
We thank Rafael Toro for help with the crystallization screening, the X29 beamline staff at NSLS for help with data collection, and Jennifer Aguilan at the proteomics facility at Albert Einstein College of Medicine for help with the mass spectrometry. This work was supported by grants from Stand Up 2 Cancer SU2C-AACR-IRG0809 (M.L.), National Cancer Institute at the National Institutes of Health 1R21CA157366 (M.L.), 1RO1-GM085130 (M.B.), and RO1-GM072085 (M.E.G.), NIH grants GM094662 (S.C.A.), GM094665 (S.C.A.), and the Albert Einstein Cancer Center (CA013330).
Footnotes
PDB IDs: 1OOA, 1U1Y, 1FJE, 3DD2, 3AGV, 3UZT.
PDB entries: 2WAR, 3EMS, 4AXT, 4B0D, 2YDG, 3RZ4, 3A8Z, 2VB1, 2HUB, 2B5Z, 1UC0, 1H87, 1JIY, 1DPX, 1LSZ.
REFERENCES
- Alderton G, Fevold HL 1946. Direct crystallization of lysozyme from egg white and some crystalline salts of lysozyme. J Biol Chem 164: 1–5 [PubMed] [Google Scholar]
- Allain FH, Bouvet P, Dieckmann T, Feigon J 2000. Molecular basis of sequence-specific recognition of pre-rRNA by nucleolin. EMBO J 19: 6870–6881 [DOI] [PMC free article] [PubMed] [Google Scholar]
- Bahar I, Chennubhotia C, Tobi D 2007. Instrinsic dynamics of enzymes in the unbound state and relation to allosteric regulation. Curr Opin Struct Biol 17: 633–640 [DOI] [PMC free article] [PubMed] [Google Scholar]
- Blakaj D, Kattamuri C, Khrapunov S, Hegde RS, Brenowitz M 2006. Indirect readout of DNA sequence by papillomavirus E2 proteins depends upon net cation uptake. J Mol Biol 358: 224–240 [DOI] [PubMed] [Google Scholar]
- Bouvet P, Allain FH, Finger LD, Dieckmann T, Feigon J 2001. Recognition of pre-formed and flexible elements of an RNA stem-loop by nucleolin. J Mol Biol 309: 763–775 [DOI] [PubMed] [Google Scholar]
- Bunka DH, Stockley PG 2006. Aptamers come of age – at last. Nat Rev Microbiol 4: 588–596 [DOI] [PubMed] [Google Scholar]
- Chen B, Arendall WB, Headd JJ, Keedy DA, Immormino RM, Kapral GJ, Murray LW, Richardson JS, Richardson DC 2010. MolProbity: All-atom structure validation for macromolecular crystallography. Acta Crystallogr D Biol Crystallogr 66: 12–21 [DOI] [PMC free article] [PubMed] [Google Scholar]
- Clarke P 1999. RNA footprinting and modification interference analysis. Methods Enzymol 118: 73–91 [DOI] [PubMed] [Google Scholar]
- Cole JL, Lary JW, P Moody T, Laue TM 2008. Analytical ultracentrifugation: Sedimentation velocity and sedimentation equilibrium. Methods Cell Biol 84: 143–179 [DOI] [PMC free article] [PubMed] [Google Scholar]
- Collaborative Computational Project, Number 4 1994. The CCP4 suite: Programs for protein crystallography. Acta Crystallogr D Biol Crystallogr 50: 760–763 [DOI] [PubMed] [Google Scholar]
- Convery M, Roswell S, Stonehouse NJ, Ellington AD, Hirao I, Murray JB, Peabody DS, Phillips SEV, Stockley PG 1998. Crystal structure of an RNA aptamer–protein complex at 2.8 Å resolution. Nat Struct Biol 5: 133–139 [DOI] [PubMed] [Google Scholar]
- Cowan J, Ohyama T, Wang D, Natarajan K 2000. Recognition of a cognate RNA aptamer by neomycin B: Quantitative evaluation of hydrogen bonding and electrostatic interactions. Nucleic Acids Res 28: 2935–2942 [DOI] [PMC free article] [PubMed] [Google Scholar]
- Cox C, Ellington AD 2001. Automated selection of anti-protein aptamers. Bioorg Med Chem 9: 2525–2531 [DOI] [PubMed] [Google Scholar]
- Das R, Laederach A, Pearlman SM, Herschlag D, Altman RB 2005. SAFA: Semi-automated footprinting analysis software for high through-put quantification of nucleic acid footprinting experiments. RNA 11: 344–354 [DOI] [PMC free article] [PubMed] [Google Scholar]
- Deigan KE, Li TW, Mathews DH, Weeks KM 2009. Accurate SHAPE-directed RNA structure determination. Proc Natl Acad Sci 106: 97–102 [DOI] [PMC free article] [PubMed] [Google Scholar]
- Di Palma F, Colizzi F, Bussi G 2013. Ligand-induced stabilization of the aptamer terminal helix in the add adenine riboswitch. RNA 19: 1–8 [DOI] [PMC free article] [PubMed] [Google Scholar]
- Draper DE 2008. RNA folding: Thermodynamic and molecular descriptions of the roles of ions. Biophys J 95: 5489–5495 [DOI] [PMC free article] [PubMed] [Google Scholar]
- Draper DE, Grilley D, Soto AM 2005. Ions and RNA folding. Annu Rev Biophys Biomol Struct 34: 221–243 [DOI] [PubMed] [Google Scholar]
- Ehresmann C, Bauin F, Mougel M, Romby P, Ebel JP, Ehresmann B 1987. Probing the structure of RNAs in solution. Nucleic Acids Res 15: 9109–9128 [DOI] [PMC free article] [PubMed] [Google Scholar]
- Emsley P, Cowtan K 2004. Coot: Model-building tools for molecular graphics. Acta Crystallogr D Biol Crystallogr 60: 2126–2132 [DOI] [PubMed] [Google Scholar]
- Fenton A 2008. Allostery: An illustrated definition for the ‘second secret of life’. Trends Biochem Sci 33: 420–425 [DOI] [PMC free article] [PubMed] [Google Scholar]
- Goodney N, Benkovic SJ 2008. Allosteric regulation and catalysis emerge via a common route. Nat Chem Biol 4: 474–482 [DOI] [PubMed] [Google Scholar]
- Gorin G, Wang SF, Papapavlou L 1971. Assay of lysozyme by its lytic action on M. lysodeikticus cells. Anal Biochem 39: 113–127 [DOI] [PubMed] [Google Scholar]
- Grossowicz N, Ariel M, Weber T 1979. Improved lysozyme assay in biological fluids. Clin Chem 25: 484–485 [PubMed] [Google Scholar]
- Hall B, Arshad S, Seo K, Bowman C, Corley M, Jhaveri SD, Ellington AD 2009. In vitro selection of RNA aptamers to a protein target by filter immobilization. Curr Protoc Mol Biol Chapter 24: Unit 24.3 [DOI] [PubMed] [Google Scholar]
- Horn W, Convery MA, Stonehouse NJ 2004. The crystal structure of a high affinity RNA stem-loop complexed with the bacteriophage MS2 capsid: Further challenges in the modeling of ligand–RNA interactions. RNA 10: 1776–1782 [DOI] [PMC free article] [PubMed] [Google Scholar]
- Huang D, Vu D, Cassiday LA, Zimmerman JM, Maher LJ III, Ghosh G 2003. Crystal structure of NF-κB (p50)2 complexed to a high-affinity RNA aptamer. Proc Natl Acad Sci 10: 9268–9273 [DOI] [PMC free article] [PubMed] [Google Scholar]
- Jayasena S 1999. Aptamers: An emerging class of molecules that rival antibodies in diagnostics. Clin Chem 45: 1628–1650 [PubMed] [Google Scholar]
- Keefe AD, Pai S, Ellington A 2010. Aptamers as therapeutics. Nat Rev Drug Discov 9: 537–550 [DOI] [PMC free article] [PubMed] [Google Scholar]
- Krissinel E, Henrick K 2004. Secondary-structure matching (SSM), a new tool for fast protein structure alignment in three dimensions. Acta Crystallogr D Biol Crystallogr 60: 2256–2268 [DOI] [PubMed] [Google Scholar]
- Kusser W 2000. Chemically modified nucleic acid aptamers for in vitro selections: Evolving evolution. J Biotechnol 74: 27–38 [DOI] [PubMed] [Google Scholar]
- Laue TM, Shah BD, Ridgeway TM, Pelletier SL 1992. Computer-aided interpretation of analytical sedimentation data for proteins. In Analytical ultracentrifugation in biochemistry and polymer science (ed. Harding SE, et al. ), pp. 90–125 The Royal Society of Chemistry, Cambridge, UK [Google Scholar]
- Lee JH, Canny MD, De Erkenez A, Krilleke D, Ng YS, Shima DT, Pardi A, Jucker F 2005. A therapeutic aptamer inhibits angiogenesis by specifically targeting the heparin binding domain of VEGF165. Proc Natl Acad Sci 102: 18902–18907 [DOI] [PMC free article] [PubMed] [Google Scholar]
- Leipply D, Lambert D, Draper DE 2009. Ion–RNA interactions: Thermodynamic analysis of the effects of mono- and divalent ions on RNA conformational equilibria. Methods Enzymol 469: 433–463 [DOI] [PMC free article] [PubMed] [Google Scholar]
- Long S, Long M, White R, Sullenger B 2008. Crystal structure of an RNA aptamer bound to thrombin. RNA 14: 2504–2512 [DOI] [PMC free article] [PubMed] [Google Scholar]
- Lukavsky P 2005. Structure determination of large biological RNAs. Methods Enzymol 394: 399–416 [DOI] [PubMed] [Google Scholar]
- Macaya RF, Schultze P, Smith FW, Roe JA, Feigon J 1993. Thrombin-binding DNA aptamer forms a unimolecular quadruplex structure in solution. Proc Natl Acad Sci 90: 3745–3749 [DOI] [PMC free article] [PubMed] [Google Scholar]
- Mitra S 2009. Using analytical ultracentrifugation (AUC) to measure global conformational changes accompanying equilibrium tertiary folding of RNA molecules. Methods Enzymol 469: 209–236 [DOI] [PubMed] [Google Scholar]
- Nilsen T, Rio D 2012. In vitro transcription of labeled RNA: Synthesis, capping and substitution. Cold Spring Harb Protoc 10.1101/pdb.prot072066 [DOI] [PubMed] [Google Scholar]
- Nomura Y, Sugiyama S, Sakamoto T, Miyakawa S, Adachi H, Takano K, Murakami S, Inoue T, Mori Y, Nakamura Y, et al. 2010. Conformation plasticity of RNA for target recognition as revealed by the 2.15 Å crystal structure of a human IgG–aptamer complex. Nucleic Acids Res 38: 7822–7829 [DOI] [PMC free article] [PubMed] [Google Scholar]
- Obayashi E, Oubridge C, Pomeranz Krummel D, Nagai K 2007. Crystallization of RNA–protein complexes. Methods Mol Biol 363: 259–276 [DOI] [PubMed] [Google Scholar]
- Otwinowski Z, Minor W 1997. Processing of x-ray diffraction data collected in oscillation mode. Methods Enzymol 276: 307–326 [DOI] [PubMed] [Google Scholar]
- Parker K, Steitz JA 1989. Determination of RNA-protein and RNA-ribonucleoprotein interactions by nuclease probing. Methods Enzymol 180: 454–468 [DOI] [PubMed] [Google Scholar]
- Pestourie C, Tavitian B, Duconge F 2005. Aptamers against extracellular targets for in vivo applications. Biochimie 87: 921–930 [DOI] [PubMed] [Google Scholar]
- Pettersen E, Goddard TD, Huang CC, Couch GS, Greenblatt DM, Meng EC, Ferrin TE 2004. UCSF Chimera—a visualization system for exploratory research and analysis. J Comput Chem 25: 1605–1612 [DOI] [PubMed] [Google Scholar]
- Philo J 2000. A method for directly fitting the time derivative of sedimentation velocity data and an alternative algorithm for calculating sedimentation coefficient distribution functions. Anal Biochem 279: 151–163 [DOI] [PubMed] [Google Scholar]
- Piasecki SK, Hall B, Ellington AD 2009. Nucleic acid pool preparation and characterization. Methods Mol Biol 535: 3–18 [DOI] [PubMed] [Google Scholar]
- Potty A, Kourentzi K, Fang H, Schuck P, Willson RC 2011. Biophysical characterization of DNA and RNA aptamer interactions with hen egg white lysozyme. Int J Biol Macromol 48: 392–397 [DOI] [PubMed] [Google Scholar]
- Reiter NJ, Maher LJ III, Butcher SE 2008. DNA mimicry by a high-affinity anti-NF-κB RNA aptamer. Nucleic Acids Res 36: 1227–1236 [DOI] [PMC free article] [PubMed] [Google Scholar]
- Senear D, Ross J, Laue TM 1998. Analysis of protein and DNA-mediated contributions to cooperative assembly of protein-DNA complexes. Methods 16: 3–20 [DOI] [PubMed] [Google Scholar]
- Shcherbakova I, Mitra S 2009. Hydroxyl radical footprinting to probe equilibrium changes in RNA tertiary structure. Methods Enzymol 468: 31–46 [DOI] [PubMed] [Google Scholar]
- Smestad J, Maher LJ III 2013. Ion-dependent conformational switching by a DNA aptamer that induces remyelination in a mouse model of multiple sclerosis. Nucleic Acids Res 41: 1329–1342 [DOI] [PMC free article] [PubMed] [Google Scholar]
- Storoni L, McCoy AJ, Read RJ 2004. Likelihood-enhanced fast rotation functions. Acta Crystallogr D Biol Crystallogr 60: 432–438 [DOI] [PubMed] [Google Scholar]
- Tesmer V, Lennarz S, Mayer G, Tesmer J 2012. Molecular mechanism for inhibition of a G protein-coupled receptor kinase 2 by a selective RNA aptamer. Structure 20: 1–10 [DOI] [PMC free article] [PubMed] [Google Scholar]
- Tullius TD, Greenbaum JA 2005. Mapping nucleic acid structure by hydroxyl radical cleavage. Curr Opin Chem Biol 9: 127–134 [DOI] [PubMed] [Google Scholar]
- Tzakos A, Grace C, Lukavsky PJ, Riek R 2006. NMR techniques for very large proteins and RNAs in solution. Annu Rev Biophys Biomol Struct 35: 319–342 [DOI] [PubMed] [Google Scholar]
- Uchida T, He Q, Ralston CY, Brenowitz M, Chance M 2002. Linkage of monovalent and divalent ion binding in the folding of the P4–P6 domain of the Tetrahymena ribozyme. Biochemistry 41: 5799–5806 [DOI] [PubMed] [Google Scholar]
- Vasa SM, Guex N, Wilkinson KA, Weeks KM, Giddings MC 2008. ShapeFinder: A software system for high-throughput quantitative analysis of nucleic acid reactivity information resolved by capillary electrophoresis. RNA 14: 1979–1990 [DOI] [PMC free article] [PubMed] [Google Scholar]
- Wilkinson KA, Merino EJ, Weeks KM 2006. Selective 2′-hydroxyl acylation analyzed by primer extension (SHAPE): Quantitative RNA structure analysis at single nucleotide resolution. Nat Protoc 1: 1610–1616 [DOI] [PubMed] [Google Scholar]
- Wilner S, Wengerter B, Maier K, Borba Magalhaes M, Soriano Del Amo D, Pai S, Opazo F, O Rizzoli S, Yan A, Levy M 2012. An RNA alternative to human transferrin: A new tool for targeting human cells. Mol Ther Nucleic Acids 1: 1–14 [DOI] [PMC free article] [PubMed] [Google Scholar]
- Ye X, Gorin A, Frederick R, Hu W, Majumdar A, Xu W, McLendon G, Ellington AD, Patel DJ 1999. RNA architecture dictates the conformations of a bound peptide. Chem Biol 6: 657–669 [DOI] [PubMed] [Google Scholar]
- Zuker M 2003. Mfold web server for nucleic acid folding and hybridization prediction. Nucleic Acids Res 31: 3406–3415 [DOI] [PMC free article] [PubMed] [Google Scholar]


