


Abstract
The goal of pE-DB (http://pedb.vib.be) is to serve as an openly accessible database for the deposition of structural ensembles of intrinsically disordered proteins (IDPs) and of denatured proteins based on nuclear magnetic resonance spectroscopy, small-angle X-ray scattering and other data measured in solution. Owing to the inherent flexibility of IDPs, solution techniques are particularly appropriate for characterizing their biophysical properties, and structural ensembles in agreement with these data provide a convenient tool for describing the underlying conformational sampling. Database entries consist of (i) primary experimental data with descriptions of the acquisition methods and algorithms used for the ensemble calculations, and (ii) the structural ensembles consistent with these data, provided as a set of models in a Protein Data Bank format. PE-DB is open for submissions from the community, and is intended as a forum for disseminating the structural ensembles and the methodologies used to generate them. While the need to represent the IDP structures is clear, methods for determining and evaluating the structural ensembles are still evolving. The availability of the pE-DB database is expected to promote the development of new modeling methods and leads to a better understanding of how function arises from disordered states.
INTRODUCTION
Intrinsically disordered proteins (IDPs) or intrinsically disordered regions within otherwise structured proteins are defined by the lack of a single static tertiary structure under physiological conditions (1–4). These proteins have multiple conformations that are separated by low free-energy barriers and consequently their structures constantly fluctuate between different states, giving rise to a dynamic ensemble of conformations. Disordered regions are ubiquitous in proteins involved in biological processes of DNA and RNA binding, transcription, translation, cell-cycle regulation and membrane fusion, and also often in pathologies associated with misfolding and aggregation, as observed in a variety of neurodegenerative diseases (5) and in the pathogenesis of many other human maladies (6). These regions may function as entropic chains (such as flexible linkers between folded domains or chains that exhibit elastomeric properties) or by transient (often modulated by posttranslational modifications) or permanent (such as scaffolds or effectors) partner binding (1–4). On binding, some IDPs gain a stable folded structure (i.e. folding on binding), while others retain much flexibility, forming ‘fuzzy’ complexes (7).
The existence and functioning of IDPs defy the classical structure–function paradigm and pose a serious conceptual challenge to understand how function derives from transitions between ensembles of disordered states and more limited conformations when bound to their biological targets. Experimentally, the disorder of IDPs has been traditionally inferred from residues missing in X-ray structures, Kratky plots from small-angle X-ray scattering (SAXS) measurements, data from nuclear magnetic resonance (NMR) experiments and a realm of low-resolution techniques, such as circular dichroism, fluorescence, infrared spectroscopy, etc. (6,8). Structural disorder can also be predicted computationally from the primary sequence, as disordered regions are enriched in specific disorder-promoting amino acids, such as Gly, Pro and charged residues, and depleted in order-promoting, mostly hydrophobic, amino acids (9,10). One of the most pressing and potentially rewarding challenges in the IDP field is to improve the experimental and computational methods to describe the structural and dynamic properties of IDPs and elucidate how their functions are mediated by their disordered states, which is anticipated to bring the advent of ‘unstructural biology’ (4).
Based on NMR and SAXS measurements, structural ensembles only started appearing in the literature ∼10 years ago (Table 1). These structural ensembles are still often criticized as being models that fit experimental observations but lack physical reality. It is difficult to argue against this critique because the structural ensembles themselves often are not deposited on publication, and only conclusions based on their analysis are described. Further, the variety of computational approaches proposed for the calculation of the structural ensembles have never been critically assessed and compared. We propose to remedy to this situation by launching pE-DB, which provides access to the primary experimental data, the algorithms used in their calculation and the coordinates of the structural ensembles themselves. We encourage the community to deposit structural ensembles of novel proteins and even to recalculate ensembles based on the primary experimental data.
Table 1.
Examples of recent structural ensembles, their underlying primary experimental data and computational methods developed to calculate them
| Protein | Ensemble calculation | Constraint(s) | Reference |
|---|---|---|---|
| α-synuclein | MD | PREs | (11) |
| DrkN SH3 | ENSEMBLE | CSs, 15N R2, RDC, PRE, J-couplings, NOEs, O2-derived 13C paramagnetic shifts, Rh, SAXS | (12) |
| NTail Measles | FM, ASTEROIDS | RDCs, PREs | (13) |
| p27-KID | MD | SAXS, AUC, NMR | (14) |
| pSic1/Cdc4 complex | ENSEMBLE | CSs, 15N R2, RDC, PRE, SAXS | (15) |
| Tau K18 | FM, ASTEROIDS | RDCs, PREs | (13) |
This table is not intended to be exhaustive, but only presents ensembles that contributed to the development of the concept and method development.
pE-DB is complementary to other disorder-related databases, such as DisProt (16), the database of binary disorder classification based on biophysical data, and two sequence-based disorder databases, D2P2 (17), which holds disorder predictions, and IDEAL (18), which contains manually curated annotations of IDP location, structure and functional sites. pE-DB is most closely related to Biological Magnetic Resonance Bank (BMRB) (19), which hosts primary NMR data linked to pE-DB, but no other type of experimental data or structural ensembles. pE-DB also has an interesting relationship with Protein Data Bank (PDB) (20), the major structural database that hosts X-ray- and NMR-derived structures of folded (ordered) proteins, resting on the principle that a protein has a single ‘real’ structure. Last but not least, pE-DB has a resemblance to the Ensemble Protein Database (http://www.epdb.pitt.edu/), which, however, holds sets of structures of folded proteins generated by computer simulation.
In the context of these related databases, pE-DB provides a forum for the deposition of models of structural ensembles of IDPs, which predictably will provide a platform for critical evaluation of ensemble calculation methods and eventually lead to the development of experimental and computational standards and protocols that will become accepted in the IDP field and beyond. We believe creating and publishing the database will stimulate the community to submit their data, and we hope to see a rapid increase in the entries/ensembles/structures deposited. We are committed to stimulating the field to grow and to eventually reach a state of deposition being the condition of acceptance of IDP structural work. We are convinced that this initiative offers the rich reward of bringing the IDP field to maturity through understanding the structural underpinning of IDP function in physiology and disease, with the ultimate prospect of developing novel drugs targeting IDPs involved in disease (21,22).
APPROACHING STRUCTURAL ENSEMBLES
Although a structural description of IDPs is not feasible using radiographic crystallography, other techniques, such as NMR experiments measuring chemical shifts (CSs), residual dipolar couplings (RDCs), 15N R2 relaxation rates, paramagnetic relaxation enhancement (PRE) distance restraints, J-couplings, pulsed field gradient (PFG)-derived hydrodynamic radius (Rh) values, 1H-15N heteronuclear nuclear overhauser effects and O2 (or other paramagnetic compound)-derived measures of accessibility and SAXS measurements can yield meaningful information on the distribution of their shape and size, short- and long-range contacts and backbone flexibility (23–25). CSs, the first output of any NMR characterization of an IDP, provide secondary structural propensities. These can nicely be compared with results of predictors and provide robust information about the structural and dynamic heterogeneity of a protein. NMR methods are under continuous development to enable the study of IDPs of increasing size and complexity (26). The information derived from NMR, combined with that available from SAXS, can be used to describe the structure of an IDP as an ensemble of conformations (24,25). There are two broad approaches to generating disordered state ensembles that fit experimental data (27). The first one is to drive molecular dynamics (MD) simulations so that a set of structures fit the data, called replica-averaged MD (28). The second involves the generation of a large number of conformations and selection of a subset that best fits the available data.
In the first approach, MD simulations are carried out to sample the conformational space accessible to a given protein. As the current force fields, however, do not provide exact representations of the interatomic interactions, the conformational space explored during the simulations is often not consistent with the available experimental measurements. To overcome this problem, an additional term is introduced in the force field that penalizes the deviations between the experimental measurements and the corresponding values back-calculated from the structures sampled during the simulations (11). This method is consistent with the maximum entropy principle, and thus provides the minimal modification of the force field required to obtain a conformational sampling consistent with the experimental data used as restraints (28). It is, however, not guaranteed to generate ensembles of structures consistent with experimental data not used as restraints, a result that would be achieved only when a sufficient number of restraints are used (29–32).
In the second approach, the procedure of ensemble calculation starts with generating a pool of a vast number of conformations. These conformations may be completely random or may already be constrained by experimental or theoretical data such as Ψ/Φ angles or secondary structure propensities. The programs most commonly used for this step are Flexible-Meccano (FM) (33), ensemble optimization method (EOM) (23,24) and TRaDES (34,35). MD simulations may also be used to provide a starting pool. The conformers generated may need to be completed, for example, FM conformers lack side chains that need to be modeled in with an algorithm such as SCCOMP (36) or SCRWL (37). After generating the starting pool, experimental data are back-calculated from the conformers to enable a direct comparison with actual observations. For SAXS data, programs are available, e.g. CRYSOL (38), to calculate scattering curves for each individual conformer. For NMR data, FM can estimate CSs [using ShiftX, SPARTA (39)] or related CS prediction approaches, RDCs using local alignment combined with long-range effects modulating RDC baselines, or global alignment, PREs accounting for local and long-range correlation times, SAXS (using CRYSOL) and J-coupling values for the generated conformer pools, or ENSEMBLE (40) can be used. ENSEMBLE uses CRYSOL for SAXS data, HYDROPRO (41) for NMR-derived Rh data, ShiftX (42) for CS data, a local-alignment approach (43) for RDCs and internal scripts for solvent accessibility, PREs, J-couplings, R2 relaxation rates and nuclear overhauser effect (NOE) values.
The aim of the ensemble calculation is to select a subset of conformers whose back-calculated values fit the actual experimental data coming from SAXS and NMR measurements. The software Gajoe, part of EOM, deals with the selection of the pool of conformers that fit the theoretical and experimental SAXS curves best. The program ASTEROIDS (25,44) starts from the statistical coil model derived from FM, and selects ensembles, iteratively repopulating underlying potential energy landscapes and recalculating all experimental data from each newly calculated ensembles. The approach uses a genetic algorithm to converge to ensembles whose elements are different in each ensemble, but that are in equal agreement with the experimental data, within the level of the experimental noise. The approach makes extensive use of cross-validation of data that are not used in the selection procedure to generally test the predictive nature of the approach and to guard against over-fitting. ENSEMBLE (40) similarly can select a subset of conformers on the basis of SAXS and a variety of different NMR data. The size of the final ensembles may range from only a few to hundreds of conformers. We note that while it is tempting to interpret each member of the ensemble as an existing conformational substate, it is important to remember that ensemble descriptions can only be considered as discrete representations of highly complex probability distribution functions.
The challenge that we face when calculating structural ensembles is to demonstrate that they provide an accurate representation of the range of conformations explored by proteins during their thermal fluctuations. It must be acknowledged that the ensemble description of IDPs has not yet reached the rigor of other protein structure disciplines, and thus has to be treated with care, although we must not forget either that PDB structures are also models describing experimental observations. First, the quality of the final ensemble depends strongly on the quality of the experimental data. Aggregation, degradation or sample purity issues can severely affect the reliability of measurements and hence of the corresponding ensembles. In case of techniques such as SAXS, experiments always yield interpretable results, i.e. data has to be carefully examined and controlled. Although the predictive nature of the different ensemble approaches can in principle be tested against data that are not included in the selection, this is rarely done in practice. Furthermore, if insufficient data are used (as is invariably the case), there could be multiple structural ensembles that are equally consistent with them, hence preventing an unambiguous answer to the problem of determining the correct structural ensemble. In addition, given the large number of degrees of freedom and the astronomical number of potential structures and IDP visits, multiple different ensembles can be always computed describing the experimental data with the same level of agreement, which will happen in all circumstances, as it is inherent to ensembles of disordered proteins. Despite these ambiguities, due to constraints coming from SAXS and NMR, the ensembles have to show similarities in hydrodynamic behavior and also in local structural preferences. The level of similarity, however, has to be established, and the purpose of pE-DB is to help resolve these issues and drive the development of robust methodologies and concepts for deriving physically realistic structural ensembles.
DATABASE STRUCTURE AND CONTENT
pE-DB is implemented as a relational MySQL database that consists of a core set of generic tables storing meta-information and dedicated modules for NMR and SAXS experimental parameters (Figure 1). The core tables record information on the proteins used in the experiments (e.g. sequence, molecular weight, mutations, posttranslational modifications, etc.), cross-links to relevant databases, such as UniProt (45), Ensembl (46), BMRB (19) or DisProt (16), the organisms and expression systems used and meta-information regarding the authors and—if applicable—related publications. The SAXS and NMR modules consist of multiple tables recording the complete description of the experiments.
Figure 1.

Structure of the pE-DB database. The relational data model of pE-DB consists of a set of tables organizing modules, all connected to the main table recording the four-letter unique pE-DB identifier. Supported data types have dedicated table sets, storing relevant information to provide full description of the structural ensembles, the calculation procedures and the underlying experimental data. The complete data scheme is available online under the ‘Documentation’ section.
Database entries have unique four-letter identifiers that are the primary keys used to link related tables to the core table. These identifiers connect the meta-information recorded in the database and the actual data files stored on the pE-DB file server. Three types of data files are stored locally: NMR-related values, i.e. lists of CSs, RDCs, PREs or J-couplings, scattering curves from SAXS measurements and sets of structural ensemble files in PDB format. Ensembles consist of a few dozen to hundreds (and possibly even more) of conformers and each entry may have more than one ensemble associated to it, since multiple ensembles may fit the experimental data equally well.
The database is open to submissions from the community and researchers are encouraged to submit their data to pE-DB using the online submission interface. Data submission is initiated by filling out a pre-submission form describing briefly the experiments and providing related publications, if applicable. Data can also be submitted before publication; in such cases, the entry will be released only after the date specified by the authors. Pre-submission forms are processed and if found suitable, the pE-DB crew contacts the submitters requesting additional data and information. Submitters are required to provide meta-information by filling out an online submission form, followed by uploading their experimental data and structural ensembles via secure FTP connection. Submissions are manually curated by experts in the field and only ensembles based on high-quality experimental data are considered for deposition.
USER INTERFACE AND WEB SITE FEATURES
Searching and browsing
The online user interface of pE-DB provides support for accessing data in multiple ways from browsing and quick searches to bulk downloads, complex queries and SQL commands.
pE-DB can be browsed according to different criteria, such as accession identifier, protein name and data type. Selecting any of these options leads to a list of pE-DB entries with relevant information depending on the selected browsing option. The number of entries per page can be specified using the scroll window next to the ‘Browse by’ label and pressing the ‘Go’ button.
Searching the database can be done by typing the query string at the ‘Search’ section at the top of the window. By default, this will search entries with any type of data and in every string category. Optionally, the type of the string can be specified with the scroll-down button next to the text field. The type of experimental data type can also be specified using the bottom menu of the section under the text field. Using the advanced search interface, an arbitrary number of query strings can be used. Again, the type of the string and the experimental data type can be specified, and users need to specify the Boolean operator (AND/OR). Both search methods return a list of matching entries with brief descriptions and direct links to download data (Figure 2).
Figure 2.

Search results in pE-DB. The basic search field or the advanced search option gets the user the ‘Search results’ screen. Here, entries corresponding to the search query are listed, displaying the title of the accessions, the pE-DB identifiers, authors and the underlying data types of the ensembles. A sample screenshot of one conformer from an ensemble is shown on the right side. Direct download links to the sequences, experimental data, structural ensembles and the complete archives can be found on the left side.
Advanced users may perform complex searches by using an online SQL terminal. The data scheme of the database required for formulating selection queries can be found under the ‘Documentation’ section of the Web site. Users may only carry out ‘SELECT’ type commands.
Data retrieval
The key for data retrieval from pE-DB is the unique identifier of each accession. In case of single entry downloads, users may navigate to the accession screen using any of the methods detailed above and select from various download options, i.e. downloading the complete data archive, only specific data types, sequences or structural ensembles.
Bulk downloading can be done by navigating to the ‘Download pE-DB’ section on the Web site. Here, the complete pE-DB can be downloaded as flat SQL file or tab-separated.sv file. NMR, SAXS and structural data along with nonredundant sequences (in FASTA format) may also be retrieved. By providing a list of pE-DB identifiers, users may download sets of sequences, experimental data, structural archives as well as complete entries.
ACCESSION SCREEN AND JMOL APPLET
The accession screen displays the available meta-information for a specific entry and provides direct download links to the experimental data and the structural ensembles (Figure 3). By default, only the ‘General information’ section is expanded, users may view other sections by pressing the ‘Show/Hide’ button found at the top right of each section.
Figure 3.
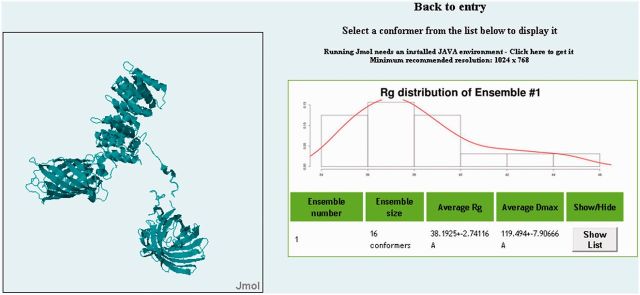
Jmol applet and list of conformers. Entries in pE-DB may have multiple ensembles, which may fit equally well the underlying experimental data. By navigating to the Jmol applet screen, the user can view the Rg distribution of each ensemble, the number of conformers and the average values for the Rg and the maximal distance (Dmax). By clicking on the ‘Show/Hide’ button, a list of the conformers appears, featuring Rg and Dmax values and a Jmol button. Clicking on the Jmol button, every single conformer can be selected to be visualized by a fully customizable Jmol applet.
The general information section displays the authors, a brief description of the entry and the data types used as constraints for the ensemble calculations. Below this section is a preview gallery of some of the conformers found in the ensembles. The left figure shows the most compact conformer, the middle figure shows a conformer close to the average Rg of the ensembles, while the right figure displays the most extended conformer. Clicking on any of these figures leads to a new window where users may find each ensemble and each conformer with its corresponding radius of gyration (Rg) and Dmax values. Each conformer can be visualized using a built-in customizable Jmol applet (Figure 4) (47,48).
Figure 4.
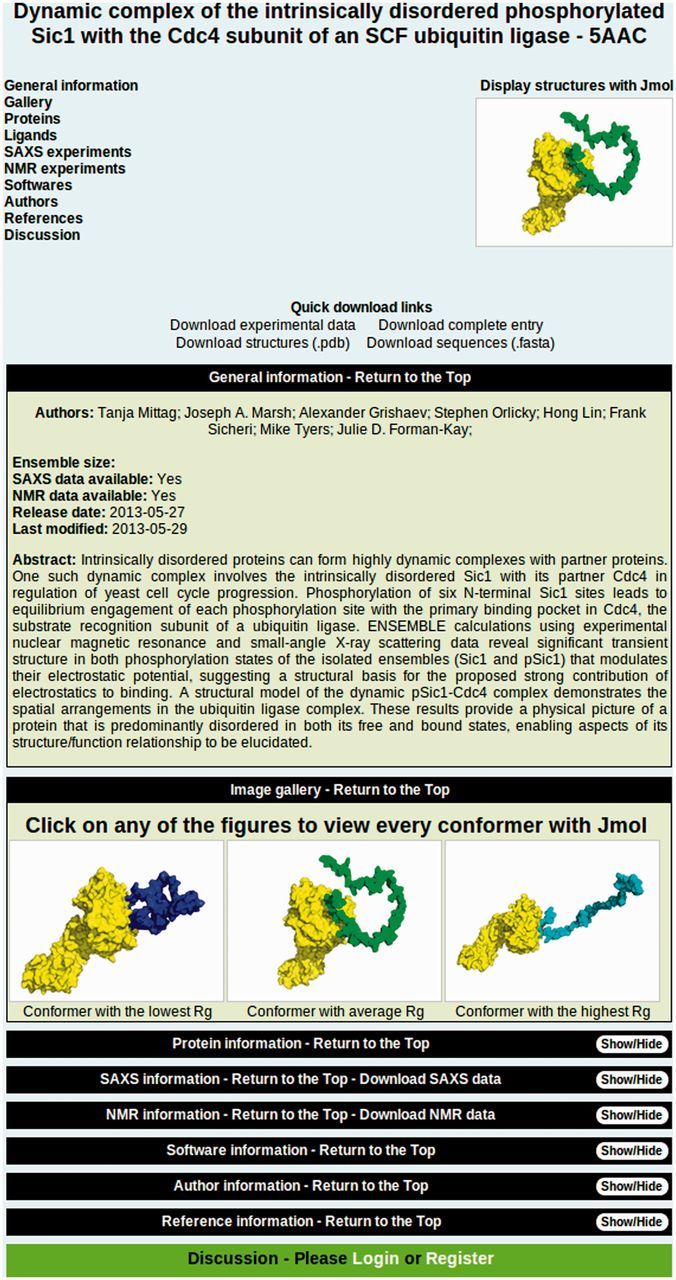
pE-DB entry screen. pE-DB entries display all the available meta-information for each accession, direct download links to various data types, sequences and structural ensembles, and a selection of figures and plot to visualize the data. The top field includes a table of contents on the left, with clickable links to the different sections and a sample figure that is a link to the Jmol applet used to visualize each conformation in the ensemble. The general information section contains a brief description of the entry and the list of the authors. The image gallery shows three conformers from the ensembles, one with the lowest radius of gyration (Rg) value, one with an Rg value closest to the ensemble average and a conformer with the highest Rg. These figures are clickable links leading to the Jmol screen. Below the gallery, different sections can be found, which are hidden by default, but can be opened by pressing the ‘Show/Hide’ buttons. At the bottom of each entry is a dedicated discussion section, where users may comment on the entry, sharing their thoughts on the ensembles, the underlying data or the calculation method.
The SAXS and NMR sections display experimental parameters and settings, as well as links to download the data archives, and in the case of SAXS data to visualize the scattering data with normalized Kratky plots, P(r) distance distribution plots, Guinier-plots and the scattering curve itself. In the case of NMR data, since CSs are the primary requirement of any NMR investigation, and thus always available, these are used to produce secondary structural propensity plots that indicate the propensity of different parts of the polypeptide chain to adopt secondary structural conformations. These are easy to inspect, rich of information on the structural and dynamic properties of a protein and can be compared with results of predictors, all features that are going to stimulate further progress. If applicable, a link to the corresponding BMRB entry is provided.
At the bottom of each accession is a dedicated discussion section, where registered users are encouraged to share their thoughts on the entry, the techniques used and the underlying data. Registration is fast, free and requires only a valid e-mail address.
AVAILABILITY
The database is freely available at http://pedb.vib.be. We encourage users to register free accounts, to be able to engage in discussions about the ensembles and their underlying calculation techniques at the discussion section of each entry. However, every other functionality of the database from complex queries to SQL command support and bulk download is accessible without the need for registration.
CONCLUSIONS AND OUTLOOK
We believe that the establishment of pE-DB represents a cornerstone in the evolution of the IDP field, opening the way to assessing and perfecting methodologies for the structural descriptions of the disordered state, a goal which is critical for developing quantitative structure–function models of IDPs (4,27). In this new era of structural biology, description of biomolecules as single static structures is increasingly recognized as being inadequate for understanding function. Rather, proteins must be described as ensembles of thermally accessible conformers. Since the pE-DB database represents a radical break with our traditional ways of looking at protein structures, it may also provoke novel modes of structure visualization addressing the multiplicity and dynamics of structures, such as by videos or continuum spatial functions. It follows form these notions that pE-DB will be complementary to more traditional databases, such as BMRB (19), which is mandated to host NMR-measurable information but not structural ensembles, and PDB (20), which is mandated to handle experiment-only well-defined structure coordinates. Neither PDB nor BMRB have the mandate or the capacity to handle the type of information contained in pE-DB, in which ensembles could be generated from NMR, SAXS, single-molecule fluorescence and other non-NMR techniques, integrated in model coordinate data rather than well-defined structure coordinates, which are not accepted by PDB either.
One has to be aware, of course, that the ensembles are not precise or complete representations of disordered states but rather models that fit a specifically defined subset of data, and unique solutions cannot be expected owing to the extreme conformational freedom of IDPs and the limited data (12,49). The more data we can incorporate into model building, however, the more realistic the ensemble will be, and the major ambition of pE-DB is to help stimulate and guide this process. It is important to have data of different types used for best results (i.e. at least some data on local or secondary structural propensities such as CSs, some data on global hydrodynamic properties such as SAXS or NMR PFG-derived Rh and some data on specific tertiary contacts such as PRE, etc.) because ensembles calculated with data from only a certain class will have limitations (i.e. a SAXS-refined ensemble will not provide information about the secondary structural elements, also encountered in PRE-refined ensembles. Conversely, ensembles with residue-specific information (CS and RDCs) will not properly describe a PRE profiles or a SAXS curve). Therefore, to help avoid overinterpretation, it is important to define (1) which data types and (2) how many restraints of each data type are used to calculate each of the ensembles. To complicate things, however, one also has to be careful to write that a particular restraint reports only on one aspect of the conformational behavior. For example, paramagnetic measurements are mainly used to describe transient long-range contacts, but the information they also provide concerning chain rigidity is usually overlooked because it is a more subtle, weaker dependence and maybe a less interesting aspect. The inverse is true for RDCs, where the more transient structure present in the ensemble, the more long-range order will affect the measured RDCs. CSs have also been used to report on transient long-range contacts, provided they are measured precisely enough. These different aspects of experiment parameters are outlined in Table 2.
Table 2.
The type of structural information obtained from the different types of experimental parameters used to calculate pE-DB ensembles
| Experimental parameter | Major conformational information for IDPs |
|---|---|
| NMR CSs | Local structural propensities (poly-proline II, α-helix and β-strand populations) |
| NMR PREs | Detection of distances between regions distant in primary sequence (one containing a spin-label) |
| NMR RDCs | Local structural propensities |
| Cooperativity of secondary structures | |
| Transient long-range interactions | |
| NMR spin relaxation (15N, 13C) | Differential rigidity |
| Local dynamic timescales and amplitudes | |
| NMR relaxation dispersion | Characterization of weakly populated states using CSs/RDCs (see above). |
| Conformational exchange on micro-millisecond timescales (folding/binding) | |
| Small angle scattering (SAXS/SANS) | Pairwise distribution function of long-range distances |
| FRET | Long-range interactions |
The present size of pE-DB is comparable with the initial size of PDB (then Brookhaven Data Bank), which started with seven structures in 1971 (20). Considering the importance of structural disorder, there can be no doubt that it will rapidly grow in size. To this end, we encourage researchers to submit their ensembles and the corresponding primary experimental data. We will also consider including additional types of data, such as fluorescence resonance energy transfer (FRET) data, which might rapidly gain importance in determining dynamic structures (50). The database already holds unfolded ensemble(s) of globular proteins (29), which may lead to a better understanding of protein folding, and also address the question as to whether IDPs are fundamentally different from denatured states of folded proteins [cf. the term ‘natively denatured proteins’ for IDPs (51)]. Furthermore, with the development of methods that are able to probe molecular motions on the timescale of ps to ns or beyond, the deposition of structural ensembles might be of direct relevance for structured proteins that populate multiple conformational substates in the course of fulfilling their biological functions, as in allostery or enzyme catalysis, for example (15).
In conjunction with these goals, the database will help establish the quality, reliability and descriptive power of structural ensembles. Current ensembles are often criticized but never critically evaluated, and the ready availability of supporting data in pE-DB will now enable development of standard methods for analysis and quality control. Three types of analyses can be anticipated. It is straightforward to analyze the structural features of ensembles, such as distribution of secondary structure or hydrodynamic parameters. More demanding will be to establish whether ensembles are realistic in terms of the distribution of conformational energies and agreement with the primary restraint data. Last but not least, there is a fundamental need to understand the connection between structural ensembles and protein function. Often, arguments about the function of an IDP are elaborated on the basis of knowledge of the target-bound, folded state, with total neglect of the dynamics and structural distribution of the unbound state.
To stimulate further development of the field, we also encourage users to recalculate ensembles, deposit them in the database and assess the quality of different versions. These efforts will all contribute to development and acceptance of standardized protocols for quality control, for eventual incorporation into the pE-DB data deposition pipeline. In the medium- or long-term, we even anticipate that a competition analogous to the Critical Assessment of Structure Prediction (52) could be implemented for de novo calculation of structural ensembles of IDPs. The real transition in the life of the database will come when demands from the community for data deposition as a requirement of publication will be raised; in the digital world, it certainly will not take 18 years as in the case of the PDB (20). Either way, if we accomplish all these goals, this novel structural resource will help to extend the structure–function paradigm to include the disordered state of proteins (4) and will aid the development of therapeutics for debilitating diseases such as cancer and neurodegeneration (21,22).
FUNDING
Funding for open access charge: Odysseus [G.0029.12] from Research Foundation Flanders (FWO); European Commission (7th Framework Programme) [IDPbyNMR], contract number 264257.
Conflict of interest statement. None declared.
REFERENCES
- 1.Dunker AK, Silman I, Uversky VN, Sussman JL. Function and structure of inherently disordered proteins. Curr. Opin. Struct. Biol. 2008;18:756–764. doi: 10.1016/j.sbi.2008.10.002. [DOI] [PubMed] [Google Scholar]
- 2.Dyson HJ, Wright PE. Intrinsically unstructured proteins and their functions. Nat. Rev. Mol. Cell Biol. 2005;6:197–208. doi: 10.1038/nrm1589. [DOI] [PubMed] [Google Scholar]
- 3.Tompa P. Intrinsically unstructured proteins. Trends Biochem. Sci. 2002;27:527–533. doi: 10.1016/s0968-0004(02)02169-2. [DOI] [PubMed] [Google Scholar]
- 4.Tompa P. Unstructural biology coming of age. Curr. Opin. Struct. Biol. 2011;21:419–425. doi: 10.1016/j.sbi.2011.03.012. [DOI] [PubMed] [Google Scholar]
- 5.Chiti F, Dobson CM. Protein misfolding, functional amyloid, and human disease. Annu. Rev. Biochem. 2006;75:333–366. doi: 10.1146/annurev.biochem.75.101304.123901. [DOI] [PubMed] [Google Scholar]
- 6.Uversky VN, Oldfield CJ, Dunker AK. Intrinsically disordered proteins in human diseases: introducing the D2 concept. Annu. Rev. Biophys. 2008;37:215–246. doi: 10.1146/annurev.biophys.37.032807.125924. [DOI] [PubMed] [Google Scholar]
- 7.Tompa P, Fuxreiter M. Fuzzy complexes: polymorphism and structural disorder in protein-protein interactions. Trends Biochem. Sci. 2008;33:2–8. doi: 10.1016/j.tibs.2007.10.003. [DOI] [PubMed] [Google Scholar]
- 8.Eliezer D. Biophysical characterization of intrinsically disordered proteins. Curr. Opin. Struct. Biol. 2009;19:23–30. doi: 10.1016/j.sbi.2008.12.004. [DOI] [PMC free article] [PubMed] [Google Scholar]
- 9.Dunker AK, Lawson JD, Brown CJ, Romero P, Oh JS, Oldfield CJ, Campen AM, Ratliff CM, Hipps KW, Ausio J, et al. Intrinsically disordered protein. J. Mol. Graph. Model. 2001;19:26–59. doi: 10.1016/s1093-3263(00)00138-8. [DOI] [PubMed] [Google Scholar]
- 10.Uversky VN, Gillespie JR, Fink AL. Why are “natively unfolded” proteins unstructured under physiologic conditions? Proteins. 2000;41:415–427. doi: 10.1002/1097-0134(20001115)41:3<415::aid-prot130>3.0.co;2-7. [DOI] [PubMed] [Google Scholar]
- 11.Allison JR, Varnai P, Dobson CM, Vendruscolo M. Determination of the free energy landscape of alpha-synuclein using spin label nuclear magnetic resonance measurements. J. Am. Chem. Soc. 2009;131:18314–18326. doi: 10.1021/ja904716h. [DOI] [PubMed] [Google Scholar]
- 12.Marsh JA, Forman-Kay JD. Ensemble modeling of protein disordered states: experimental restraint contributions and validation. Proteins. 2011;80:556–572. doi: 10.1002/prot.23220. [DOI] [PubMed] [Google Scholar]
- 13.Ozenne V, Schneider R, Yao M, Huang JR, Salmon L, Zweckstetter M, Jensen MR, Blackledge M. Mapping the potential energy landscape of intrinsically disordered proteins at amino acid resolution. J. Am. Chem. Soc. 2012;134:15138–15148. doi: 10.1021/ja306905s. [DOI] [PubMed] [Google Scholar]
- 14.Galea CA, Nourse A, Wang Y, Sivakolundu SG, Heller WT, Kriwacki RW. Role of intrinsic flexibility in signal transduction mediated by the cell cycle regulator, p27 Kip1. J. Mol. Biol. 2008;376:827–838. doi: 10.1016/j.jmb.2007.12.016. [DOI] [PMC free article] [PubMed] [Google Scholar]
- 15.Popovych N, Sun S, Ebright RH, Kalodimos CG. Dynamically driven protein allostery. Nat. Struct. Mol. Biol. 2006;13:831–838. doi: 10.1038/nsmb1132. [DOI] [PMC free article] [PubMed] [Google Scholar]
- 16.Sickmeier M, Hamilton JA, LeGall T, Vacic V, Cortese MS, Tantos A, Szabo B, Tompa P, Chen J, Uversky VN, et al. DisProt: the database of disordered proteins. Nucleic Acids Res. 2007;35:D786–D793. doi: 10.1093/nar/gkl893. [DOI] [PMC free article] [PubMed] [Google Scholar]
- 17.Oates ME, Romero P, Ishida T, Ghalwash M, Mizianty MJ, Xue B, Dosztanyi Z, Uversky VN, Obradovic Z, Kurgan L, et al. D(2)P(2): database of disordered protein predictions. Nucleic Acids Res. 2013;41:D508–D516. doi: 10.1093/nar/gks1226. [DOI] [PMC free article] [PubMed] [Google Scholar]
- 18.Fukuchi S, Sakamoto S, Nobe Y, Murakami SD, Amemiya T, Hosoda K, Koike R, Hiroaki H, Ota M. IDEAL: intrinsically disordered proteins with extensive annotations and literature. Nucleic Acids Res. 2012;40:D507–D511. doi: 10.1093/nar/gkr884. [DOI] [PMC free article] [PubMed] [Google Scholar]
- 19.Ulrich EL, Akutsu H, Doreleijers JF, Harano Y, Ioannidis YE, Lin J, Livny M, Mading S, Maziuk D, Miller Z, et al. BioMagResBank. Nucleic Acids Res. 2008;36:D402–D408. doi: 10.1093/nar/gkm957. [DOI] [PMC free article] [PubMed] [Google Scholar]
- 20.Berman HM. The protein data bank: a historical perspective. Acta Crystallogr. A. 2008;64:88–95. doi: 10.1107/S0108767307035623. [DOI] [PubMed] [Google Scholar]
- 21.Cheng Y, LeGall T, Oldfield CJ, Mueller JP, Van YY, Romero P, Cortese MS, Uversky VN, Dunker AK. Rational drug design via intrinsically disordered protein. Trends Biotechnol. 2006;24:435–442. doi: 10.1016/j.tibtech.2006.07.005. [DOI] [PubMed] [Google Scholar]
- 22.Metallo SJ. Intrinsically disordered proteins are potential drug targets. Curr. Opin. Chem. Biol. 2010;14:481–488. doi: 10.1016/j.cbpa.2010.06.169. [DOI] [PMC free article] [PubMed] [Google Scholar]
- 23.Bernado P, Mylonas E, Petoukhov MV, Blackledge M, Svergun DI. Structural characterization of flexible proteins using small-angle X-ray scattering. J. Am. Chem. Soc. 2007;129:5656–5664. doi: 10.1021/ja069124n. [DOI] [PubMed] [Google Scholar]
- 24.Bernado P, Svergun DI. Structural analysis of intrinsically disordered proteins by small-angle X-ray scattering. Mol. Biosyst. 2012;8:151–167. doi: 10.1039/c1mb05275f. [DOI] [PubMed] [Google Scholar]
- 25.Schneider R, Huang JR, Yao M, Communie G, Ozenne V, Mollica L, Salmon L, Jensen MR, Blackledge M. Towards a robust description of intrinsic protein disorder using nuclear magnetic resonance spectroscopy. Mol. Biosyst. 2012;8:58–68. doi: 10.1039/c1mb05291h. [DOI] [PubMed] [Google Scholar]
- 26.Felli IC, Pierattelli R. Recent progress in NMR spectroscopy: toward the study of intrinsically disordered proteins of increasing size and complexity. IUBMB Life. 2012;64:473–481. doi: 10.1002/iub.1045. [DOI] [PubMed] [Google Scholar]
- 27.Fisher CK, Stultz CM. Constructing ensembles for intrinsically disordered proteins. Curr. Opin. Struct. Biol. 2011;21:426–431. doi: 10.1016/j.sbi.2011.04.001. [DOI] [PMC free article] [PubMed] [Google Scholar]
- 28.Cavalli A, Camilloni C, Vendruscolo M. Molecular dynamics simulations with replica-averaged structural restraints generate structural ensembles according to the maximum entropy principle. J. Chem. Phys. 2013;138:094112. doi: 10.1063/1.4793625. [DOI] [PubMed] [Google Scholar]
- 29.Huang JR, Grzesiek S. Ensemble calculations of unstructured proteins constrained by RDC and PRE data: a case study of urea-denatured ubiquitin. J. Am. Chem. Soc. 2010;132:694–705. doi: 10.1021/ja907974m. [DOI] [PubMed] [Google Scholar]
- 30.Wu KP, Weinstock DS, Narayanan C, Levy RM, Baum J. Structural reorganization of alpha-synuclein at low pH observed by NMR and REMD simulations. J. Mol. Biol. 2009;391:784–796. doi: 10.1016/j.jmb.2009.06.063. [DOI] [PMC free article] [PubMed] [Google Scholar]
- 31.Rozycki B, Kim YC, Hummer G. SAXS ensemble refinement of ESCRT-III CHMP3 conformational transitions. Structure. 2011;19:109–116. doi: 10.1016/j.str.2010.10.006. [DOI] [PMC free article] [PubMed] [Google Scholar]
- 32.Nath A, Sammalkorpi M, DeWitt DC, Trexler AJ, Elbaum-Garfinkle S, O'Hern CS, Rhoades E. The conformational ensembles of alpha-synuclein and tau: combining single-molecule FRET and simulations. Biophys. J. 2012;103:1940–1949. doi: 10.1016/j.bpj.2012.09.032. [DOI] [PMC free article] [PubMed] [Google Scholar]
- 33.Ozenne V, Bauer F, Salmon L, Huang JR, Jensen MR, Segard S, Bernado P, Charavay C, Blackledge M. Flexible-meccano: a tool for the generation of explicit ensemble descriptions of intrinsically disordered proteins and their associated experimental observables. Bioinformatics. 2012;28:1463–1470. doi: 10.1093/bioinformatics/bts172. [DOI] [PubMed] [Google Scholar]
- 34.Feldman HJ, Hogue CW. A fast method to sample real protein conformational space. Proteins. 2000;39:112–131. [PubMed] [Google Scholar]
- 35.Feldman HJ, Hogue CW. Probabilistic sampling of protein conformations: new hope for brute force? Proteins. 2002;46:8–23. [PubMed] [Google Scholar]
- 36.Eyal E, Najmanovich R, McConkey BJ, Edelman M, Sobolev V. Importance of solvent accessibility and contact surfaces in modeling side-chain conformations in proteins. J. Comput. Chem. 2004;25:712–724. doi: 10.1002/jcc.10420. [DOI] [PubMed] [Google Scholar]
- 37.Canutescu AA, Shelenkov AA, Dunbrack RL., Jr A graph-theory algorithm for rapid protein side-chain prediction. Protein Sci. 2003;12:2001–2014. doi: 10.1110/ps.03154503. [DOI] [PMC free article] [PubMed] [Google Scholar]
- 38.Svergun DI, Barberato C, Koch MHJ. CRYSOL—a program to evaluate x-ray solution scattering of biological macromolecules from atomic coordinates. J. Appl. Cryst. 1995;28:768–773. [Google Scholar]
- 39.Shen Y, Bax A. Protein backbone chemical shifts predicted from searching a database for torsion angle and sequence homology. J. Biomol. NMR. 2007;38:289–302. doi: 10.1007/s10858-007-9166-6. [DOI] [PubMed] [Google Scholar]
- 40.Krzeminski M, Marsh JA, Neale C, Choy WY, Forman-Kay JD. Characterization of disordered proteins with ENSEMBLE. Bioinformatics. 2013;29:398–399. doi: 10.1093/bioinformatics/bts701. [DOI] [PubMed] [Google Scholar]
- 41.Garcia De La Torre J, Huertas ML, Carrasco B. Calculation of hydrodynamic properties of globular proteins from their atomic-level structure. Biophys. J. 2000;78:719–730. doi: 10.1016/S0006-3495(00)76630-6. [DOI] [PMC free article] [PubMed] [Google Scholar]
- 42.Neal S, Nip AM, Zhang H, Wishart DS. Rapid and accurate calculation of protein 1H, 13C and 15N chemical shifts. J. Biomol. NMR. 2003;26:215–240. doi: 10.1023/a:1023812930288. [DOI] [PubMed] [Google Scholar]
- 43.Marsh JA, Baker JM, Tollinger M, Forman-Kay JD. Calculation of residual dipolar couplings from disordered state ensembles using local alignment. J. Am. Chem. Soc. 2008;130:7804–7805. doi: 10.1021/ja802220c. [DOI] [PubMed] [Google Scholar]
- 44.Salmon L, Nodet G, Ozenne V, Yin G, Jensen MR, Zweckstetter M, Blackledge M. NMR characterization of long-range order in intrinsically disordered proteins. J. Am. Chem. Soc. 2010;132:8407–8418. doi: 10.1021/ja101645g. [DOI] [PubMed] [Google Scholar]
- 45.Consortium TU. Update on activities at the universal protein resource (UniProt) in 2013. Nucleic Acids Res. 2013;41:D43–D47. doi: 10.1093/nar/gks1068. [DOI] [PMC free article] [PubMed] [Google Scholar]
- 46.Flicek P, Ahmed I, Amode MR, Barrell D, Beal K, Brent S, Carvalho-Silva D, Clapham P, Coates G, Fairley S, et al. Ensembl 2013. Nucleic Acids Res. 2013;41:D48–D55. doi: 10.1093/nar/gks1236. [DOI] [PMC free article] [PubMed] [Google Scholar]
- 47.Hanson J. Jmol - a paradigm shift in crystallographic visualization. J. Appl. Crystallogr. 2010;43:1250–1260. [Google Scholar]
- 48.Hason RM, Prilusky J, Renjian Z, Nakane T, Sussman JL. JSmol and the next-generation web-based representation of 3D molecular structure as applied to proteopedia. Israel J. Chem. 2013;53:207–216. [Google Scholar]
- 49.Jensen MR, Ruigrok RW, Blackledge M. Describing intrinsically disordered proteins at atomic resolution by NMR. Curr. Opin. Struct. Biol. 2013;23:426–435. doi: 10.1016/j.sbi.2013.02.007. [DOI] [PubMed] [Google Scholar]
- 50.Kalinin S, Peulen T, Sindbert S, Rothwell PJ, Berger S, Restle T, Goody RS, Gohlke H, Seidel CA. A toolkit and benchmark study for FRET-restrained high-precision structural modeling. Nat. Methods. 2012;9:1218–1225. doi: 10.1038/nmeth.2222. [DOI] [PubMed] [Google Scholar]
- 51.Dunker AK, Babu MM, Barbar E, Blackledge M, Bondos SE, Dosztányi Z, Dyson HJ, Forman-Kay J, Fuxreiter M, Gsponer J, et al. What’s in a name? why these proteins are intrinsically disordered. Intrinsic. Disord. Proteins. 2013;1:e24157. doi: 10.4161/idp.24157. [DOI] [PMC free article] [PubMed] [Google Scholar]
- 52.Nugent T, Cozzetto D, Jones DT. Evaluation of predictions in the CASP10 model refinement category. Proteins. 2013 doi: 10.1002/prot.24377. (epub ahead of print July 31, 2013) [DOI] [PMC free article] [PubMed] [Google Scholar]