

Abstract
Living organisms change their proteome dramatically to sustain a stable internal milieu in fluctuating environments. To study the dynamics of proteins during stress, we measured the localization and abundance of the Saccharomyces cerevisiae proteome under various growth conditions and genetic backgrounds using the GFP collection. We created a database (DB) called ‘LoQAtE’ (Localizaiton and Quantitation Atlas of the yeast proteomE), available online at http://www.weizmann.ac.il/molgen/loqate/, to provide easy access to these data. Using LoQAtE DB, users can get a profile of changes for proteins of interest as well as querying advanced intersections by either abundance changes, primary localization or localization shifts over the tested conditions. Currently, the DB hosts information on 5330 yeast proteins under three external perturbations (DTT, H2O2 and nitrogen starvation) and two genetic mutations [in the chaperonin containing TCP1 (CCT) complex and in the proteasome]. Additional conditions will be uploaded regularly. The data demonstrate hundreds of localization and abundance changes, many of which were not detected at the level of mRNA. LoQAtE is designed to allow easy navigation for non-experts in high-content microscopy and data are available for download. These data should open up new perspectives on the significant role of proteins while combating external and internal fluctuations.
INTRODUCTION
The budding yeast Saccharomyces cerevisiae robustly adapts to a variety of fluctuations such as extreme environments, genetic mutations and life phases. Many cellular components within the cell (such as DNA, RNA, proteins and lipids) rearrange dynamically to promote survival (1–17). However, although vast amounts of data have been collected on chromatin modifications and transcriptional responses under changing conditions, only a handful of pioneering studies describe the dynamics of proteins (2,9–11). To enable a broader view of the proteomic response under varying conditions, we constructed an automated microscopy setup that allows reproducible, accurate and sensitive measurements of the localization and abundance of fluorescently tagged proteins at single-cell resolution. Using this setup, we visualized the yeast Green Fluorescence Protein (GFP) library in which nearly 5500 yeast proteins are tagged with a C’ terminal GFP under their natural promoter (18). Visualizing all strains under various internal and external fluctuations, we found >100 proteins that could be detected for the first time and determined their subcellular localization (4). We then tracked proteome-level changes using two methods: first, we classified proteins into 13 localization categories and detected hundreds of proteins that shift between different cellular locals under stress (4,19). We then computed abundance based on the fluorescence intensity of the GFP signal and found all proteins that change their abundance (4,19). Comparison with transcriptome data (14) demonstrated that up to 60% of proteomic changes could not be predicted from the dynamics of their transcripts, therefore, emphasizing the importance of studying proteins directly (20,21). To easily browse and download all aspects of these data, we built the LOcalization and Quantitation ATlas of the yeast proteomE (LoQAtE) database (DB). The current article presents how ‘LoQAtE’ can be easily used for uncovering new biological phenomena.
DATABASE DESIGN AND IMPLEMENTATION
The DB is constructed such that both browsing for a protein of interest and advanced intersections of various parameters can be performed easily. LoQAtE holds information on 328 localization shifts of proteins from one organelle to another and 1400 abundance change events. Each change may contribute directly to the ability of the cell to respond to the perturbation studied, or it can serve as a marker for cellular changes if it is a downstream effect of the stress. Using LoQAtE, such changes can be uncovered and studied in several methods:
Studying a specific protein
Quick search
The most simple utility of the DB is to insert a single name or a tab-delimited list of open reading frames (ORFs)/gene names (for an example of the results screen see Figure 1A) and receive a ‘quick search’ result. This result presents the localization and abundance of all proteins of interest under all conditions tested as well as the ‘fold change’ of protein abundance in each condition relative to a control baseline condition (synthetic defined medium) and a statistical assessment of the significance of this change. Full results including the microscopic images are presented for up to 100 proteins (to enable rapid display of the search results). At any moment, the full list of results can be downloaded either as a csv file summarizing the data or as a folder of the raw images. For ease of utility the default channel shown in the results screen is the GFP channel; however, the bright field image is available in a clickable fashion.
Figure 1.
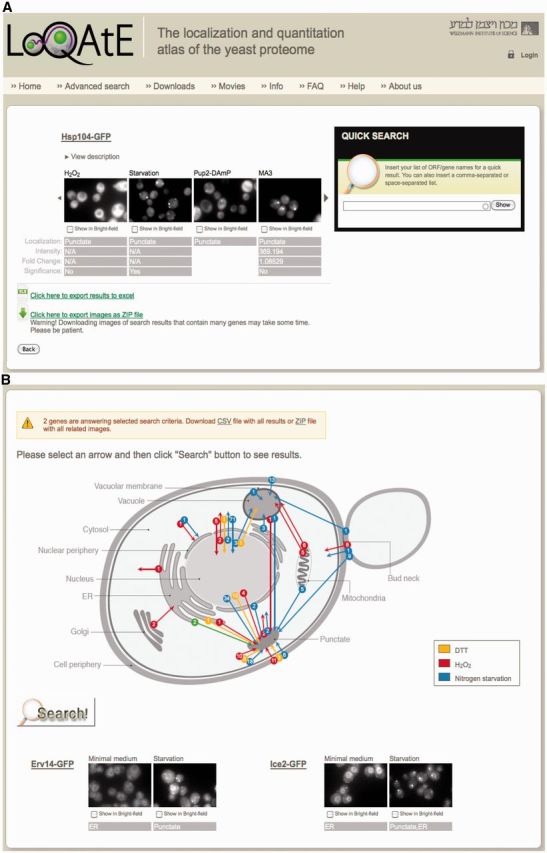
Screen shots of two result windows in a LoQAtE search. The LoQAtE allows various search functions to be performed. Both quick search and advanced search (Search by abundance or localization) (A) enables querying for large groups of proteins and results in the entire localization and abundance data for each protein being presented. In addition, the results of each search can be downloaded in an excel table or as raw images. ‘Search by movement’ (B) allows the user to choose a movement of interest represented as an arrow on a schematic representation of the cell and receive information on all proteins that are assigned to this category.
Studying a group of proteins
The ability to search by more advanced criteria enables users to uncover patterns in protein behavior that may not have been revealed by examining a single protein. For example, categorizing groups of proteins that shift their localization from the same origin to the same target organelle may allow a unique view on the functional changes in each organelle, provide a basis for analysis of the factors mediating these movements or may uncover a joint function. In another example, regulatory elements may be found for groups of proteins that are down/upregulated concordantly. We have, therefore, built several interfaces to enable advanced queries of the data and to enable such grouping.
Advanced search
1. Search by localization
It allows the user to choose all proteins localized to a specific organelle/s in a defined condition. In each query, one condition can be chosen and as many as 13 localization categories (or ‘below threshold’ that represents no expression) can be picked. Results are presented and can be downloaded as described earlier in text.
2. Search by abundance
It allows the user to choose a set of proteins that changed abundance concordantly for a specific condition or for several conditions in an ‘AND’ relation. To use this option, one or more growth conditions should be chosen, and for each, the type of abundance change (upregulated, no change or downregulated) should be defined. Additionally, the user can filter results to a specific organelle. Results are presented and can be downloaded as described earlier in text.
3. Search by movement
A schematic diagram depicting the types and numbers of changes in cellular localization observed during yeast growth in the three environmental stresses is available. In a clickable fashion, the user can choose one arrow (representative of one type of localization shift in a specific condition) and click the search button. Results provide the entire list of proteins classified as undergoing this shift and can be downloaded as described earlier in text (Figure 1B).
Using the advanced search to study transcriptional networks
Using the data in LoQAtE provides the opportunity to uncover important layers of cellular function that could not have been uncovered by mRNA levels alone. Uncovering the extent of post-transcriptional regulation can be easily done by comparing all changes observed under a specific condition with the transcriptional response under this condition (14). These types of data may potentially be further characterized to define mRNA motifs or secondary structures affecting translation efficiency or mRNA stability as well as protein level signals such as stress-dependent degrons or binding motifs that affect protein abundance in the absence of transcription.
To demonstrate one such utility, we have used the ‘Search by Abundance’ and ‘Search by Movement’ to retrieve the entire group of transcription factors (TFs) that change abundance or localization during nitrogen starvation out of a list of all predicted and known TFs in yeast (courtesy of Professor Eran Segal) (see Figure 2A and B). Interestingly, comparing these 33 proteins with their mRNA levels under the exact same conditions uncovered that the transcripts of 48% of them had no detectable change (14). To uncover the potential affect of these post-transcriptional changes on adaptation to starvation we used YEASTRACT (22–24) to predict their potential targets. Then, we calculated the percentage of abundance changes discovered in LoQAtE that can be explained by these TFs (see Figure 2C). Intriguingly, an astounding fraction of changes in protein levels measured under nitrogen starvation could be explained by the post-transcriptional changes of this handful of TFs. As these conditions have been extensively studied from the transcriptional perspective (14) without the post-transcriptional knowledge, this means that the conclusions reached might have been incomplete.
Figure 2.
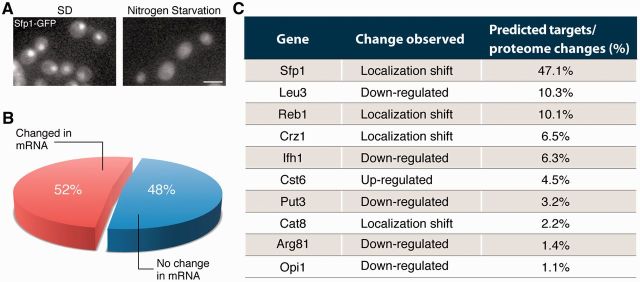
Application of LoQAtE to study regulatory networks. Two advanced search options were used to put-together a list of all yeast TFs that changed abundance (search by abundance) or localization (search by movement). (A) Example of change in localization during nitrogen starvation. Scale bar represents 5 µ. (B) The list of 33 TFs was compared with microarray data on expression changes under the same stress condition (14) to uncover that 16 of them were not documented to have any change in their transcripts under the exact same experimental conditions. (C) Using the DB for regulatory motifs (YEASTRACT), we extracted the targets for these 16 TFs and found that an enormous fraction of all changes in protein levels found in LoQAtE during nitrogen starvation (using the Search by Abundance option) (22–24) can be explained by 10 of the TFs.
SIMILAR DATABASES
LoQAtE DB is the first ever resource that particularly concentrates on the dynamic characteristics of the yeast proteome. The growing interest in directly measuring proteomic features has brought about several additional DBs presenting systematic proteomic data. The pioneering yeast localization DB (http://yeastgfp.yeastgenome.org/) provides information about the localization and abundance of the majority of yeast proteins under standard laboratory growth conditions based on the construction of the GFP collection (18). Additionally, re-analysis of the GFP collection and additional proteins involved in lipid metabolism was performed by high-resolution confocal imaging (25) and is available at the YPL + DB (http://yplp.uni-graz.at/index.php) (26,27). For a broader range of proteomic data, the Yeast Resource Center (YRC) (http://depts.washington.edu/yeastrc/) is a collaborative web site that gathers several core technologies and provides a breadth of information such as quantitative mass-spectrometry, sequence-function relationships, microscopy, structure and computational strategies for structure-function predictions. Finally, organelle DB (http://organelledb.lsi.umich.edu/index.php) compiles protein localization data that are organized into >50 organelles, subcellular structures and protein complexes (28,29). The data set includes 138 organisms spanning the eukaryotic kingdom and incorporates ongoing results from large-scale studies of protein localization in yeast S. cerevisiae.
A similar effort in human cell lines is based on the library of annotated reporter cell-clones (LARC) in which each strain (out of 2180) contains an endogenous protein fused to yellow fluorescent protein (YFP) (30). This DB (http://www.weizmann.ac.il/mcb/UriAlon/DynamProt/) provides the expression and localization of each protein over time in response to various drugs and is regularly updated with newly created clones (30). A more comprehensive human proteome atlas has recently become available and harbors expression data for thousands of human proteins from a large number of healthy tissues, tumors, cell lines and subcellular localizations, all based on antibody staining (http://www.proteinatlas.org/) (31). A principally similar DB called ‘PeptideAtlas’ (http://www.peptideatlas.org/) harbor growing data on proteins expressed under various conditions for a wide variety of organisms from yeast to human, collected by tandem mass spectrometry (MS/MS) (32).
OUTLOOK
The LoQAtE DB, in its first version, contains easily accessible and user-friendly information about subcellular localization and levels for 5330 yeast proteins under three environmental stress conditions and two genetic perturbations. The richness of post-translational events documented in this DB underlines the significance of studying the level of proteins to capture a true picture of a cell’s response to stress. Starting from behavior of individual proteins and up to a bird’s eye view on the entire cell as a holistic functional unit, this DB enables scientists to gain a new insight on cellular dynamics. As more screens are performed in our laboratory, they will be added into this publicly available atlas. This rich resource should serve for multiparametric searches and discovery of new protein functions illuminated only by the combination of such vast amounts of data.
FUNDING
Isreali Ministry of Science, the European Research Council (ERC) Starting Grant [StG 260395] and reintegration grant [IRG 239224]; EMBO Young Investigator Fellow (to M.S.); Recipient of an MIT International Science and Technology Initiative (MISTI) (to M.S.). Funding for open access charge: ERC Starting Grant [260395].
Conflict of interest statement. None declared.
ACKNOWLEDGEMENTS
The authors would like to thank Jonathan Weissman for providing them with the full GFP library and Amnon Horovitz and Michal Nadler-Holly for their fruitful collaboration studying the CCT complex. They would like to thank Keren Katzav, Genia Brodsky and Orit Bechar for the graphical designs of the database, and Rachel Bauman and Anastasia Zarankin from the internet services section of the Weizmann Institute for constructing the LoQAtE database.
REFERENCES
- 1.Frenkel-Morgenstern M, Cohen AA, Geva-Zatorsky N, Eden E, Prilusky J, Issaeva I, Sigal A, Cohen-Saidon C, Liron Y, Cohen L, et al. Dynamic Proteomics: a database for dynamics and localizations of endogenous fluorescently-tagged proteins in living human cells. Nucleic Acids Res. 2010;38:D508–D512. doi: 10.1093/nar/gkp808. [DOI] [PMC free article] [PubMed] [Google Scholar]
- 2.Aragon T, van Anken E, Pincus D, Serafimova IM, Korennykh AV, Rubio CA, Walter P. Messenger RNA targeting to endoplasmic reticulum stress signalling sites. Nature. 2009;457:736–740. doi: 10.1038/nature07641. [DOI] [PMC free article] [PubMed] [Google Scholar]
- 3.Beyer A, Hollunder J, Nasheuer HP, Wilhelm T. Post-transcriptional expression regulation in the yeast Saccharomyces cerevisiae on a genomic scale. Mol. Cell. Proteomics. 2004;3:1083–1092. doi: 10.1074/mcp.M400099-MCP200. [DOI] [PubMed] [Google Scholar]
- 4.Breker M, Gymrek M, Schuldiner M. A novel single-cell screening platform reveals proteome plasticity during yeast stress responses. J. Cell Biol. 2013;200:839–850. doi: 10.1083/jcb.201301120. [DOI] [PMC free article] [PubMed] [Google Scholar]
- 5.Eden E, Geva-Zatorsky N, Issaeva I, Cohen A, Dekel E, Danon T, Cohen L, Mayo A, Alon U. Proteome half-life dynamics in living human cells. Science. 2011;331:764–768. doi: 10.1126/science.1199784. [DOI] [PubMed] [Google Scholar]
- 6.Erjavec N, Larsson L, Grantham J, Nystrom T. Accelerated aging and failure to segregate damaged proteins in Sir2 mutants can be suppressed by overproducing the protein aggregation-remodeling factor Hsp104p. Genes Dev. 2007;21:2410–2421. doi: 10.1101/gad.439307. [DOI] [PMC free article] [PubMed] [Google Scholar]
- 7.Hedbacker K, Townley R, Carlson M. Cyclic AMP-dependent protein kinase regulates the subcellular localization of Snf1-Sip1 protein kinase. Mol. Cell. Biol. 2004;24:1836–1843. doi: 10.1128/MCB.24.5.1836-1843.2004. [DOI] [PMC free article] [PubMed] [Google Scholar]
- 8.Lee MV, Topper SE, Hubler SL, Hose J, Wenger CD, Coon JJ, Gasch AP. A dynamic model of proteome changes reveals new roles for transcript alteration in yeast. Mol. Syst. Biol. 2011;7:514. doi: 10.1038/msb.2011.48. [DOI] [PMC free article] [PubMed] [Google Scholar]
- 9.Sigal A, Milo R, Cohen A, Geva-Zatorsky N, Klein Y, Alaluf I, Swerdlin N, Perzov N, Danon T, Liron Y, et al. Dynamic proteomics in individual human cells uncovers widespread cell-cycle dependence of nuclear proteins. Nat. Methods. 2006;3:525–531. doi: 10.1038/nmeth892. [DOI] [PubMed] [Google Scholar]
- 10.Tkach JM, Yimit A, Lee AY, Riffle M, Costanzo M, Jaschob D, Hendry JA, Ou J, Moffat J, Boone C, et al. Dissecting DNA damage response pathways by analysing protein localization and abundance changes during DNA replication stress. Nat. Cell Biol. 2012;14:966–976. doi: 10.1038/ncb2549. [DOI] [PMC free article] [PubMed] [Google Scholar]
- 11.Newman JR, Ghaemmaghami S, Ihmels J, Breslow DK, Noble M, DeRisi JL, Weissman JS. Single-cell proteomic analysis of S. cerevisiae reveals the architecture of biological noise. Nature. 2006;441:840–846. doi: 10.1038/nature04785. [DOI] [PubMed] [Google Scholar]
- 12.Stathopoulos-Gerontides A, Guo JJ, Cyert MS. Yeast calcineurin regulates nuclear localization of the Crz1p transcription factor through dephosphorylation. Genes Dev. 1999;13:798–803. doi: 10.1101/gad.13.7.798. [DOI] [PMC free article] [PubMed] [Google Scholar]
- 13.Toulmay A, Prinz WA. Direct imaging reveals stable, micrometer-scale lipid domains that segregate proteins in live cells. J. Cell Biol. 202:35–44. doi: 10.1083/jcb.201301039. [DOI] [PMC free article] [PubMed] [Google Scholar]
- 14.Gasch AP, Spellman PT, Kao CM, Carmel-Harel O, Eisen MB, Storz G, Botstein D, Brown PO. Genomic expression programs in the response of yeast cells to environmental changes. Mol. Biol. Cell. 2000;11:4241–4257. doi: 10.1091/mbc.11.12.4241. [DOI] [PMC free article] [PubMed] [Google Scholar]
- 15.Hughes TR, Marton MJ, Jones AR, Roberts CJ, Stoughton R, Armour CD, Bennett HA, Coffey E, Dai H, He YD, et al. Functional discovery via a compendium of expression profiles. Cell. 2000;102:109–126. doi: 10.1016/s0092-8674(00)00015-5. [DOI] [PubMed] [Google Scholar]
- 16.Causton HC, Ren B, Koh SS, Harbison CT, Kanin E, Jennings EG, Lee TI, True HL, Lander ES, Young RA. Remodeling of yeast genome expression in response to environmental changes. Mol. Biol. Cell. 2001;12:323–337. doi: 10.1091/mbc.12.2.323. [DOI] [PMC free article] [PubMed] [Google Scholar]
- 17.Roh TY, Zhao K. High-resolution, genome-wide mapping of chromatin modifications by GMAT. Methods Mol. Biol. 2008;387:95–108. doi: 10.1007/978-1-59745-454-4_7. [DOI] [PubMed] [Google Scholar]
- 18.Huh WK, Falvo JV, Gerke LC, Carroll AS, Howson RW, Weissman JS, O'Shea EK. Global analysis of protein localization in budding yeast. Nature. 2003;425:686–691. doi: 10.1038/nature02026. [DOI] [PubMed] [Google Scholar]
- 19.Nadler-Holly M, Breker M, Gruber R, Azia A, Gymrek M, Eisenstein M, Willison KR, Schuldiner M, Horovitz A. Interactions of subunit CCT3 in the yeast chaperonin CCT/TRiC with Q/N-rich proteins revealed by high-throughput microscopy analysis. Proc. Natl Acad. Sci. USA. 109:18833–18838. doi: 10.1073/pnas.1209277109. [DOI] [PMC free article] [PubMed] [Google Scholar]
- 20.Picotti P, Clement-Ziza M, Lam H, Campbell DS, Schmidt A, Deutsch EW, Rost H, Sun Z, Rinner O, Reiter L, et al. A complete mass-spectrometric map of the yeast proteome applied to quantitative trait analysis. Nature. 494:266–270. doi: 10.1038/nature11835. [DOI] [PMC free article] [PubMed] [Google Scholar]
- 21.de Godoy LM, Olsen JV, Cox J, Nielsen ML, Hubner NC, Frohlich F, Walther TC, Mann M. Comprehensive mass-spectrometry-based proteome quantification of haploid versus diploid yeast. Nature. 2008;455:1251–1254. doi: 10.1038/nature07341. [DOI] [PubMed] [Google Scholar]
- 22.Teixeira MC, Monteiro P, Jain P, Tenreiro S, Fernandes AR, Mira NP, Alenquer M, Freitas AT, Oliveira AL, Sa-Correia I. The YEASTRACT database: a tool for the analysis of transcription regulatory associations in Saccharomyces cerevisiae. Nucleic Acids Res. 2006;34:D446–D451. doi: 10.1093/nar/gkj013. [DOI] [PMC free article] [PubMed] [Google Scholar]
- 23.Monteiro PT, Mendes ND, Teixeira MC, d'Orey S, Tenreiro S, Mira NP, Pais H, Francisco AP, Carvalho AM, Lourenco AB, et al. YEASTRACT-DISCOVERER: new tools to improve the analysis of transcriptional regulatory associations in Saccharomyces cerevisiae. Nucleic Acids Res. 2008;36:D132–D136. doi: 10.1093/nar/gkm976. [DOI] [PMC free article] [PubMed] [Google Scholar]
- 24.Abdulrehman D, Monteiro PT, Teixeira MC, Mira NP, Lourenco AB, dos Santos SC, Cabrito TR, Francisco AP, Madeira SC, Aires RS, et al. YEASTRACT: providing a programmatic access to curated transcriptional regulatory associations in Saccharomyces cerevisiae through a web services interface. Nucleic Acids Res. 2010;39:D136–D140. doi: 10.1093/nar/gkq964. [DOI] [PMC free article] [PubMed] [Google Scholar]
- 25.Natter K, Leitner P, Faschinger A, Wolinski H, McCraith S, Fields S, Kohlwein SD. The spatial organization of lipid synthesis in the yeast Saccharomyces cerevisiae derived from large scale green fluorescent protein tagging and high resolution microscopy. Mol. Cell. Proteomics. 2005;4:662–672. doi: 10.1074/mcp.M400123-MCP200. [DOI] [PubMed] [Google Scholar]
- 26.Habeler G, Natter K, Thallinger GG, Crawford ME, Kohlwein SD, Trajanoski Z. YPL.db: the yeast protein localization database. Nucleic Acids Res. 2002;30:80–83. doi: 10.1093/nar/30.1.80. [DOI] [PMC free article] [PubMed] [Google Scholar]
- 27.Kals M, Natter K, Thallinger GG, Trajanoski Z, Kohlwein SD. YPL.db2: the yeast protein localization database, version 2.0. Yeast. 2005;22:213–218. doi: 10.1002/yea.1204. [DOI] [PubMed] [Google Scholar]
- 28.Wiwatwattana N, Kumar A. Organelle DB: a cross-species database of protein localization and function. Nucleic Acids Res. 2005;33:D598–604. doi: 10.1093/nar/gki071. [DOI] [PMC free article] [PubMed] [Google Scholar]
- 29.Wiwatwattana N, Landau CM, Cope GJ, Harp GA, Kumar A. Organelle DB: an updated resource of eukaryotic protein localization and function. Nucleic Acids Res. 2007;35:D810–D814. doi: 10.1093/nar/gkl1000. [DOI] [PMC free article] [PubMed] [Google Scholar]
- 30.Frenkel-Morgenstern M, Cohen AA, Geva-Zatorsky N, Eden E, Prilusky J, Issaeva I, Sigal A, Cohen-Saidon C, Liron Y, Cohen L, et al. Dynamic Proteomics: a database for dynamics and localizations of endogenous fluorescently-tagged proteins in living human cells. Nucleic Acids Res. 2010;38:D508–D512. doi: 10.1093/nar/gkp808. [DOI] [PMC free article] [PubMed] [Google Scholar]
- 31.Uhlen M, Oksvold P, Fagerberg L, Lundberg E, Jonasson K, Forsberg M, Zwahlen M, Kampf C, Wester K, Hober S, et al. Towards a knowledge-based Human Protein Atlas. Nat. Biotechnol. 2010;28:1248–1250. doi: 10.1038/nbt1210-1248. [DOI] [PubMed] [Google Scholar]
- 32.Desiere F, Deutsch EW, Nesvizhskii AI, Mallick P, King NL, Eng JK, Aderem A, Boyle R, Brunner E, Donohoe S, et al. Integration with the human genome of peptide sequences obtained by high-throughput mass spectrometry. Genome Biol. 2005;6:R9. doi: 10.1186/gb-2004-6-1-r9. [DOI] [PMC free article] [PubMed] [Google Scholar]