Abstract
The Network-extracted Ontology (NeXO) is a gene ontology inferred directly from large-scale molecular networks. While most ontologies are constructed through manual expert curation, NeXO uses a principled computational approach which integrates evidence from hundreds of thousands of individual gene and protein interactions to construct a global hierarchy of cellular components and processes. Here, we describe the development of the NeXO Web platform (http://www.nexontology.org)—an online database and graphical user interface for visualizing, browsing and performing term enrichment analysis using NeXO and the gene ontology. The platform applies state-of-the-art web technology and visualization techniques to provide an intuitive framework for investigating biological machinery captured by both data-driven and manually curated ontologies.
INTRODUCTION
Ontologies provide powerful means for cataloging entities and entity relationships within many domains of knowledge (1,2). In molecular and cellular biology, gene ontology provides structured knowledge about the cellular organization and biological functions encoded by genes. Although most ontologies, including the highly successful Gene Ontology (GO) (3), are constructed through manual expert curation, we have recently developed Network-extracted Ontology (NeXO)—a data-driven gene ontology inferred directly from ‘omics data’ (4). Through a principled computational approach, our method integrates evidence from hundreds of thousands of individual gene and protein interactions to construct a complete hierarchy of cellular components and processes which recapitulates known biological machinery and uncovers many new structures.
Online databases and visualization platforms are essential in providing the users with convenient access to ontologies (e.g. 5–7). Since the publication of the NeXO concept paper (4), we now report development of NeXO Web as an online resource, including the ontology database and a fully interactive graphical user interface (GUI) for storing, accessing and browsing the NeXO ontology. This system allows the user to retrieve genes and ontology terms by name and description, map the position of the gene or term in the hierarchy and display both the direct neighborhood of the gene or term and the entire graph structure of the ontology. The NeXO Web resource complements currently available ontology visualization systems (e.g. 5,6) in three major ways. First, it represents the first gene ontology database built directly from high-throughput data. Second, it provides a novel and intuitive visualization system for exploring gene ontologies, with access to both NeXO and GO. In this system, the entire gene ontology is spread out hierarchically and explored with semantic zooming in the style of Google Maps (Figure 1). Third, the visualization system is directly integrated with term enrichment analysis, allowing the user to easily identify and visually explore NeXO and GO terms that are significantly enriched among a selected list of genes.
Figure 1.
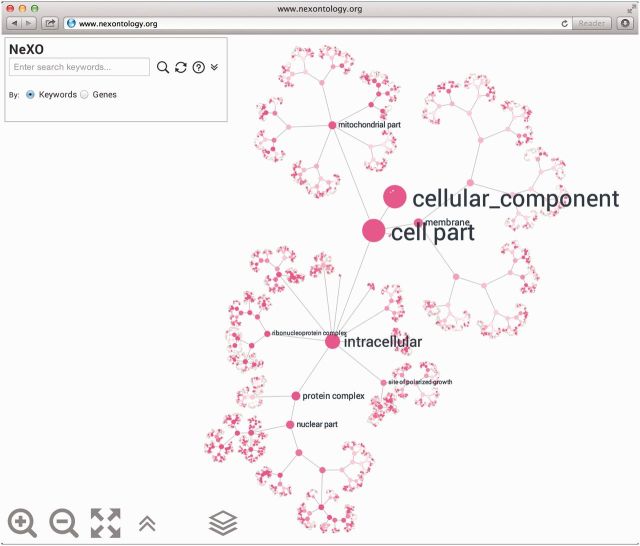
NeXO Web ontology view. The hierarchical layout of the NeXO ontology graph in which nodes represent ontology terms and edges represent term relationships. The ontology may be explored interactively utilizing semantic zooming functionality which dynamically adjusts the level of detail presented to the user.
OVERVIEW OF THE NEXO ONTOLOGY
The NeXO ontology (4) currently combines evidence from four fundamental types of interactions available for yeast: physical protein–protein interactions, genetic interactions (synthetic lethality and epistasis), transcriptional networks (gene co-expression) and an integrated functional network YeastNet (8). These networks are integrated and clustered hierarchically using a probabilistic community detection algorithm (9), producing a binary tree (or dendrogram) in which genes are joined based on the similarity of their interaction patterns. The binary tree is subsequently transformed into a directed acyclic graph (DAG) by: (i) identifying binary joins in the tree that can be replaced by multi-way joins and (ii) supplementing the tree with additional parent–child connections supported by the input interaction data. An ontology alignment procedure is then applied to map between the data-driven DAG and the GO and transfer the term names and annotations from GO to the matching nodes in the NeXO DAG. The result is a network-extracted ontology which contains 4123 biological concepts and 5766 hierarchical concept relations and captures both known and novel biology (4).
The NeXO Web platform
To provide the biological community with convenient and intuitive access to NeXO, we have developed NeXO Web—an ontology database resource with a powerful GUI and API (application programming interface). The NeXO website currently supports access to both the NeXO and GO ontologies. For both types of ontologies, the intuitive visualization system performs a hierarchical layout of the ontology graph according to its most informative parent–child term relations (Figure 1). The entire structure is explored with semantic zooming functionality providing ‘details on demand’ in the style of Google Maps—the labels of the nodes appear and disappear to match the zoom level.
The platform takes advantage of state-of-the-art web technologies and modern web browsers with HTML5 support, enabling modular architecture, enhanced performance and dynamic look-and-feel functionality. On the server side, Node.js and the Express Web application framework provide a fully functional representational state transfer (REST) API (see also the ‘Developer Manual’ page in the online documentation) for accessing the input molecular interaction networks, the ontology DAGs and term annotations stored in a Neo4j graph database. Graph operations are implemented using the Tinkerpop Gremlin framework enabling complex graph traversal on the fly. Term enrichment functionality is implemented as a web service using NumPy and FlaskRESTful. Client-side JavaScript libraries including Cytoscape.js, Sigma.js and Highcharts support interactive visualization of networks and data charts.
Navigating NeXO Web
The ontology graph: terms and relations
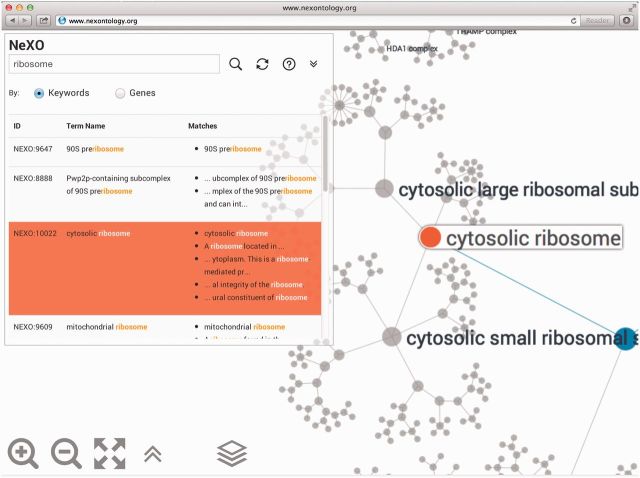
Both NeXO and GO ontologies are structured as DAGs of terms (nodes) and relations between terms (edges) (Figure 1). In GO, terms are labeled with the cellular component, process or function they represent. In NeXO, terms are labeled based on the best alignment of the data-driven ontology to the GO cellular component ontology. Edges can have either of two meanings: (i) the child term is a part of the parent term (‘part_of’ relation); (ii) the child term is a type of the parent term (‘is_a’ relation). For example, the ‘Cytosolic large ribosomal subunit’ and the ‘Cytosolic small ribosomal subunit’ are both parts of the ‘Cytosolic ribosome’ (Figure 2) which is a type of ‘Ribosomal subunit’ which, in turn, is a type of ‘Ribonucleoprotein complex’. Automatically identifying relationship types such as ‘is_a’ or ‘part_of’ is an active area of investigation. In its current version, NeXO does not distinguish between ontology relationship types; both types are shown.
Figure 2.
NeXO Web search results. Searching the NeXO ontology for terms whose name or description contains the phrase ‘ribosome’. One of the identified terms is NeXO:10022, which is significantly aligned to and named after the ‘cytosolic ribosome’ term of the GO Cellular Component ontology. Selecting this term repositions and rescales the ontology view on the term and its neighborhood. The node corresponding to the selected term is indicated in orange. The nodes and edges on the path from the selected node to the root of the ontology are indicated in blue.
Interactive browsing
Interactive browsing of the ontology is performed using the mouse, track pad or touchscreen device: by scrolling to zoom in or out of selected regions of the ontology, clicking-and-dragging to pan and clicking an ontology term to select it. When a term is selected, the relations to ancestral terms are highlighted and the term information panel is presented (see below). Double-clicking on the page background resets the current selection and adjusts the ontology graph to fit the page. Additionally, the navigation buttons (lower left) may be used to zoom in and out of the ontology and fit the ontology layout to screen. The user may select which ontology to visualize using the ontology selector (rightmost button in bottom panel; Figure 1). The user may select which species (currently yeast) and which ontology to visualize using the species selector and ontology selector, respectively the two rightmost buttons in the bottom panel (Figure 1). The NeXO yeast ontology is displayed by default.
Searching for terms and genes
NeXO Web search engine allows searching the ontology either by term keyword (including name and description) or by gene name (Figure 2). Results are displayed below the search box. Clicking on a search result selects and highlights a gene or term in the displayed ontology. The refresh button may be used to clear search results and the search box. Currently, the search engine assumes that search results must contain all words in the query. Queries are case insensitive and multiple words encased in double quotes are treated as a single phrase.
TERM ENRICHMENT ANALYSIS
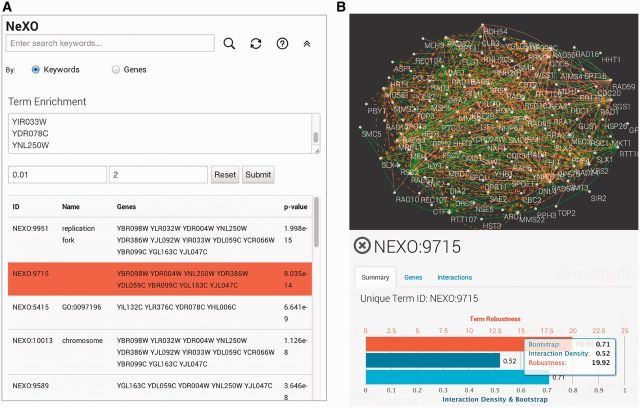
The NeXO Web platform also provides an integrated interface for performing term enrichment analysis in both the NeXO and GO ontologies (Figure 3A). The term enrichment interface can be accessed by clicking the double arrow link placed to the right of the search box. The user is asked to provide a list of query genes and specify optional parameters for the maximum P-value cut-off and minimum number of genes assigned to the term. The system then performs a series of hypergeometric tests to determine the enrichment of the list of query genes in any term in the active ontology. Terms which pass the thresholds for the maximum P-value and minimum number of query genes are listed underneath the query box in the order of increasing P-values. For example, enrichment analysis using genes whose knock-out causes cell sensitivity to methyl methanesulfonate (MMS) (10) identifies a number of known cellular components associated with replication and DNA repair as well as potentially novel components such as the term NeXO:9715 (Figure 3A).
Figure 3.
NeXO Web term analysis facilities. (A) The term enrichment analysis panel. Term enrichment analysis of genes whose knock-out sensitized cells to MMS reveals a number of enriched NeXO terms. One of the terms is the term NeXO:9715. Selecting this term in the NeXO ontology opens the slide-out term information panel (B). The term information panel shows the supporting interaction network, network support statistics and alignment of the term to the three branches of the GO. Although the term NeXO:9715 is not well aligned to any of the GO ontology branches, the network support for the term is very high, suggesting a newly discovered biological entity.
TERM INFORMATION PANEL
One of the key features of NeXO Web is the term information slide panel (Figure 3B), which is invoked whenever the user clicks on a term in the ontology. The information panel includes detailed information about the selected term, including term ID, name, description, synonyms and comments. The gene tab of the information panel also includes a list of genes associated with the term as well as links to reference databases such as the Saccharomyces Genome Database (11). The information panel also includes ontology-specific information—in the case of NeXO, detailed information on the network support for each term.
NeXO-specific term information
For NeXO terms, the term information panel displays statistics about the support for the term in network data (Figure 3B) as well as information on the alignment of the term to each of the branches of the GO (cellular component, biological process and molecular function). The network support statistics include the interaction density, the bootstrap score and the term robustness score. The interaction density is the fraction of pairs of genes associated with the term that are connected by an interaction in the input network. The bootstrap score is the fraction of times that the term was present during bootstrapping, in which 5% of input interactions have been removed. The term robustness score provides an integrated measure of data support for the term, combining interaction support and bootstrap measures (4). The data support measures and alignment statistics are key for prioritizing novel NeXO terms that are well supported by data, but do not map well to existing biology captured by the GO. As we have previously shown, many of these new components and relations may be further validated experimentally and some have been already incorporated into GO (4).
NeXO gene–gene interaction network
To allow for visual inspection of the interaction evidence supporting each NeXO term, the term information panel also includes a dynamic network layout of gene interaction data supporting the term (Figure 3B). For terms with less than 100 associated genes the supporting network is laid out using the spring-embedded layout. Larger networks are visualized using a simple degree-sorted circular layout for fast online performance. Interactions in the network are color-coded according to their type (e.g. protein–protein or genetic). The interactions supporting each NeXO term are also listed in the interaction tab of the information panel.
TREE-BASED LAYOUT OF THE ONTOLOGY
NeXO Web utilizes a tree-based layout of the ontology DAG. This requires identifying a tree structure which spans the ontology, laying out the tree and adding back the additional DAG edges not included in the spanning tree. Although NeXO has a natural spanning tree in the form of the clustering dendrogram derived from the input network data, GO DAGs require additional processing. Here we construct a tree from the original GO DAG by removing edges (parent–child term relations) to multiple parent nodes (terms) based on term size (number of genes) and the type of ontology relation. As done in (4), we first reduce the GO DAG to a relevant set of terms by removing terms that are empty (contain no genes) or redundant (contain the same genes as one of the children terms) with respect to the annotations in S. cerevisiae (10). We then apply rules for combining GO relations (3) to infer a transitive closure of the DAG. For example, the path A “part of” B “is a” C “is a” D implies the relation A “part of” D. For every term, the parent with the smallest size is chosen to be the term’s sole parent in the GO tree with the following preferences. In the GO Cellular Component ontology we first choose among the parents connected to the term by “part of” relations, if any exist. In the Biological Process and Molecular Function ontologies we first consider “is a” relations. We find that these preferences result in more informative trees due to the natural subcomponent relations in the Cellular Component ontology and the more functional nature of relations in the other two GO ontologies. For every term, after one of the parents is selected, edges to the other parents are temporarily removed—they are added back after the layout of the tree is established.
SOFTWARE AND HARDWARE REQUIREMENTS
The NeXO ontology was developed and tested using Chrome and Firefox web browsers. Minimum hardware requirements include Intel Core i5 processor (or equivalent), 4 GB RAM and 1280 × 800 screen resolution.
CONCLUSION
The NeXO Web database and platform is a systematically generated resource for genomics and systems biology—a data-driven catalog of cellular machinery from genes, to complexes, to pathways and higher-order processes. It provides means for performing multiscale analysis of biological networks, including automatically identifying, annotating and visualizing their complete hierarchical structure. Each NeXO term is automatically scored based on its support in data and correspondence to known biology as captured by the GO. For cell biologists, NeXO Web provides an intuitive framework for exploring both expert-curated and data-driven ontologies and for prioritizing new terms and term relations that can further be validated experimentally. For editors of the GO, the platform may serve as a tool for identifying terms and term relations that are already well supported by data and literature, but may have escaped prior curation efforts.
FUNDING
The National Resource for Network Biology (nrnb.org) under a grant from the National Institute of General Medical Sciences [GM103504]. Funding for open access charge: National Resource for Network Biology (NIH).
Conflict of interest statement. None declared.
REFERENCES
- 1.Musen MA, Noy NF, Shah NH, Whetzel PL, Chute CG, Story MA, Smith B, NCBO team The National Center for Biomedical Ontology. J. Am. Med. Inform. Assoc. 2012;19:190–195. doi: 10.1136/amiajnl-2011-000523. [DOI] [PMC free article] [PubMed] [Google Scholar]
- 2.Smith B, Ashburner M, Rosse C, Bard J, Bug W, Ceusters W, Goldberg LJ, Eilbeck K, Ireland A, Mungall CJ, et al. The OBO Foundry: coordinated evolution of ontologies to support biomedical data integration. Nat. Biotechnol. 2007;25:1251–1255. doi: 10.1038/nbt1346. [DOI] [PMC free article] [PubMed] [Google Scholar]
- 3.Ashburner M, Ball CA, Blake JA, Botstein D, Butler H, Cherry JM, Davis AP, Dolinski K, Dwight SS, Eppig JT, et al. Gene ontology: tool for the unification of biology. The Gene Ontology Consortium. Nat. Genet. 2000;25:25–29. doi: 10.1038/75556. [DOI] [PMC free article] [PubMed] [Google Scholar]
- 4.Dutkowski J, Kramer M, Surma MA, Balakrishnan R, Cherry JM, Krogan NJ, Ideker T. A gene ontology inferred from molecular networks. Nat. Biotechnol. 2013;31:38–45. doi: 10.1038/nbt.2463. [DOI] [PMC free article] [PubMed] [Google Scholar]
- 5.Huntley RP, Binns D, Dimmer E, Barrell D, O'Donovan C, Apweiler R. QuickGO: a user tutorial for the web-based Gene Ontology browser. Database. 2009;2009 doi: 10.1093/database/bap010. bap010. [DOI] [PMC free article] [PubMed] [Google Scholar]
- 6. Carbon,S., Ireland,A., Mungall,C.J., Shu,S., Marshall,B., Lewis,S., AmiGO Hub and Web Presence Working Group. (2009) AmiGO: online access to ontology and annotation data. Bioinformatics, 25, 288–289. [DOI] [PMC free article] [PubMed]
- 7.Gene Ontology Consortium. The Gene Ontology: enhancements for 2011. Nucleic Acids Res. 2012;40:D559–D564. doi: 10.1093/nar/gkr1028. [DOI] [PMC free article] [PubMed] [Google Scholar]
- 8.Lee I, Li Z, Marcotte EM. An improved, bias-reduced probabilistic functional gene network of baker's yeast, Saccharomyces cerevisiae. PLoS One. 2007;2:e988. doi: 10.1371/journal.pone.0000988. [DOI] [PMC free article] [PubMed] [Google Scholar]
- 9.Park Y, Bader JS. Resolving the structure of interactomes with hierarchical agglomerative clustering. BMC Bioinformatics. 2011;12(Suppl. 1):S44. doi: 10.1186/1471-2105-12-S1-S44. [DOI] [PMC free article] [PubMed] [Google Scholar]
- 10.Hillenmeyer ME, Fung E, Wildenhain J, Pierce SE, Hoon S, Lee W, Proctor M, St Onge RP, Tyers M, Koller D, et al. The chemical genomic portrait of yeast: uncovering a phenotype for all genes. Science. 2008;320:362–365. doi: 10.1126/science.1150021. [DOI] [PMC free article] [PubMed] [Google Scholar]
- 11.Cherry JM, Hong EL, Amundsen C, Balakrishnan R, Binkley G, Chan ET, Christie KR, Costanzo MC, Dwight SS, Engel SR, et al. Saccharomyces Genome Database: the genomics resource of budding yeast. Nucleic Acids Res. 2012;40:D700–D705. doi: 10.1093/nar/gkr1029. [DOI] [PMC free article] [PubMed] [Google Scholar]


