


Abstract
We present an update of the FunCoup database (http://FunCoup.sbc.su.se) of functional couplings, or functional associations, between genes and gene products. Identifying these functional couplings is an important step in the understanding of higher level mechanisms performed by complex cellular processes. FunCoup distinguishes between four classes of couplings: participation in the same signaling cascade, participation in the same metabolic process, co-membership in a protein complex and physical interaction. For each of these four classes, several types of experimental and statistical evidence are combined by Bayesian integration to predict genome-wide functional coupling networks. The FunCoup framework has been completely re-implemented to allow for more frequent future updates. It contains many improvements, such as a regularization procedure to automatically downweight redundant evidences and a novel method to incorporate phylogenetic profile similarity. Several datasets have been updated and new data have been added in FunCoup 3.0. Furthermore, we have developed a new Web site, which provides powerful tools to explore the predicted networks and to retrieve detailed information about the data underlying each prediction.
INTRODUCTION
Understanding gene product interactions is essential to the understanding of all biological processes. Gene products interact with each other by temporary binding, the formation of permanent complexes, as enzymes by modifying each other or a common substrate or by influencing each other’s expression. These interactions can be conditional, e.g. only present in a certain cellular compartments, and might require intermediates. A multitude of experimental techniques have been developed to find the individual types of interactions or indirect evidence of their presence. Small-scale experiments provide detailed high-quality information but require a lot of time and resources to study a few molecules. High-throughput approaches, on the other hand, are error-prone with high rates of false positives and false negatives, and cover only certain aspects like physical binding. Indirect evidences for interactions can be derived from experiments like localization assays or expression analysis. But those come, in addition to being indirect, with their own problems and limitations like poor resolution and high noise levels.
To create a global network of interactions, one can broaden the scope to more general functional couplings. Functional couplings, also called functional associations, encompass all types of interactions described earlier, but also the more abstract case of participation in the same function. This less specific definition allows one to integrate all kinds of direct and indirect evidence for all different types of interactions and even less specific information like phylogenetic profiles (PHPs) or synteny. The underlying premise is that different experimental errors and biases will cancel each other out and that different types of evidences will complement each other to yield a global picture (1,2). For an overview of the most commonly used evidence types, see Lees et al. (3) and Lee et al. (4).
Several approaches have been proposed to integrate large-scale experimental datasets and statistical or computational evidences to infer functional couplings using mainly not only weighted Bayesian integration (5–7) but also random forests (8), ridge regression (9) and support vector machines (10). Each of these approaches requires a gold standard representing a set of known functionally associated gene pairs, and how these pairs are chosen influences the nature of the predicted couplings. Commonly used gold standards include pairs extracted from Kyoto Encyclopedia of Genes and Genomes (KEGG) (11) pathways or gene sets that share selected gene ontology (GO) (12) terms. In some cases, multiple different gold standards are used either as an attempt to predict process-specific couplings or to differentiate between different kinds of couplings.
FunCoup (13) predicts four different classes of functional couplings using gold standards derived from protein complexes, physical protein interactions, metabolic pathways and signaling pathways. Nine different types of evidence including co-expression, protein–protein interactions (PPIs), genetic interactions, PHP similarity and co-regulation for 11 model organisms are integrated into genome-wide networks. Evidences are transferred between species using orthology assignments from InParanoid (14). Transferring information across species allows inference of networks for less well-studied species like Ciona intestinalis and extends the amount of available information for every species significantly. A unique feature of FunCoup is that orthology-transferred evidence is evaluated using the gold standards of the target species. This way, it is explicitly learned how much information can be drawn from data of a different species. See Figure 1 for a summary of the FunCoup framework.
Figure 1.
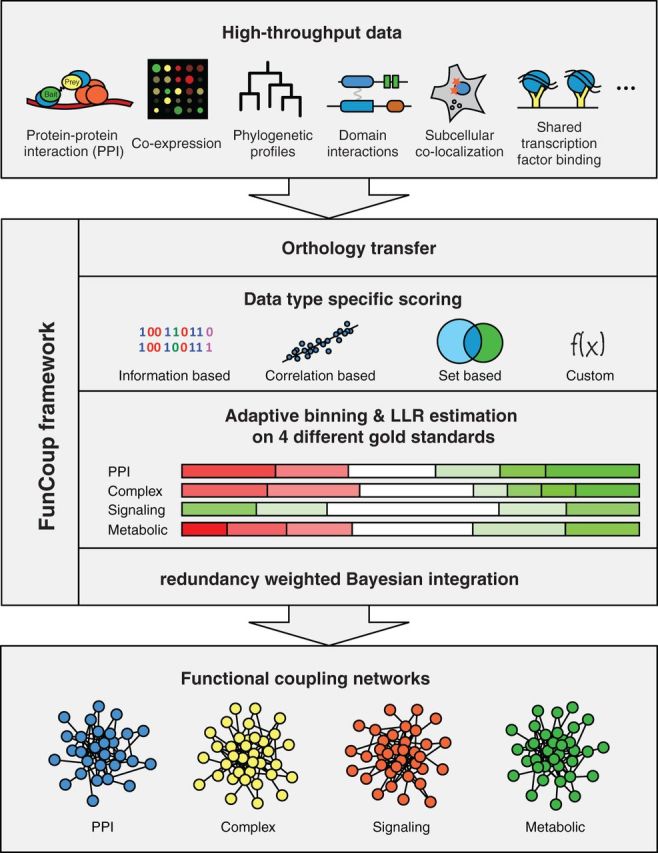
Overview of the FunCoup framework. FunCoup integrates nine different evidence types. For each evidence type, a unique scoring function is defined. The scoring functions are applied to the data of known associated gene pairs and random background pairs. The scores for the known and random pairs are used to partition the score range for each dataset by an adaptive binning procedure. The binning procedure identifies score ranges that are significantly enriched or depleted for known couplings. For each bin, the LLR between a known coupled pair and a background pair is estimated. In the next step, the scores for all possible gene pairs are calculated and translated into the corresponding LLRs. For each gene pair, the LLRs for each data type are combined by redundancy-weighted Bayesian integration. If the resulting FBS surpasses a threshold, a link is introduced for the gene pair. This way a genome-wide functional coupling network is created. FBSs are converted into more convenient confidence scores that range between 0 and 1 by using an alternative form of Bayes’ rule and assuming a prior interaction probability of 0.001. FunCoup has four different sets of known gene pairs representing different classes of functional couplings. The LLRs are estimated independently for each of these classes and four different networks are created. These are normally combined for searching purposes by keeping the maximum link strength, but they can also be used individually. FunCoup not only uses data from the species itself but also transfers data between species using orthology assignments from InParanoid. This is done before the LLRs are calculated; hence, data from a different species are evaluated the same way as data from the same species.
Here we present an update of the FunCoup framework to version 3.0. The framework has been completely rewritten, and its stability and flexibility have been greatly improved. For instance, the binning procedure has been made more stringent to prevent small, putatively uninformative bins that arise from local variations. Moreover, ambiguously mapped data points were only allowed to contribute once to the training. Previous versions of FunCoup used a naïve Bayesian integration strategy. A newly introduced feature in version 3.0 is ‘redundancy weighted Bayesian integration’, which aims to downweight redundant information in the evidence. Redundancy within each evidence type is estimated directly at the level of the log-likelihood ratios (LLRs); different evidence types are assumed to be independent. Many datasets have been added or updated. The new framework provides a much better scalability, which will allow us to update the data more frequently in the future. We have also developed a new Web site with much improved performance and usability. The Web site has many powerful query options for exploring the local network neighborhood of the query genes. The display of the data underlying the couplings has been greatly improved so that the sources of each prediction can be easily traced. See Table 1 for an overview of the new features in FunCoup 3.0.
Table 1.
Feature comparison of FunCoup 2.0 and FunCoup 3.0
| Bayesian integration | FunCoup 2.0 naïve | FunCoup 3.0 redundancy weighted |
|---|---|---|
| TF targets | Regulogs | ENCODE, modENCODE, YEASTRACT |
| mRNA correlation | Pearson | Spearman |
| Genome versions | Data driven | Ensembl 64 |
| PPI data | IntAct | iRefIndex |
| PPI scoring | Per experiment | Per publication |
| PHP scoring | Each signature separately | Tree-based |
FRAMEWORK IMPROVEMENTS
Gold standards
The FunCoup gold standards were constructed as described earlier (13) but with updated underlying data. The selection of KEGG pathways for the metabolic gold standard and the signaling gold standard was changed to more accurately reflect these two categories. The protein complex gold standard was extracted from Corum (15) for Homo sapiens, Mus musculus and Rattus norvegicus; from Comprehensive Yeast Genome Database (16) for Saccharomyces cerevisiae; and from UniProt (17) for the other species. The PPI gold standard was extracted as interactions in iRefIndex (18) that overlapped with any of the other gold standards. The random set of negative pairs is now chosen separately for each class to make the classes independent of each other.
Weighted LLR integration
Naïve Bayesian integration is the most widely used technique to integrate functional coupling evidence because it is robust, requires only a small gold standard and tolerates large numbers of missing values. However, it does impose the problematic assumption of statistical independence of the evidences, and its final predictive value, sometimes called final Bayesian score (FBS), simply corresponds to the sum of all individual LLRs. This independent assumption is not satisfied by most types of evidences. For instance, co-expression analysis of two different microarray studies might provide redundant information, depending on the focus of the studies. Several adaptations to the naïve Bayesian procedure have been proposed to downweight redundant evidence, either by introducing an integration with linear (19) or exponential (20) decay rates or with different priors that reflect the mutual information between the evidences (21).
Previous versions of FunCoup did not correct for redundancy, but relied on careful manual data selection. With FunCoup 3.0, we are introducing a novel form of weighted LLR integration. Different evidence types capture different aspects of the coupling and are still assumed to be independent. Therefore, the  for a gene pair a,b is the sum of all
  over all different evidence types t. The idea behind the weighting scheme is that evidences of the same type will only increase the total LLR to the extent that they provide novel information for the gene pair. The
  for specific evidence type t is calculated as the weighted sum of the individual
  for each evidence e of type t as follows:
where the LLRs are ranked by their absolute value in decreasing order and  is the distance between evidence e and evidence k. Each
  is weighted by the product of the distances
  with
with  , or in other words, the distance to each evidence on the left side in this ranking. The distance between two evidences is defined as
  where
where  is the Spearman correlation between the LLRs for evidence e and evidence k and α is the baseline redundancy. Evidence correlations are estimated separately for each functional coupling class on a random gene pair sample. This way the redundancy in the usable information is evaluated directly. The parameter α was introduced to correct for redundancy underestimation due to noise and was set to 0.7 based on the performance on a holdout set (see Figure 2). It can be interpreted as a decay rate, rendering this approach a hybrid between a fixed decay and pure redundancy-based weighting.
Figure 2.

Optimizing redundancy-weighted Bayesian integration. For each gold standard, 20% of the positive and negative pairs were omitted from the training and used as a holdout set to estimate the performance of the framework. Performance was measured as increase of the area under the curve of receiver operating characteristic curves for the different holdout sets relative to no redundancy reduction (shown as red line at 0). Only the receiver operating characteristic curve until the first 10% of false positives was considered. The reason for doing this is that because of the huge amount of possible couplings, a small false-positive rate will produce a large error. The figure shows the average relative increase across all networks for different values of α in the redundancy reduction, where α = 1 corresponds to the softest redundancy reduction and α = 0 to the hardest, i.e. only using the strongest evidence for each type. The dashed outline shows the lower and the upper quartiles. The variation between the different networks is high because for some networks of the PPI and protein complex classes, the performance is already close to the optimum, leaving little room for further improvements. The maximum improvement was achieved at α = 0.7, which is highlighted by a green dot in curve.
Novel data
We have updated most of the data sources for the new release. Table 2 summarizes the amount of data integrated for the different evidence types. We have added several additional microarray datasets with 1102 additional experimental conditions. For PPIs, we switched from IntAct (22) as data source to iRefIndex (18), which summarizes interactions from all major protein interaction databases and provides a much better coverage. We also significantly increased the transcription factor (TF) target data by incorporating chromatin immunoprecipitation (ChIP)-seq and ChIP–chip data for H. sapiens and M. musculus from the ENCODE (23,24) project and for Caenorhabditis elegans and Drosophila melanogaster from the modENCODE (25,26) project. For H. sapiens and D. melanogaster, we used preprocessed TF target associations. For M. musculus, we only included TF targets with significant peaks in the region 1000 nt upstream to 500 nt downstream of the transcription start site that were replicated in at least two experiments. For C. elegans, replicates were already combined, and we integrated the different experiments by taking the union using the same chromosomal range as in M. musculus. For S. cerevisiae, curated TF target sites were included from YEASTRACT (27). See http://FunCoup.sbc.su.se/statistics/#data for full list of all integrated datasets.
Table 2.
Summary of the data integrated in FunCoup 3.0
| Data type | Number of conditions | Number of data points | Number of objects |
|---|---|---|---|
| mRNA expression | 3949 samples | 2.6 × 10⁹ gene pairs | 218 644 genes |
| Protein–protein interactions | 43 691 publications | 1.5 × 10⁶ protein pairs | 53 886 proteins |
| Subcellular localizations | 1762 locations | 1.4 × 10⁹ protein pairs | 151 439 proteins |
| microRNA targets | 898 microRNAs | 0.4 × 10⁹ gene pairs | 62 304 genes |
| Transcriptions factor targets | 432 TFs | 0.6 × 10⁹ gene pairs | 70 975 genes |
| Protein expression | 66 locations | 0.1 × 10⁹ protein pairs | 12 238 proteins |
| Genetic interactions | 0.3 × 10⁶ gene pairs | 4458 genes | |
| Domain interactions | 1.3 × 10⁴ domain pairs | 3562 domains | |
| PHP similarity | 93 species | 1.7 × 10⁹ gene pairs | 188 068 genes |
The numbers are summed up across all 11 species. For protein–protein interactions, genetic interactions and domain interactions, the number of data points/objects is trimmed to the number of informative pairs, whereas for the other data types, all possible pairs are counted.
Scoring function changes
To make use of a dataset or computational evidence, FunCoup requires a score. Every evidence type has its unique scoring function that transforms the raw evidence into a continuous signal. The scores are discretized by an adaptive binning procedure, and LLRs are estimated for each score bin as described earlier (13). Switching to a new source for PPI data required a slight change in the PPI scoring function. Interaction counts were previously evaluated for each experiment separately, but because iRefIndex lacks experiment enumeration, they are now evaluated on the complete publication. Another change to the PPI scoring is that proteins that have published interactions, yet are not found to interact with each other, are now placed in a dedicated bin. Previously such interactions were scored 0 and binned along with the interacting pairs.
Besides the PPI metric changes, we developed a new method for estimating PHP similarity. Inferring functional couplings from PHP similarity was first introduced by Pellegrini et al. (28) and relies on the idea that two functionally coupled genes are more likely to be co-present or co-absent in a set of species than non-coupled genes. Several simple methods have been proposed that directly compare PHPs and do not account for phylogenetic dependencies (28–30). More complex model-based methods infer PHP similarities from evolutionary events (29,31), but are computationally expensive. Computationally more feasible heuristics that consider phylogenetic relations include scoring of co-present runs (32) and collapsing of taxa with identical profiles (33).
We have developed a new heuristic algorithm using a species tree constructed by neighbor-joining with distances derived from InParanoid (14) as described in Berglund et al. (34). Of the 99 eukaryotes in InParanoid (version 7), 6 were excluded from the tree reconstruction, as their topology did not agree with the National Center for Biotechnology Information phylogeny. The resulting tree was used to estimate positive evidence based on co-present subtrees and negative evidence based on mutually exclusive subtrees. For both positive and negative evidence, a score is calculated as the fraction of the branch lengths of the full tree; see Figure 3 for more details. The two scores are binned into six equally sized bins, which we found to be a good compromise between resolution and generalization, that are combined into 21 unique bin pairs. For each such bin pair, a separate LLR is estimated. Treating positive and negative scores separately has the advantage that the relation and importance of the two scores can be learned directly for every species and coupling class.
Figure 3.
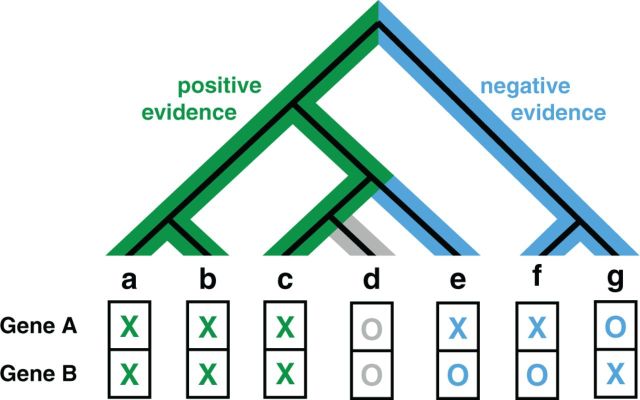
FunCoup 3.0 introduces a novel heuristic method for estimating PHP similarity. A neighbor-joining species tree is created for all except six eukaryotes in InParanoid using inter-species distances derived from the fraction of genes with orthologs as described in Berglund et al. (34). This tree is then rooted at the species for which the couplings are predicted. The PHP score has two components: the positive evidence and the negative evidence. The figure shows a simplified example with seven species. For the positive evidence, the score is the branch length of the green highlighted subtree where both genes have orthologs in InParanoid divided by the total branch length of the full tree. Whereas co-conservation provides positive evidence, negative evidence can be drawn from species where only one of the two genes has orthologs. The negative evidence score is therefore the sum of branch lengths of mutually exclusive species, highlighted in blue, divided by the total branch length of the tree. Branches that are covered by the positive evidence subtree are excluded from the negative evidence calculation, e.g. for species e, only the branch to the ancestor of c, d and e is included. This corresponds to the simplified assumption that genes can only be lost but not regained, and because species c has orthologs to gene A and gene B, we assume that the orthologs were also present at all ancestors of c. Both positive and negative scores have a value range between 0 and 1 and their sum is bound to maximum of 1. The two scores are binned into six fixed-size bins and an LLR is learned for every combination of a positive and a negative evidence bin. The score bins for positive and negative evidence span a 6 × 6 triangular matrix with 21 bins, which is significantly less than the 1024 bins for PHP in the previous release.
NETWORKS
The methodology for building functional coupling networks has been substantially revised in release 3.0 of FunCoup. Table 1 lists the major changes in method or data source. Each change was motivated either by increased stability, coverage or prediction accuracy. The evidences for functional coupling are drawn from the same nine types of data as before, but using updated data (see Table 2).
The new expression, PPI and TF target site datasets are substantially expanded, which has increased the coverage in FC 3.0 (See Table 3). Compared with the previous release, the predicted networks have grown significantly for most of the species as can been seen in Table 3.
Table 3.
Network sizes as number of links and number of genes/nodes for links with a confidence above 0.1 for the different species in FunCoup 3.0
| Species | Number of links | Number of genes |
|---|---|---|
| H. sapiens | 4 477 041 (0.96) | 18 113 (0.86) |
| M. musculus | 5 314 496 (1.23) | 19 226 (0.95) |
| R. norvegicus | 5 460 769 (1.78) | 18 562 (1.13) |
| S. cerevisiae | 1 353 169 (3.01) | 5766 (1.08) |
| Gallus gallus | 2 037 840 (1.80) | 12 317 (0.99) |
| D. melanogaster | 1 987 503 (1.56) | 11 398 (0.98) |
| Danio rerio | 4 168 563 (2.08) | 15 003 (1.15) |
| C. intestinalis | 1 137 425 (2.86) | 5 642 (1.25) |
| Canis familiaris | 3 537 089 (2.02) | 17 239 (0.98) |
| C. elegans | 3 206 664 (1.93) | 12 389 (0.92) |
| Arabidopsis thaliana | 5 106 648 (2.63) | 16 375 (1.07) |
The numbers in brackets show the relative increase or decrease compared with the previous version.
To avoid inflating functional coupling scores due to multiple overlapping sources of evidence, a new method for redundancy reduction was introduced. This clearly improved the performance of the framework on a gold standard holdout set as can be seen in Figure 2. Setting the ‘decay’ parameter α to 0, which corresponds to including only the strongest evidence from each type, gave better accuracy than no redundancy reduction at all. This indicates that redundancy is a real issue, and that it reduces the prediction quality. An α value of 0.7 was found to give optimal performance on the holdout set.
Compared with FunCoup 2.0, the relative impact of the expression evidence decreased, despite adding more expression data, as can be seen in Figure 4. This is an effect of the redundancy reduction. Although the redundancy is usually fairly low for expression datasets, the data have high coverage and there are many different expression datasets. This leads to many co-expression evidences for each individual link. For FunCoup 2.0, these were treated as independent evidences, but for FunCoup 3.0, the redundancy reduction downweights the LLR score of each evidence that is added. An example for this is the coupling between MCM5 and FARSA (UniProt P33992 and Q9Y285), which got an FBS score of 15.5 in FunCoup 2.0 that was mainly caused by many weak to medium-high expression correlations. In FunCoup 3.0, this pair only gets an FBS score of 6, which more accurately reflects the true amount of evidence for the pair.
Figure 4.
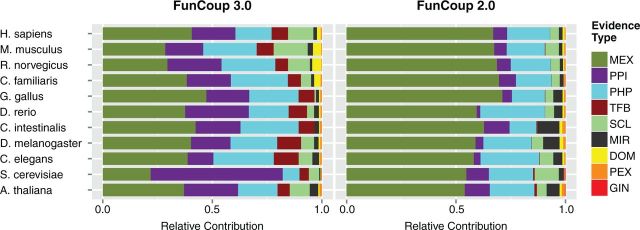
Relative positive contribution of the evidence types in the summary networks of FunCoup 3.0 and FunCoup 2.0. The total amount of evidence (LLRs) was normalized to sum up to 1. Evidence types are MEX, mRNA co-expression; PHP, phylogenetic profile similarity; PPI, protein–protein interaction; SCL, sub-cellular co-localization; MIR, co-microRNA regulation by shared microRNA targeting; DOM, domain interactions; PEX, protein co-expression; TFB, shared TF binding; GIN, genetic interaction profile similarity. Compared with FunCoup 2.0, the relative influence of MEX is lower, which is a direct effect of the redundancy reduction. Both PPI and TFB have become more influential because of the additional data.
The relative impact of PPI evidence and TF co-regulation has strongly increased compared with the previous release. This mainly reflects the addition of new data and also the decrease in co-expression evidence. There was not much TF target data in FunCoup 2.0, so the additional data represent mostly novel information. For PPI, the coverage is generally low, and additional data provide a lot of novel information despite fairly high levels of redundancy for these data type. Overall, the evidence type utilization is much more balanced for FunCoup 3.0 (see Figure 4). This gives more robust predictions due to a decrease in single-evidence links. For 6.4 million of all 22.7 million couplings in release 2.0, >90% of the evidence came from one type. Despite the increase to 37.8 million couplings in release 3.0, this is only the case for 4.4 million couplings.
A new algorithm was developed for using phylogenetic profiling as evidence of functional coupling (see Figure 3 for more details). This new PHP scoring function improves the performance on a holdout set compared with the old scoring function by ∼0.5% on the first 5% of the area under the curve. It has the advantage that it requires substantially fewer bins (21 instead of 1024), reducing the risk for overtraining, and that it uses 93 instead of 11 species, which increases its robustness to incorrect orthology assignments.
Despite major changes in both data and methods, the high-confidence networks of FunCoup 2.0 and FunCoup 3.0 overlap substantially; 80% of the FunCoup 2.0 links with a confidence score >0.99 are still present in FunCoup 3.0. There are several reasons why some of the high-confidence links in FunCoup 2.0 are now considered incorrect and are no longer part of the network. For most of the missing links, the main evidence source was co-expression. The redundancy reduction balances the impact of the evidences, and obtaining a high FBS from a single evidence type alone is now much more difficult. Another improvement that eliminated some false predictions is more careful data mapping. FunCoup 3.0 does not consider data that are mapped to two genes by the same identifier as evidence for functional coupling between them. In FunCoup 2.0, such data were included, which led to over-predictions and false predictions. An example for this is the link between SERINC4 and ELL3 (UniProt A6NH21 and Q9HB65) that is not present in FunCoup 3.0 or STRING 9.05 (6) but has a high FBS in FunCoup 2.0. Both genes are mapped to the same probes on mRNA microarrays in human and mouse, which led to artifactually perfect co-expression evidence for the pair.
NOVEL WEB SITE
We have designed a completely new Web site for FunCoup 3.0, with a more intuitive and user-friendly tab-based interface. The basic query, retrieval of the most strongly coupled genes to a set of query genes, is considerably faster than before. It is possible to restrict this search to only consider evidences of certain types or from certain species. The retrieved subnetwork can be further restricted to genes with a certain GO term or KEGG pathway annotation. For example, the subnetwork may be limited to genes known to be associated with the process cell adhesion. Only GO terms from the broadest three levels are selectable, but genes with any child term of the search term will be found.
Comparative analysis of functional coupling networks across species is a powerful tool to gain insight into conserved functional modules (35–38). The FunCoup Web site allows querying multiple species at once to find conserved subnetworks. We have developed a new procedure to expand the subnetwork of a query gene. The new procedure minimizes the rank sum of the interactors and their orthologs, so that subnetwork genes are selected that are most strongly connected to the query and to the query orthologs. The comparative query requires that the species’ own evidence reaches the chosen cutoff to prevent biased predictions from orthology transfer.
Another new feature of this release is the incorporation of MaxLink (39) as an alternative query option. MaxLink searches a network with a list of query genes to find genes that are more strongly connected to the query set than expected by chance, and ranks the found genes by the number of links to the query set genes. The idea is to use the network to find novel genes that are central to a known pathway, process or otherwise co-functioning group of genes. For example, MaxLink has been successfully applied to predict novel cancer-related genes in H. sapiens (39). The subnetwork retrieved by MaxLink is presented in the same way as regular search results but also displays MaxLink significance and score in the Interactors view. A detailed description of the search options can be found in the help section of the Web site.
The search results are presented in five different tab views. A network view shows the subnetwork of the query genes and their interactors in the interactive jSquid network viewer (40). The second view is the new interaction view that can be seen in Figure 5, which lists all links in the subnetwork. For each link, detailed information of how the coupling was derived is shown. The links can be expanded to see the predictions for the different functional coupling classes. Green and red boxes indicate positive and negative LLRs for the evidence types and species. If one clicks on the boxes, a table will open displaying the experimental and computational evidences for the coupling. Again, green or red boxes show the LLRs of the individual evidences. A free text next to those boxes describes the evidences; for instance, which TFs co-regulate the gene pair or which publications report interactions between the genes. Hyperlinks for the individual data points provide some follow-up information. The example shown in Figure 5 further demonstrates that FunCoup can predict functional couplings that are only described in small-scale experiments not included in the network integration.
Figure 5.

Screenshot of the interaction view showing the results for a standard search with MYC in the H. sapiens network. This example use case demonstrates the amount of details that are presented and showcases the potential of FunCoup in a real-world scenario. The functional couplings of MYC are expanded, and MYC is highlighted because it was used as a search term. For each interactor, an excerpt of its description is shown. The next column gives the confidence score of the coupling followed by the class with the highest score. Clicking on the triangle in front of the interactor name will expand the coupling to display all classes, as shown for MAX. The green and red boxes next to the class labels represent the LLRs for evidence types and species. Green stands for a positive LLR and red for a negative LLR. Hovering over a box displays the actual score of its LLR. Clicking on any of the boxes brings up a table that lists all individual evidences for the coupling ranked by LLR. In the example, this is shown for the coupling between MYC and GNL3. GNL3 is the strongest coupled gene to MYC that is not labeled as known interactor. The coupling prediction is mostly based on a single large-scale PPI study, subcellular colocalization and coexpression in multiple microarray experiments from human, mouse and rat. In a recent small-scale study, GNL3, also known as nucleostemin, was identified as a direct transcriptional target of MYC and shown to act as a rate-limiting factor for proliferation (41). This information was not used when the FunCoup networks were derived, and demonstrates the predictive power of FunCoup.
The objective of FunCoup is the prediction of novel functional couplings, but known couplings that are supported by reliable physical interaction data or complex membership are highlighted in the interaction view with blue boxes. The search results can be extended to include all known couplings in the advanced search options. The next view shows a table with the query genes and the retrieved associated genes. Descriptions, annotations and cross-references for the genes are given. A new feature is that enriched GO terms or KEGG pathways in this gene set are listed, providing information about predominant functions in the subnetwork. The subnetwork genes represent the most strongly functionally related genes to the query. Individual annotations of interactors or enriched functional terms allow inferring possible novel annotations for the query genes. The next view gives download options for the genes and the subnetwork in different formats. Finally, the last view brings back the current search and allows to modify keywords or to query parameters.
SUMMARY AND OUTLOOK
The completely re-implemented FunCoup 3.0 framework was greatly improved and several new features were added. The most important change was the replacement of the naïve Bayesian integration with an integration procedure that downweights datasets with redundant information. This improved the robustness of the framework and reduced the prediction bias toward co-expression evidence.
A novel method for estimating PHP similarity was developed that is based on an InParanoid-derived species tree and combines positive evidence from co-conservation and negative evidence from missing orthologs. In the previous version, LLRs were estimated for every possible co-conservation profile. With 10 species, this led to >1000 different LLRs, causing a high risk for overtraining. The new PHP score considers almost 100 species and includes not only co-conservation but also absence of one of the two genes. Moreover, it produces much fewer bins, which reduces the risk for overtraining.
Overall, the framework has been made more robust with several small improvements including more careful data mapping and a more stringed binning procedure. Additional data, especially for PPI and TFB, have been added, and existing data sources have been updated. For FunCoup 2.0, the main evidence source was co-expression. The redundancy weighting and the additional data resulted in a more balanced data type utilization. The various improvements have greatly increased the coverage of the FunCoup networks, making FunCoup one of the most comprehensive resources for functional couplings.
The FunCoup Web site was completely redesigned, with greatly improved query times, a cleaner look and much improved usability. The guilt-by-association method MaxLink (39) has been integrated as batch query option to find related genes to large set of query genes. Significantly enriched functional annotations are displayed for the retrieved subnetwork, providing a functional characterization of the query results.
The re-implementation of the FunCoup framework enabled the above-described improvements and also laid the groundwork for future improvements and extensions. One problematic issue of the current FunCoup framework is the evidence score binning procedure. Although we have made some improvements to make it more robust, the fundamental problems of binning, namely, limited resolution and robustness, remain. One of our goals for the future is therefore to replace the binning with a continuous approach. However, a strength of the binning procedure is that it is non-parametric and can therefore adapt to any kind of signal distribution. A continuous approach will impose some assumptions about the distribution and a good compromise between power and flexibility has to be found.
The static structure of functional coupling networks and many other types of biological networks poorly reflects the true dynamic nature of biological systems. This is another aspect in which we are planning to improve FunCoup in the future, for instance, by introducing attributed links or process-specific links.
FUNDING
Swedish Research Council and Stockholm University. Funding for open access charge: Swedish Research Council.
Conflict of interest statement. None declared.
ACKNOWLEDGEMENTS
The authors thank Andrey Alexeyenko for helpful discussions and Sanjit Roopra for helping with the design and implementation of the new FunCoup framework.
REFERENCES
- 1.Gerstein MB, Lan N, Jansen R. Integrating interactomes. Science. 2002;295:284–287. doi: 10.1126/science.1068664. [DOI] [PubMed] [Google Scholar]
- 2.von Mering C, Krause R, Snel B, Cornell M, Oliver SG, Fields S, Bork P. Comparative assessment of large-scale data sets of protein-protein interactions. Nature. 2002;417:399–403. doi: 10.1038/nature750. [DOI] [PubMed] [Google Scholar]
- 3.Lees JG, Heriche JK, Morilla I, Ranea JA, Orengo CA. Systematic computational prediction of protein interaction networks. Phys. Biol. 2011;8 doi: 10.1088/1478-3975/8/3/035008. 035008. [DOI] [PubMed] [Google Scholar]
- 4.Lee I, Narayanaswamy R, Marcotte EM. Bioinformatic prediction of yeast gene function. Methods Microbiol. 2007;36:597–628. [Google Scholar]
- 5.Wong AK, Park CY, Greene CS, Bongo LA, Guan Y, Troyanskaya OG. IMP: a multi-species functional genomics portal for integration, visualization and prediction of protein functions and networks. Nucleic Acids Res. 2012;40:W484–W490. doi: 10.1093/nar/gks458. [DOI] [PMC free article] [PubMed] [Google Scholar]
- 6.Franceschini A, Szklarczyk D, Frankild S, Kuhn M, Simonovic M, Roth A, Lin J, Minguez P, Bork P, von Mering C, et al. STRING v9.1: protein-protein interaction networks, with increased coverage and integration. Nucleic Acids Res. 2013;41:D808–D815. doi: 10.1093/nar/gks1094. [DOI] [PMC free article] [PubMed] [Google Scholar]
- 7.Lee I, Blom UM, Wang PI, Shim JE, Marcotte EM. Prioritizing candidate disease genes by network-based boosting of genome-wide association data. Genome Res. 2011;21:1109–1121. doi: 10.1101/gr.118992.110. [DOI] [PMC free article] [PubMed] [Google Scholar]
- 8.Elefsinioti A, Sarac OS, Hegele A, Plake C, Hubner NC, Poser I, Sarov M, Hyman A, Mann M, Schroeder M, et al. Large-scale de novo prediction of physical protein-protein association. Mol. Cell. Proteomics. 2011;10 doi: 10.1074/mcp.M111.010629. M111.010629. [DOI] [PMC free article] [PubMed] [Google Scholar]
- 9.Mostafavi S, Ray D, Warde-Farley D, Grouios C, Morris Q. GeneMANIA: a real-time multiple association network integration algorithm for predicting gene function. Genome Biol. 2008;9(Suppl. 1):S4. doi: 10.1186/gb-2008-9-s1-s4. [DOI] [PMC free article] [PubMed] [Google Scholar]
- 10.Lin M, Hu B, Chen L, Sun P, Fan Y, Wu P, Chen X. Computational identification of potential molecular interactions in Arabidopsis. Plant Physiol. 2009;151:34–46. doi: 10.1104/pp.109.141317. [DOI] [PMC free article] [PubMed] [Google Scholar]
- 11.Kanehisa M, Goto S, Sato Y, Furumichi M, Tanabe M. KEGG for integration and interpretation of large-scale molecular data sets. Nucleic Acids Res. 2012;40:D109–D114. doi: 10.1093/nar/gkr988. [DOI] [PMC free article] [PubMed] [Google Scholar]
- 12.The Gene Ontology Consortium. Gene ontology annotations and resources. Nucleic Acids Res. 2013;41:D530–D535. doi: 10.1093/nar/gks1050. [DOI] [PMC free article] [PubMed] [Google Scholar]
- 13.Alexeyenko A, Sonnhammer EL. Global networks of functional coupling in eukaryotes from comprehensive data integration. Genome Res. 2009;19:1107–1116. doi: 10.1101/gr.087528.108. [DOI] [PMC free article] [PubMed] [Google Scholar]
- 14.Östlund G, Schmitt T, Forslund K, Köstler T, Messina DN, Roopra S, Frings O, Sonnhammer EL. InParanoid 7: new algorithms and tools for eukaryotic orthology analysis. Nucleic Acids Res. 2010;38:D196–D203. doi: 10.1093/nar/gkp931. [DOI] [PMC free article] [PubMed] [Google Scholar]
- 15.Ruepp A, Waegele B, Lechner M, Brauner B, Dunger-Kaltenbach I, Fobo G, Frishman G, Montrone C, Mewes H-W. CORUM: the comprehensive resource of mammalian protein complexes-2009. Nucleic Acids Res. 2010;38:D497–D501. doi: 10.1093/nar/gkp914. [DOI] [PMC free article] [PubMed] [Google Scholar]
- 16.Guldener U, Münsterkötter M, Kastenmüller G, Strack N, van Helden J, Lemer C, Richelles J, Wodak SJ, García-Martínez J, Pérez-Ortín JE, et al. CYGD: the Comprehensive Yeast Genome Database. Nucleic Acids Res. 2005;33:D364–D368. doi: 10.1093/nar/gki053. [DOI] [PMC free article] [PubMed] [Google Scholar]
- 17.UniProt Consortium. Update on activities at the Universal Protein Resource (UniProt) in 2013. Nucleic Acids Res. 2013;41:D43–D47. doi: 10.1093/nar/gks1068. [DOI] [PMC free article] [PubMed] [Google Scholar]
- 18.Razick S, Magklaras G, Donaldson IM. iRefIndex: a consolidated protein interaction database with provenance. BMC Bioinformatics. 2008;9:405. doi: 10.1186/1471-2105-9-405. [DOI] [PMC free article] [PubMed] [Google Scholar]
- 19.Lee I, Li Z, Marcotte EM. An improved, bias-reduced probabilistic functional gene network of baker's yeast, Saccharomyces cerevisiae. PLoS One. 2007;2:e988. doi: 10.1371/journal.pone.0000988. [DOI] [PMC free article] [PubMed] [Google Scholar]
- 20.Lee I, Date SV, Adai AT, Marcotte EM. A probabilistic functional network of yeast genes. Science. 2004;306:1555–1558. doi: 10.1126/science.1099511. [DOI] [PubMed] [Google Scholar]
- 21.Huttenhower C, Haley EM, Hibbs MA, Dumeaux V, Barrett DR, Coller HA, Troyanskaya OG. Exploring the human genome with functional maps. Genome Res. 2009;19:1093–1106. doi: 10.1101/gr.082214.108. [DOI] [PMC free article] [PubMed] [Google Scholar]
- 22.Kerrien S, Aranda B, Breuza L, Bridge A, Broackes-Carter F, Chen C, Duesbury M, Dumousseau M, Feuermann M, Hinz U, et al. The IntAct molecular interaction database in 2012. Nucleic Acids Res. 2012;40:D841–D846. doi: 10.1093/nar/gkr1088. [DOI] [PMC free article] [PubMed] [Google Scholar]
- 23.Gerstein MB, Kundaje A, Hariharan M, Landt SG, Yan K-K, Cheng C, Mu XJ, Khurana E, Rozowsky J, Alexander R, et al. Architecture of the human regulatory network derived from ENCODE data. Nature. 2012;488:91–100. doi: 10.1038/nature11245. [DOI] [PMC free article] [PubMed] [Google Scholar]
- 24.The ENCODE Project Consortium. A user’s guide to the encyclopedia of DNA elements (ENCODE) PLoS Biol. 2011;9:e1001046. doi: 10.1371/journal.pbio.1001046. [DOI] [PMC free article] [PubMed] [Google Scholar]
- 25.Roy S, Ernst J, Kharchenko PV, Kheradpour P, Negre N, Eaton ML, Landolin JM, Bristow CA, Ma L, et al. The modENCODE Consortium. Identification of functional elements and regulatory circuits by Drosophila modENCODE. Science. 2010;330:1787–1797. doi: 10.1126/science.1198374. [DOI] [PMC free article] [PubMed] [Google Scholar]
- 26.Gerstein MB, Lu ZJ, Van Nostrand EL, Cheng C, Arshinoff BI, Liu T, Yip KY, Robilotto R, Rechtsteiner A, Ikegami K, et al. Integrative analysis of the Caenorhabditis elegans genome by the modENCODE project. Science. 2010;330:1775–1787. doi: 10.1126/science.1196914. [DOI] [PMC free article] [PubMed] [Google Scholar]
- 27.Abdulrehman D, Monteiro PT, Teixeira MC, Mira NP, Lourenco AB, Santos,dos SC, Cabrito TR, Francisco AP, Madeira SC, Aires RS, et al. YEASTRACT: providing a programmatic access to curated transcriptional regulatory associations in Saccharomyces cerevisiae through a web services interface. Nucleic Acids Res. 2011;39:D136–D140. doi: 10.1093/nar/gkq964. [DOI] [PMC free article] [PubMed] [Google Scholar]
- 28.Pellegrini M, Marcotte EM, Thompson MJ, Eisenberg D, Yeates TO. Assigning protein functions by comparative genome analysis: protein phylogenetic profiles. Proc. Natl Acad. Sci. USA. 1999;96:4285–4288. doi: 10.1073/pnas.96.8.4285. [DOI] [PMC free article] [PubMed] [Google Scholar]
- 29.Barker D, Pagel M. Predicting functional gene links from phylogenetic-statistical analyses of whole genomes. PLoS Comput. Biol. 2005;1:e3. doi: 10.1371/journal.pcbi.0010003. [DOI] [PMC free article] [PubMed] [Google Scholar]
- 30.Huynen MA, Snel B, Lathe W, III, Bork P. Predicting protein function by genomic context: quantitative evaluation and qualitative inferences. Genome Res. 2000;10:1204–1210. doi: 10.1101/gr.10.8.1204. [DOI] [PMC free article] [PubMed] [Google Scholar]
- 31.Barker D, Meade A, Pagel M. Constrained models of evolution lead to improved prediction of functional linkage from correlated gain and loss of genes. Bioinformatics. 2007;23:14–20. doi: 10.1093/bioinformatics/btl558. [DOI] [PubMed] [Google Scholar]
- 32.Cokus S, Mizutani S, Pellegrini M. An improved method for identifying functionally linked proteins using phylogenetic profiles. BMC Bioinformatics. 2007;8:S7. doi: 10.1186/1471-2105-8-S4-S7. [DOI] [PMC free article] [PubMed] [Google Scholar]
- 33.von Mering C, Huynen MA, Daniel J, Schmid S, Bork P, Snel B. STRING: a database of predicted functional associations between proteins. Nucleic Acids Res. 2003;31:258–261. doi: 10.1093/nar/gkg034. [DOI] [PMC free article] [PubMed] [Google Scholar]
- 34.Berglund AC, Erik S, Östlund G, Sonnhammer EL. InParanoid 6: eukaryotic ortholog clusters with inparalogs. Nucleic Acids Res. 2008;36:D263–D266. doi: 10.1093/nar/gkm1020. [DOI] [PMC free article] [PubMed] [Google Scholar]
- 35.Alexeyenko A, Schmitt T, Tjärnberg A, Guala D, Frings O, Sonnhammer EL. Comparative interactomics with Funcoup 2.0. Nucleic Acids Res. 2012;40:D821–D828. doi: 10.1093/nar/gkr1062. [DOI] [PMC free article] [PubMed] [Google Scholar]
- 36.Kalaev M, Smoot M, Ideker T, Sharan R. NetworkBLAST: comparative analysis of protein networks. Bioinformatics. 2008;24:594–596. doi: 10.1093/bioinformatics/btm630. [DOI] [PubMed] [Google Scholar]
- 37.Flannick J, Novak A, Do CB, Srinivasan BS, Batzoglou S. Automatic parameter learning for multiple local network alignment. J. Comput. Biol. 2009;16:1001–1022. doi: 10.1089/cmb.2009.0099. [DOI] [PMC free article] [PubMed] [Google Scholar]
- 38.Liao CS, Lu K, Baym M, Singh R, Berger B. IsoRankN: spectral methods for global alignment of multiple protein networks. Bioinformatics. 2009;25:i253–i258. doi: 10.1093/bioinformatics/btp203. [DOI] [PMC free article] [PubMed] [Google Scholar]
- 39.Östlund G, Lindskog M, Sonnhammer EL. Network-based Identification of novel cancer genes. Mol. Cell. Proteomics. 2010;9:648–655. doi: 10.1074/mcp.M900227-MCP200. [DOI] [PMC free article] [PubMed] [Google Scholar]
- 40.Klammer M, Roopra S, Sonnhammer EL. jSquid: a Java applet for graphical on-line network exploration. Bioinformatics. 2008;24:1467–1468. doi: 10.1093/bioinformatics/btn213. [DOI] [PubMed] [Google Scholar]
- 41.Zwolinska AK, Heagle Whiting A, Beekman C, Sedivy JM, Marine J-C. Suppression of Myc oncogenic activity by nucleostemin haploinsufficiency. Oncogene. 2012;31:3311–3321. doi: 10.1038/onc.2011.507. [DOI] [PMC free article] [PubMed] [Google Scholar]