Abstract
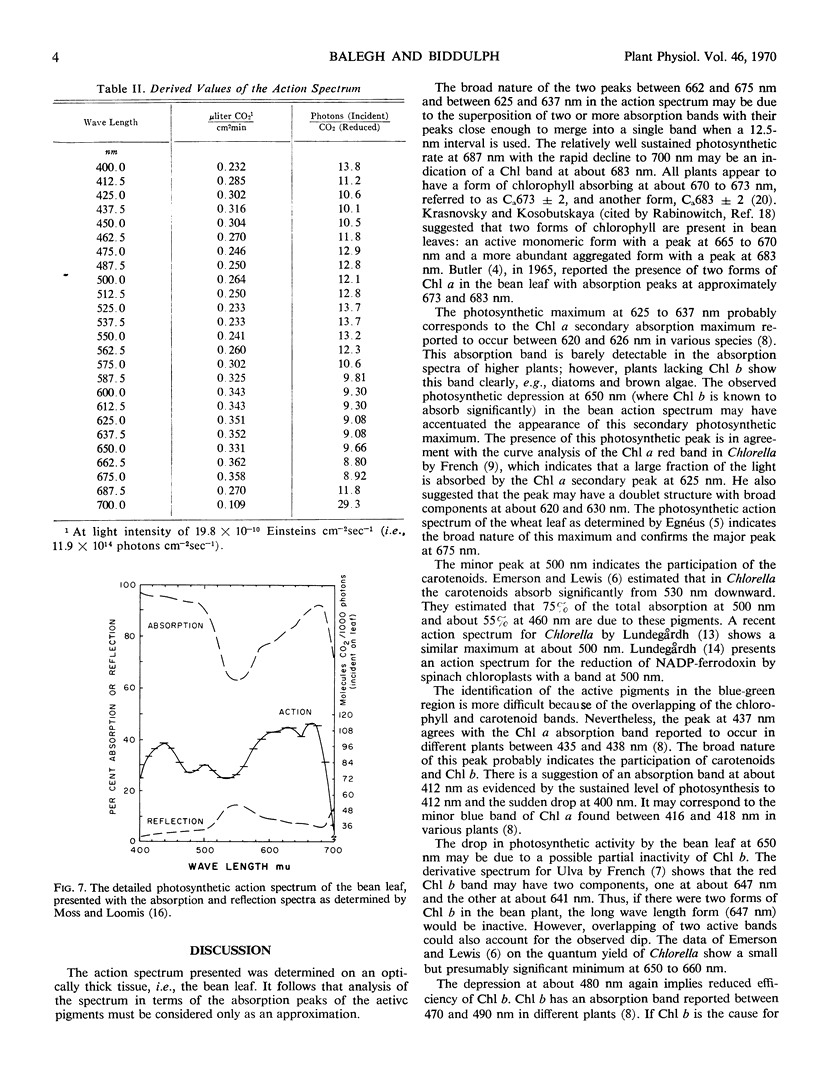
The photosynthetic action spectrum of the bean plant leaf, Phaseolus vulgaris L. (variety Red Kidney), has been determined with a diffraction grating illuminated by a 6500-watt xenon arc. An infrared CO2 analyzer was used to determine the gross photosynthetic rate of the terminal leaflet of the first trifoliate leaf. The rate was measured as a function of the light intensity at steps of 12.5 nanometers which approximates the length of the leaflet used. Twenty-five curves between 400 and 700 nanometers were used to establish the action spectrum. All light curves were some linear function of the incident intensity, and all were extrapolated to zero. The action spectrum shows the following features. (a) there are two peaks (i.e., at about 670 and 630 nanometers) and a shoulder between 600 and 612 nanometers in the red region where the highest rate of photosynthesis is found. Lower peaks in descending order are found in the blue (at about 437 nanometers) and the green (at about 500 nanometers) regions. (b) There are two small minima at about 650 nanometers and between 470 and 480 nanometers, and a broad minimum is found between 540 and 530 nanometers. (c) The photosynthetic rate declines rapidly above 680 nanometers, reaching the lowest value at 700 nanometers. (d) At wave lengths below the blue maximum, the rate decreases progressively to 400 nanometers.
Full text
PDF
Selected References
These references are in PubMed. This may not be the complete list of references from this article.
- BASSHAM J. A., SHIBATA K., CALVIN M. Quantum requirement in photosynthesis related to respiration. Biochim Biophys Acta. 1955 Jul;17(3):332–340. doi: 10.1016/0006-3002(55)90380-2. [DOI] [PubMed] [Google Scholar]
- Butler W. L. Development of photosynthetic system 1 and 2 in a greening leaf. Biochim Biophys Acta. 1965 May 25;102(1):1–8. doi: 10.1016/0926-6585(65)90198-6. [DOI] [PubMed] [Google Scholar]
- MONK G. S., EHRET C. F. Design and performance of a biological spectrograph. Radiat Res. 1956 Jul;5(1):88–106. [PubMed] [Google Scholar]
- Moss R. A., Loomis W. E. Absorption Spectra of Leaves. I. The Visible Spectrum. Plant Physiol. 1952 Apr;27(2):370–391. doi: 10.1104/pp.27.2.370. [DOI] [PMC free article] [PubMed] [Google Scholar]
- Ozbun J. L., Volk R. J., Jackson W. A. Effects of Light and Darkness on Gaseous Exchange of Bean Leaves. Plant Physiol. 1964 Jul;39(4):523–527. doi: 10.1104/pp.39.4.523. [DOI] [PMC free article] [PubMed] [Google Scholar]
- STRAIN H. H. Cellular opacity and the activity of chloroplast pigments in photo-synthesis. Science. 1950 Aug 11;112(2902):161–164. doi: 10.1126/science.112.2902.161. [DOI] [PubMed] [Google Scholar]


