

Abstract
Several gene expression profiles have been reported to predict breast cancer response to neoadjuvant chemotherapy. These studies often consider breast cancer as a homogeneous entity, although higher rates of pathologic complete response (pCR) are known to occur within the basal-like subclass. We postulated that profiles with higher predictive accuracy could be derived from a subset analysis of basal-like tumors in isolation. Using a previously described “intrinsic” signature to differentiate breast tumor subclasses, we identified 50 basal-like tumors from two independent clinical trials associated with gene expression profile data. 24 tumor data sets were derived from a 119-patient neoadjuvant trial at our institution and an additional 26 tumor data sets were identified from a published data set (Hess et al. J Clin Oncol 24:4236–4244, 2006). The combined 50 basal-like tumors were partitioned to form a 37 sample training set with 13 sequestered for validation. Clinical surveillance occurred for a mean of 26 months. We identified a 23-gene profile which predicted pCR in basal-like breast cancers with 92% predictive accuracy in the sequestered validation data set. Furthermore, distinct cluster of patients with high rates of cancer recurrence was observed based on cluster analysis with the 23-gene signature. Disease-free survival analysis of these three clusters revealed significantly reduced survival in the patients of this high recurrence cluster. We identified a 23-gene signature which predicts response of basal-like breast cancer to neoadjuvant chemotherapy as well as disease-free survival. This signature is independent of tissue collection method and chemotherapeutic regimen.
Keywords: Breast cancer, Expression profiling, Therapeutic response
Introduction
Multiple studies have identified gene expression signatures to predict the response of breast cancer to neoadjuvant chemotherapy [1–9]. An ideal signature would identify, at the presentation of disease, those patients who would benefit from specific chemotherapy regimens and allow the remainder to be spared of its side-effects. Most studies aimed at identifying such a signature have considered breast cancer as a single homogeneous entity. The molecular heterogeneity of breast cancer, however, has been demonstrated with the “intrinsic” gene signature [10]. At least three major molecular subclasses—basal-like (BL), luminal, and erbB2-positive—have subsequently been found to have distinct clinical outcomes [11–13]. Studies are emerging which suggest differing complete pathological response (pCR) rates of breast cancer to neoadjuvant cytotoxic chemotherapy among the molecular subclasses; notably, significantly higher rates of pCR are achieved with BL-like tumors [11, 12, 14]. Given these observations, one would expect a gene signature predictive of response to chemotherapy derived from unclassified breast cancer data to contain redundant information with that of the intrinsic gene signature. The distinct biological make-up of these tumor subclasses—as evidenced by their differential clinical course, expression of hormonal receptors, and response to treatment—warrants distinct analysis for each class to arrive at optimal and customized predictors of response to therapy.
Prospective trials have demonstrated that those patients with a pCR of the primary tumor have significantly improved disease-free survival and overall survival when compared with patients who do not have a pCR [15–17]. Based on these data, pCR is frequently used as a surrogate for overall survival in the design of clinical trials. In this study, we have identified a gene expression signature which predicts pCR response to neoadjuvant chemotherapy within the BL subclass of breast tumors. Analysis of samples from patients with pCR versus those with residual disease (RD) following neoadjuvant chemotherapy yielded a gene expression signature which is independent of chemotherapeutic regimen or method of tissue collection. Clinical surveillance showed that this signature may differentiate between disease-free survival as well.
Patients and methods
Patient population
119 patients with clinical stage II or III breast cancer, between March 2003 and 2006 at Washington University, were enrolled into a prospective clinical trial of four cycles of epirubicin (75 mg/m2) and docetaxel (75 mg/m2) every 3 weeks prior to surgery and two cycles after surgery. Half of the patients received zoledronic acid every 3 weeks beginning at the time of chemotherapy. Tumor size was measured from mammograms and ultrasound studies prior to treatment. pCR was defined as no residual invasive disease in the breast or lymph nodes. Residual in situ carcinoma was also considered a pCR [18]. Estrogen receptor (ER) and Her-2 status was determined on a diagnostic core obtained before treatment. The mean follow-up was 2 years with annual restaging. This study protocol was approved by the Institutional Review Board at Washington University. Written informed consent was obtained from each patient.
Tissue collection and gene expression profiling
RNA was extracted from snap frozen 14-gauge core samples obtained from pre-treatment tumors. Specimens containing more than 40% of tumor on histological examination were analyzed. Trizol reagent (InVitrogen) was used to isolate total RNA. RNA was assessed by Agilent Bioanalyzer (Agilent, Palo Alto, CA). Affymetrix target preparation, array hybridization, and array scanning were performed using standard protocols. 15 μg of biotinylated cRNAs were hybridized to Affymetrix U133Plus2 GeneChip™ oligonucleotide arrays. Array images were processed using the Affymetrix Microarray Analysis Suite (MAS5) algorithm. The arrays were scaled to a target intensity of 1,500 and exported to the Bioinformatics Core Facility (http://bioinformatics.wustl.edu).
Microarray gene expression analysis
Array analysis was from 70 specimens. In order to identify 24 BL samples, WU-BLAST (http://blast.wustl.edu/) was used to identify the corresponding Affymetrix oligonucleotide probe sets to that of the intrinsic gene signature [10]. Hierarchical clustering was performed using Cluster 3.0 (http://bonsai.ims.u-tokyo.ac.jp/~mdehoon/software/cluster/software.htm#ctv). The intrinsic signature from each of the 70 arrays was scored against the signature of the five tumor subclasses from Sorlie et al. using Pearson’s correlation coefficient [10]. Signatures with highest correlation to the Sorlie et al. BL cluster as compared to the other tumor types were identified as BL tumors. A similar procedure was used to identify the 26 BL tumors within the microarray data set published by Hess et al. [4].
Analysis to identify probes which exhibited differential expression between pCR and RD samples proceeded as follows: In order to reduce the baseline noise within the data, probe sets with fewer than 50% ‘P’ calls, as determined by the MAS5 algorithm, across all 70 samples accrued at this institution were retained for further analysis. In order to account for potential block effects between the data of the two studies, expression values of each probe set were mean-centered and variance-normalized independently within each study. The processed expression values from probe sets common to both studies were then combined to form a data set consisting of 50 arrays with 13,181 probe sets within each array. In order to partition the samples from the two studies into training and validation sets, approximately four-fifths of the arrays of each study were chronologically partitioned within each study, then combined to form a 37 array training set. The remainder were combined and sequestered to form a 13 array validation set.
Differential expression between pCR and RD samples was evaluated with a moderated t-statistic using lmFit and eBayes of the LIMMA package within the R statistics package [19, 20]. Discrimination profiles were constructed by incremental inclusion of the most informative probe sets. Each of these profiles was then evaluated for its ability to predict pCR using linear discriminant analysis (LDA) with leave-one-out (LOO) cross validation. The nominally optimal model was identified among the profiles with minimal error rates in LOO cross validation. In order to assess the statistical significance of the result, this search algorithm in its entirety was repeated on 500 data sets in which the data within each probe set were randomized. Each randomized data set was analyzed for probes which showed differential expression between pCR and RD outcomes, and the most informative probes arising from the randomized data were evaluated for their ability to predict pCR using LDA with LOO.
Disease-free survival curves were computed using the Kaplan–Meier method as implemented in the R survival library. Tests for statistical differences between these survival curves were performed using survdiff of the R survival package.
Results
Identification of BL tumors
At this institution, 119 patients were enrolled prospectively in a neoadjuvant chemotherapy trial (Table 1). Adequate core biopsies were obtained prior to neoadjuvant therapy from 86 patients, 70 of which fulfilled quality requirements to undergo expression profile analysis. Oligonucleotide probe sets within the Affymetrix U133Plus2 array which corresponded to genes of the intrinsic signature were identified. Hierarchical clustering using the intrinsic signature identified 24 BL tumors (Fig. 1a). As further support of correct BL tumor identification, the tumors of this branch were predominantly ER, progesterone receptor (PR), and HER2 negative by immunohistochemistry compared to the tumor constituents of the other cluster branches (Fig. 1a).
Table 1.
Patient and tumor characteristics of the breast cancers used for expression profiling at this institution and on the basal-like tumors accrued by Hess et al. [4]
| This institution, All
|
This institution, Basal-like
|
Hess et al., Basal-like
|
||||
|---|---|---|---|---|---|---|
| No. | % | No. | % | No. | % | |
| Female | 70 | 24 | 26 | |||
| Age (years) | ||||||
| Median | 48 | 48 | 50 | |||
| Range | 29–69 | 34–62 | 29–71 | |||
| Race | ||||||
| Caucasian | 48 | 68 | 14 | 58 | 19 | 73 |
| African American | 20 | 29 | 10 | 42 | 2 | 8 |
| Others | 2 | 3 | 5 | 19 | ||
| Histology | ||||||
| Ductal | 64 | 91 | 24 | 100 | 21 | 81 |
| Lobular | 1 | 2 | 0 | 0 | 0 | 0 |
| Mucinous | 5 | 7 | 0 | 0 | 0 | 0 |
| Others | 5 | 9 | ||||
| Size | ||||||
| T2 | 56 | 80 | 20 | 83 | 11 | 42 |
| T3 | 10 | 14 | 3 | 12 | 4 | 15 |
| Grade | ||||||
| 1 | 3 | 4 | 0 | 0 | 0 | 0 |
| 2 | 22 | 32 | 2 | 8 | 1 | 4 |
| 3 | 45 | 64 | 22 | 92 | 25 | 96 |
| Nodal status | ||||||
| N0 | 23 | 33 | 15 | 63 | 6 | 23 |
| N1 | 26 | 37 | 6 | 25 | 15 | 58 |
| N2 | 17 | 25 | 1 | 4 | 3 | 11 |
| N3 | 3 | 4 | 2 | 8 | 2 | 8 |
| Unknown | 1 | 1 | ||||
| ER | ||||||
| Positive | 34 | 49 | 1 | 4 | 1 | 4 |
| Negative | 36 | 51 | 23 | 96 | 25 | 96 |
| PR | ||||||
| Positive | 25 | 36 | 0 | 0 | 5 | 19 |
| Negative | 45 | 64 | 24 | 100 | 21 | 81 |
| HER-2 | ||||||
| Positive | 34 | 49 | 1 | 4 | 1 | 4 |
| Negative | 36 | 51 | 23 | 96 | 25 | 96 |
Fig. 1.

Identification of basal-like tumors. Unsupervised hierarchical clustering of samples from WU using the “intrinsic” signature (a) and Hess et al. (b) [4]. The red branch demarcates BL tumors. Blue marks denote positive expression of ER, PR,and HER2. Black marks denote pCR. Probe set numbers differ between the two plots as the result of oligonucleotide platforms. For the analyses, probe sets common to both chips were used. In the right-most branch of (b) (blue), samples had low values and were therefore excluded from the analysis
In order to obtain additional sample numbers for analysis, four studies were evaluated to determine the compatibility of merging the published data sets with ours [5, 21, 22]. Data from three of these studies were unable to be incorporated in this analysis for reasons including incompatibility of the platforms and the presence of too few BL tumors within the data set [5, 21, 22]. Data from Hess et al. were derived from a microarray platform compatible with that of this study and contained sufficient probe sets to identify the basal subtype using the intrinsic signature [4]. In Hess et al., 133 patients underwent fine needle aspiration (FNA) tissue collection prior to any treatment and subsequently received 12 weekly treatments with paclitaxel followed by four treatments with fluorouracil, doxorubicin, and cyclophosphamide. Application of the intrinsic signature on the 100 profiles in the published data set yielded data from 26 additional BL tumors (Fig. 1b).
Fifty BL tumor expression profiles were thus assembled from two independent studies (Table 1). The patient and tumor characteristics in each data set were similar in age, histology, and grade. In our data set, there were a greater percentage of African-American patients (42 vs. 8%), larger tumors (83 vs. 42% T2 tumors) and greater percentage of N0 disease (63 vs. 23%) (Table 1). 62% of the patients with basal tumors had pCR at the time of surgery in the study by Hess et al., compared with 21% in the patients at our institution (Table 2).
Table 2.
Distribution of pCR and RD response to chemotherapy within all breast tumors and basal-like subclass of the two studies
| pCR
|
RD
|
Total | |||
|---|---|---|---|---|---|
| No. | % | No. | % | ||
| This institution | |||||
| All tumors | 11 | 16 | 59 | 84 | 70 |
| Basal-like | 5 | 21 | 19 | 79 | 24 |
| Hess et al. | |||||
| All tumors | 32 | 25 | 86 | 68 | 126 |
| Basal-like | 16 | 62 | 10 | 38 | 26 |
| Combined basal-like tumors | |||||
| Training group | 16 | 43 | 21 | 57 | 37 |
| Test group | 5 | 38 | 8 | 62 | 13 |
Gene expression signature of pathologic complete response
The expression data were normalized independently within each study and then combined for further analysis. The BL tumor profiles were partitioned chronologically into training and validation groups in a balanced manner to ensure equal representation from each study. Data from both studies were included in the training set with the expectation that this would facilitate the selection of probe sets exhibiting differential expression across treatment response without influence of the specific chemotherapy used or method of sample collection. Within the 37 sample training group, a moderated t-statistic ranked the probe sets by their degree of differential expression as related to treatment response. A search using LDA analysis with LOO cross validation found that inclusion of the top 25 probe sets in the discrimination model yielded the most parsimonious model with optimal predictive results (Fig. 2). These 25 probes correspond to 23-genes which encompass a diverse array of cellular functions (Table 3). None of these 23-genes exhibited differential expression in a previous comparison of tumor expression profiles derived from core biopsies versus fine needle aspirates from the same tumor suggesting that the profile is independent of the tumor-sampling method [23].
Fig. 2.
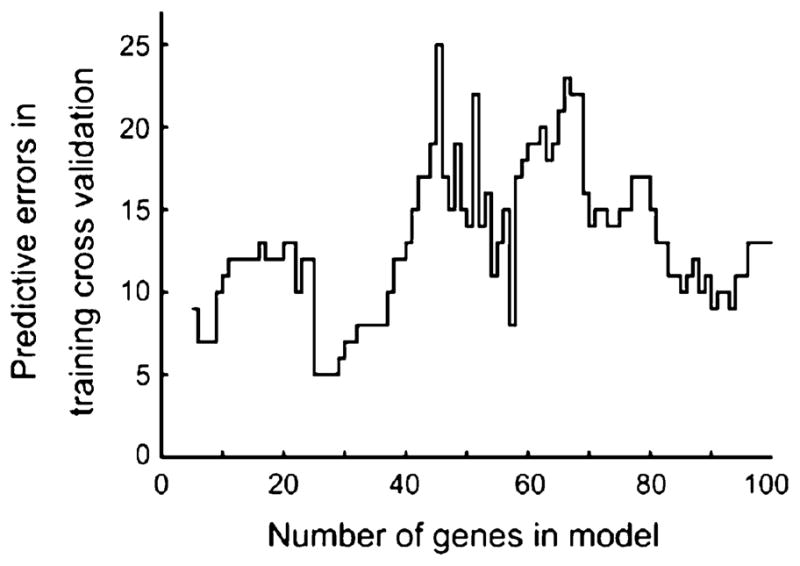
Determination of the optimal number of probe sets. The 50 basal-like tumor samples were partitioned in a balanced manner into a 37-sample training group and a 13-sample validation group. A moderated t-statistic ranked the probe sets by their degree of differential expression as related to treatment response. A search using linear discrimination analysis with leave-one-out cross validation found that inclusion of the top 25 probe sets in the discrimination model yielded the optimal and most parsimonious predictive results
Table 3.
Functional classification of the 23-genes corresponding to the predictive 25 probe sets
| Class | Gene symbol | Gene name | Probe sets |
|---|---|---|---|
| Chromatin remodeling | SMARCA2 | SWI/SNF related regulator of chromatin | 206542_s_at, 206544_x_at |
| SMARCD3 | SWI/SNF related regulator of chromatin | 204099_at | |
| Expression regulation | ITGB4BP | Similar to eIF-6, B4 integrin interacter | 210213_s_at |
| ERF | Ets2 repressor factor | 203643_at | |
| ACO1 | Aconitase 1 | 207071_s_at | |
| PRPF38B | PRP38 pre-mRNA processing factor 38 | 218040_at | |
| Ubiquitin regulation | USP25 | Ubiquitin specific peptidase 25 | 220419_s_at |
| USP12 | Ubiquitin specific peptidase 12 | 213327_s_at | |
| SENP6 | SUMO1/sentrin specific peptidase 6 | 212319_at | |
| Cell motility, adhesion | ELMO1 | Engulfment and cell motility 1 | 204513_s_at |
| ENTPD1 | Engulfment and cell motility 1 | 209473_at | |
| GNE | Glucosamine (UDP-N-acetyl)-2-epimerase | 205042_at | |
| Drug metabolism | NNMT | Nicotinamide N-methyltransferase | 202237_at |
| ABCB1 | ATP-binding cassette, sub-family B (MDR/TAP) | 209994_s_at | |
| Signal transduction | SHC1 | Src homology 2 domain containing transforming protein 1 | 214853_s_at |
| TNFRSF1A | Tumor necrosis factor receptor superfamily, member 1A | 207643_s_at | |
| PIP5K1B | Phosphatidylinositol-4-phosphate 5-kinase, type I, beta | 205632_at | |
| Cell proliferation | TIMP1 | Metallopeptidase inhibitor 1 | 201666_at |
| Miscellaneous | FLJ32679 | Golgin-like hypothetical protein | 22149_x_at |
| CG018 | NEDD4 binding protein 2-like 1 | 213375_s_at | |
| TRIM68 | Tripartite motif-containing 68 | 219405_at | |
| UTRN | Utrophin | 213022_s_at 213023_at |
|
| GNGT2 | G protein, gamma transducing activity Polypeptide 2 |
217629_at |
Using the independent 13 sample validation set, the 23-gene signature achieved an overall accuracy of 0.92 (95% CI 0.64–1) with a positive predictive value of one (95% CI 0.4–1) (Table 4; Fig. 3). In order to assess the chance occurrence of this result, the search procedure was repeated on 500 data sets generated by the randomization of data within each probe set. No instance of predictive accuracy was observed which matched or exceeded that which resulted from analysis of the actual data. The observed average predictive accuracy with the randomized data was 0.47 (95% CI 0.46–0.49).
Table 4.
Performance of the 23-gene prediction profile on the validation set
| Predicted
|
|||
|---|---|---|---|
| pCR | RD | Total | |
| Observed | |||
| pCR | 4 | 1 | 5 |
| RD | 0 | 8 | 8 |
| Total | 4 | 9 | 13 |
| Percentage | Numbers | 95% CI | |
|---|---|---|---|
| Sensitivity | 80 | 4/5 | 28–99 |
| Specificity | 100 | 8/8 | 63–100 |
| Accuracy | 92 | 12/13 | 64–100 |
| PPV | 100 | 4/4 | 40–100 |
| NPV | 89 | 8/9 | 52–100 |
PPV positive predictive value; NPV negative predictive value
Fig. 3.
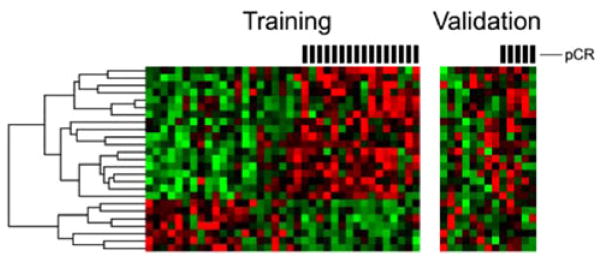
Training and validation heat plots of the 25 probe model. Using linear discrimination analysis, each of the 13 validation samples were compared to the training data and predicted to have had pCR or RD to neoadjuvant therapy. All RD samples were correctly categorized as such, as were five of six pCR samples. Overall accuracy was 92% (95% CI 64–100), with sensitivity of 80% (95% CI 28–99) and specificity of 100% (95% CI 63–100). Hash marks above heat plots mark samples which had pCR to neoadjuvant therapy
Expression signature and disease-free survival
In order to examine the internal consistency of the expression signature, the expression profiles of all 50 BL tumors were subjected to hierarchical clustering using the 23-gene expression signature. Expected clusters enriched for pCR and RD samples were observed (Fig. 4). Notably, a small but distinct cluster of eight patients exhibited a high rate of disease recurrence during post-therapy surveillance. Although chemotherapy achieved pCR in half of these eight patients, six nevertheless developed recurrent disease (Table 5). Kaplan–Meier survival analysis demonstrated a statistically significant difference in survival among the pCR and RD groups as compared to the high recurrence groups (P<0.01), while a similar analysis between the pCR and RD groups alone did not achieve statistical significance (Fig. 5).
Fig. 4.
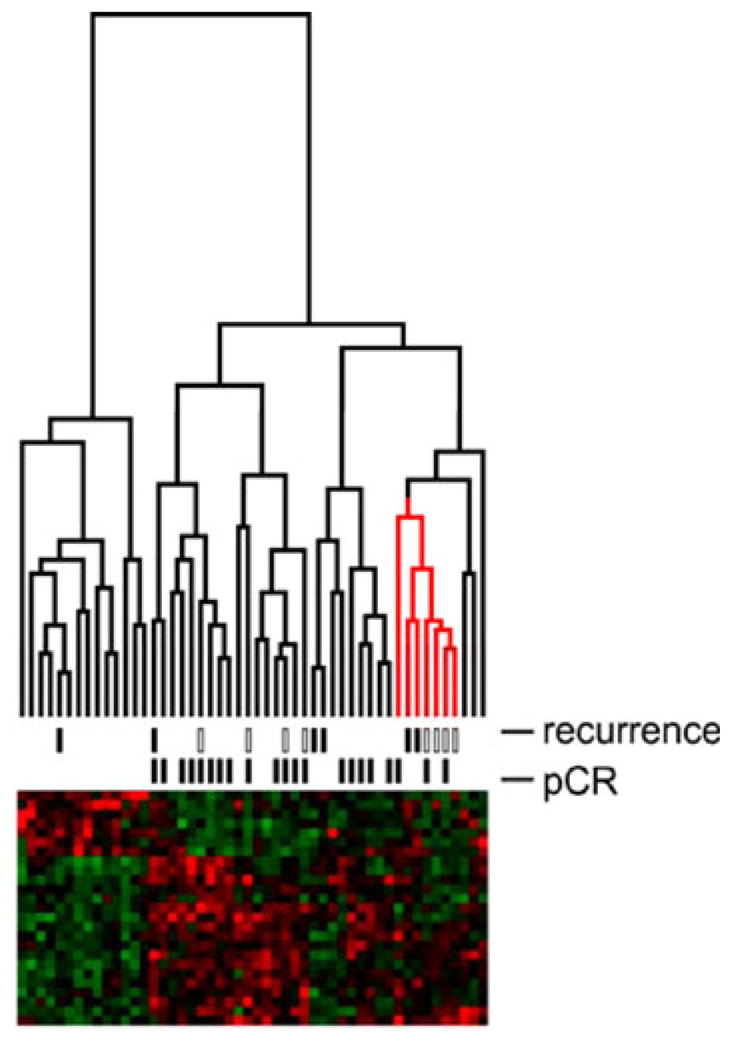
Internal consistency of the expression signature. The expression profiles of the 50 basal-like tumors were clustered using the 23-gene expression signature. The data from Hess et al. are indicated in the recurrence hashes by open boxes; the data from this institution are indicated by closed boxes
Table 5.
Tabulation of pCR and recurrence events within the three groups resulting from hierarchical clustering of the 50 basal-like tumors with the 23-gene prediction profile
| Cluster group | pCR
|
Recurrence
|
||
|---|---|---|---|---|
| No. | % | No. | % | |
| pCR | 18 | 62 | 7 | 24 |
| RD | 0 | 0 | 1 | 7 |
| High recurrence | 3 | 14 | 6 | 86 |
Fig. 5.

Kaplan–Meier survival analysis. Disease-free survival estimates for the three groups—pCR, RD, and high recurrence—resulting from hierarchical clustering of the 50 basal-like tumors with the 23-gene prediction profile demonstrated a statistically significant difference in survival between the pCR, RD and high recurrence groups (P<0.01). Survival analysis of the pCR and RD groups alone did not achieve statistical significance
Discussion
BL breast cancers are associated with a poor clinical outcome [24, 25]. Response of the primary tumor to neoadjuvant chemotherapy has been related to subsequent disease-free and overall survival, making this a valuable intermediate end-point for treatment evaluation. Using array data from 50 BL tumors combined from two independent studies, we have identified a 23-gene expression signature which predicts pCR of BL breast tumors to neoadjuvant chemotherapy regimens containing an anthracycline and a taxane. More importantly, this signature identifies a group of patients who are at high risk of disease recurrence. Our data suggest that within the BL breast cancer molecular subclassification there are further subtypes which have differing biological behavior, and that pCR itself within the BL subtype may not always portend a favorable prognosis.
Several recent studies suggest that gene expression profiles can achieve greater accuracy in predicting breast tumor response to neoadjuvant chemotherapies than clinical predictors alone [7, 9]. There are several approaches for the development of multigene predictor of response to chemotherapy. One approach is to group all breast cancers into either responders or non-responders and define the gene expression difference between these groups. This approach has been successfully applied to develop prognostic signatures for breast cancer [5, 21]. In these studies, data are usually analyzed from all breast tumors regardless of underlying molecular subclassification. However, recent data indicate that substantive inferences concerning the response of a tumor to neoadjuvant chemotherapy may be made from the subtype of the tumor alone [26, 27]. Since distinct molecular classes of breast cancer exist, stratification of patients by molecular class should yield more accurate class-specific predictors. Therefore, inclusion of specific breast tumor subclasses into a prediction scheme for neoadjuvant chemotherapy should increase its accuracy. In this study, our goal was to develop the best possible classifier for prediction of pCR in the BL breast cancer subtype.
Considerable barriers exist for molecular analysis using specific breast tumor subtypes. As each subclass exists as a fraction of all breast tumors, several-fold increases in patient accrual rates would be required to achieve adequate sample numbers for analyses. As an alternative approach, we combined the data sets from two neoadjuvant chemotherapy studies. Multiple published array sets were examined [5, 21]. Due to compatibility in platforms and number of data sets available, we chose to work with the set published by Hess et al. [4]. This allowed us to develop a 23-gene predictor of pCR in BL tumors with high accuracy. The genes identified are involved in a wide variety of cell functions including chromatin remodeling, gene expression cell proliferation, ubiquitin regulation, cell motility, and signal transduction. Interestingly, two of the genes NNMT and ABCB1 are involved in drug metabolism. However, not all of these genes may play a causative role in determining sensitivity to chemotherapy; some may represent distant downstream transcription effects of biological events that influence drug sensitivity. In a smaller study, Rouzier et al. found 61 genes which differed significantly between BL tumors which achieved a pCR and those that did not [11]. None of these 61 genes overlap with the 23-genes found to predict pCR in our data.
Although pCR is a powerful prognostic factor for prolonged survival in patients receiving neoadjuvant chemotherapy [15, 28–30], a significant proportion of patients with pCR develop recurrent disease [31]. Reported series have shown a 5-year recurrence rate in patients with pCR ranging from 13–25% [15, 29, 30, 32]. Of the 50 BL tumors used in this analysis, 28% (n = 14) of the patients developed recurrences within 5 years of diagnosis and half (n = 7) of these patients had a pCR. This paradoxical feature is consistent with other studies conducted in BL breast cancer which were identified using gene expression profiling [11, 14].
Although the 23-gene signature was not constructed to predict disease-free survival, it is interesting to note that this signature also identified a minor subclass of patients who developed recurrent disease, independent of whether they exhibited pCR. The number of patients in this group was small but the effect reached statistical significance when compared to the remaining tumors. In contrast, survival analysis of the pCR versus the RD groups did not substantiate prior associations of pCR with increased disease-free survival [15, 29]. This is consistent with the findings of Keam et al. who report that although a higher rate of pCR is achieved in patients with triple negative tumors, these patients had higher relapse free survival and shorter overall survival [27]. It has been reported that recurrence rates with pCR progressively increased depending on the initial stage at diagnosis [33]. Patients in this study had almost uniformly clinical stage II/III tumors, and therefore stage at diagnosis is unlikely to account for the clustering of these patients. Our observation is more likely due to the biology of the tumor and resistance to systemic therapy [10, 12]. Although this study may not have been powered adequately to fully evaluate disease-free survival, future studies may be warranted to examine whether pCR is an accurate predictor of disease-free survival within the BL subtype of breast cancer.
In order to obtain a sufficient number of BL breast tumors for our analysis, we combined data from two different studies. Notable differences existed between the experimental designs of our study and that of Hess et al. which provided the second set of tumor expression data used in this meta-analysis. Core biopsies were collected from our study, whereas Hess et al. acquired fine needle aspirates [4]. Although these methods result in different ratios of tumor versus stromal cells in the collected sample, expression profiles derived from these sample collection methods have been found to be largely concordant with only a small set of genes exhibiting differential expression [23]. Another difference in methodology was the number of chemotherapy treatments administered before pathological analysis and the chemotherapeutic regimens used. However, both regimens contained an anthracycline and a taxane. Although this would not affect the tumor expression profiles given that the samples were collected prior to therapy administration, it may have affected the percentage of pCR observed between the two studies. Various neoadjuvant chemotherapy regimens have previously been observed to achieve different pCR rates and would presumably affect the composition of the derived prediction model [34]. Despite these and other technical differences, we found an expression signature with sufficient signal to overcome these potential sources of bias between the two data sets. A prediction model derived from patients treated with heterogeneous regimens of chemotherapy may not result in optimal predictive accuracy for a specific regimen. However, a practically useful predictive model would be generally applicable to the reality of diverse clinical practice. With these constraints, a model could reasonably be expected to have high specificity for identifying pCR to neoadjuvant chemotherapy. Arguably, type II errors in detecting pCR are more acceptable from the vantage of oncologic treatment.
Gene expression analyses have identified molecular subtypes that are refining our understanding of breast cancer biology. We have identified a 23-gene signature which predicts pCR in BL breast cancers. Moreover, this signature identifies a subgroup of tumors associated with a decreased disease-free survival. Our data support the concept that there exists biological heterogeneity within the BL breast cancer subtype. It is important to identify patients with BL cancers who may develop systemic failure after achieving a pCR; these patients may benefit from additional therapy.
Acknowledgments
Financial Support: NCI CA111530-01and the Barnes Jewish Hospital Foundation to RLA, NCI P30 CA91842 to MAW and Sanofi-Aventis US
Contributor Information
Yiing Lin, Department of Surgery, Washington University School of Medicine St. Louis, 660 South Euclid Avenue, Campus Box 8109, St. Louis, MO 63110, USA.
Shin Lin, University of Pennsylvania, Philadelphia, PA, USA.
Mark Watson, Department of Pathology and Immunology, Washington University School of Medicine St. Louis, St. Louis, MO, USA.
Kathryn M. Trinkaus, Division of Biostatistics, Washington University School of Medicine St. Louis, St. Louis, MO, USA
Sacha Kuo, Department of Surgery, Washington University School of Medicine St. Louis, 660 South Euclid Avenue, Campus Box 8109, St. Louis, MO 63110, USA.
Michael J. Naughton, Department of Medicine, Washington University School of Medicine St. Louis, St. Louis, MO, USA
Katherine Weilbaecher, Department of Medicine, Washington University School of Medicine St. Louis, St. Louis, MO, USA.
Timothy P. Fleming, Department of Surgery, Washington University School of Medicine St. Louis, 660 South Euclid Avenue, Campus Box 8109, St. Louis, MO 63110, USA
Rebecca L. Aft, Email: aftr@wustl.edu, Department of Surgery, Washington University School of Medicine St. Louis, 660 South Euclid Avenue, Campus Box 8109, St. Louis, MO 63110, USA, John Cochran Veterans Administration Hospital, St. Louis, MO, USA
References
- 1.Bertucci F, Finetti P, Rougemont J, Charafe-Jauffret E, Nasser V, Loriod B, Camerlo J, Tagett R, Tarpin C, Houvenaeghel G, et al. Gene expression profiling for molecular characterization of inflammatory breast cancer and prediction of response to chemotherapy. Cancer Res. 2004;64(23):8558–8565. doi: 10.1158/0008-5472.CAN-04-2696. [DOI] [PubMed] [Google Scholar]
- 2.Hannemann J, Oosterkamp HM, Bosch CAJ, Velds A, Wessels LFA, Loo C, Rutgers EJ, Rodenhuis S, van de Vijver MJ. Changes in gene expression associated with response to neoadjuvant chemotherapy in breast cancer. J Clin Oncol. 2005;23(15):3331–3342. doi: 10.1200/JCO.2005.09.077. [DOI] [PubMed] [Google Scholar]
- 3.Thuerigen O, Schneeweiss A, Toedt G, Warnat P, Hahn M, Kramer H, Brors B, Rudlowski C, Benner A, Schuetz F, et al. Gene expression signature predicting pathologic complete response with gemcitabine, epirubicin, and docetaxel in primary breast cancer. J Clin Oncol. 2006;24(12):1839–1845. doi: 10.1200/JCO.2005.04.7019. [DOI] [PubMed] [Google Scholar]
- 4.Hess KR, Anderson K, Symmans WF, Valero V, Ibrahim N, Mejia JA, Booser D, Theriault RL, Buzdar AU, Dempsey PJ, et al. Pharmacogenomic predictor of sensitivity to preoperative chemotherapy with paclitaxel and fluorouracil, doxorubicin, and cyclophosphamide in breast cancer. J Clin Oncol. 2006;24(26):4236–4244. doi: 10.1200/JCO.2006.05.6861. [DOI] [PubMed] [Google Scholar]
- 5.Ayers M, Symmans WF, Stec J, Damokosh AI, Clark E, Hess K, Lecocke M, Metivier J, Booser D, Ibrahim N, et al. Gene expression profiles predict complete pathologic response to neoadjuvant paclitaxel and fluorouracil, doxorubicin, and cyclophosphamide chemotherapy in breast cancer. J Clin Oncol. 2004;22(12):2284–2293. doi: 10.1200/JCO.2004.05.166. [DOI] [PubMed] [Google Scholar]
- 6.Iwao-Koizumi K, Matoba R, Ueno N, Kim SJ, Ando A, Miyoshi Y, Maeda E, Noguchi S, Kato K. Prediction of docetaxel response in human breast cancer by gene expression profiling. J Clin Oncol. 2005;23(3):422–431. doi: 10.1200/JCO.2005.09.078. [DOI] [PubMed] [Google Scholar]
- 7.Koike Folgueira MAA, Carraro DM, Brentani H, da Costa Patrao DF, Barbosa EM, Netto MM, Caldeira JRF, Katayama MLH, Soares FA, Oliveira CT, et al. Gene expression profile associated with response to doxorubicin-based therapy in breast cancer. Clin Cancer Res. 2005;11(20):7434–7443. doi: 10.1158/1078-0432.CCR-04-0548. [DOI] [PubMed] [Google Scholar]
- 8.Chang JC, Wooten EC, Tsimelzon A, Hilsenbeck SG, Gutierrez MC, Tham Y-L, Kalidas M, Elledge R, Mohsin S, Osborne CK, et al. Patterns of resistance and incomplete response to docetaxel by gene expression profiling in breast cancer patients. J Clin Oncol. 2005;23(6):1169–1177. doi: 10.1200/JCO.2005.03.156. [DOI] [PubMed] [Google Scholar]
- 9.Dressman HK, Hans C, Bild A, Olson JA, Rosen E, Marcom PK, Liotcheva VB, Jones EL, Vujaskovic Z, Marks J, et al. Gene expression profiles of multiple breast cancer phenotypes and response to neoadjuvant chemotherapy. Clin Cancer Res. 2006;12(3):819–826. doi: 10.1158/1078-0432.CCR-05-1447. [DOI] [PubMed] [Google Scholar]
- 10.Sorlie T, Tibshirani R, Parker J, Hastie T, Marron JS, Nobel A, Deng S, Johnsen H, Pesich R, Geisler S, et al. Repeated observation of breast tumor subtypes in independent gene expression data sets. Proc Natl Acad Sci. 2003;100(14):8418–8423. doi: 10.1073/pnas.0932692100. [DOI] [PMC free article] [PubMed] [Google Scholar]
- 11.Rouzier R, Perou CM, Symmans WF, Ibrahim N, Cristofanilli M, Anderson K, Hess KR, Stec J, Ayers M, Wagner P, et al. Breast cancer molecular subtypes respond differently to preoperative chemotherapy. Clin Cancer Res. 2005;11(16):5678–5685. doi: 10.1158/1078-0432.CCR-04-2421. [DOI] [PubMed] [Google Scholar]
- 12.Sorlie T, Perou CM, Tibshirani R, Aas T, Geisler S, Johnsen H, Hastie T, Eisen MB, van de Rijn M, Jeffrey SS, et al. Gene expression patterns of breast carcinomas distinguish tumor subclasses with clinical implications. Proc Natl Acad Sci. 2001;98(19):10869–10874. doi: 10.1073/pnas.191367098. [DOI] [PMC free article] [PubMed] [Google Scholar]
- 13.Banerjee S, Reis-Filho JS, Ashley S, Steele D, Ashworth A, Lakhani SR, Smith IE. Basal-like breast carcinomas: clinical outcome and response to chemotherapy. J Clin Pathol. 2006;59(7):729–735. doi: 10.1136/jcp.2005.033043. [DOI] [PMC free article] [PubMed] [Google Scholar]
- 14.Carey LA, Dees EC, Sawyer L, Gatti L, Moore DT, Collichio F, Ollila DW, Sartor CI, Graham ML, Perou CM. The triple negative paradox: primary tumor chemosensitivity of breast cancer subtypes. Clin Cancer Res. 2007;13(8):2329–2334. doi: 10.1158/1078-0432.CCR-06-1109. [DOI] [PubMed] [Google Scholar]
- 15.Fisher B, Bryant J, Wolmark N, Mamounas E, Brown A, Fisher ER, Wickerham DL, Begovic M, DeCillis A, Robidoux A, et al. Effect of preoperative chemotherapy on the outcome of women with operable breast cancer. J Clin Oncol. 1998;16(8):2672–2685. doi: 10.1200/JCO.1998.16.8.2672. [DOI] [PubMed] [Google Scholar]
- 16.van der Hage JA, van de Velde CJH, Julien J-P, Tubiana-Hulin M, Vandervelden C, Duchateau L. Preoperative chemotherapy in primary operable breast cancer: results from the european organization for research and treatment of cancer trial 10902. J Clin Oncol. 2001;19(22):4224–4237. doi: 10.1200/JCO.2001.19.22.4224. [DOI] [PubMed] [Google Scholar]
- 17.Wang J, Buchholz T, Middleton L, Allred D, Tucker SHK, Esteva F, Hortobagyi G, Sahin A. Assessment of histologic features and expression of biomarkers in predicting pathologic response to anthracycline-based neoadjuvant chemotherapy in patients with breast carcinoma. Cancer. 2002;94(12):3107–3114. doi: 10.1002/cncr.10585. [DOI] [PubMed] [Google Scholar]
- 18.Mazouni C, Peintinger F, Wan-Kau S, Andre F, Gonzalez-Angulo AM, Symmans WF, Meric-Bernstam F, Valero V, Hortobagyi GN, Pusztai L. Residual ductal carcinoma in situ in patients with complete eradication of invasive breast cancer after neoadjuvant chemotherapy does not adversely affect patient outcome. J Clin Oncol. 2007;25(19):2650–2655. doi: 10.1200/JCO.2006.08.2271. [DOI] [PubMed] [Google Scholar]
- 19.Gentleman R, Carey V, Huber W, Irizarry R, Dudoit S. Bioinformatics and computational biology solutions using R and bioconductor. Springer Science; New York: 2005. [Google Scholar]
- 20.Team RDC. R: a language and environment for statistical computing. Vienna: Springer; 2007. [Google Scholar]
- 21.Chang JC, Wooten EC, Tsimelzon A, Hilsenbeck SG, Gutierrez MC, Elledge R, Mohsin S, Osborne CK, Chamness GC, Allred DC, et al. Gene expression profiling for the prediction of therapeutic response to docetaxel in patients with breast cancer. Lancet. 2003;62(9381):362. doi: 10.1016/S0140-6736(03)14023-8. [DOI] [PubMed] [Google Scholar]
- 22.Cleator S, Tsimelzon A, Ashworth A, Dowsett M, Dexter T, Powles T, Hilsenbeck S, Wong H, Osborne CK, O’Connell P, et al. Gene expression patterns for doxorubicin (Adriamycin) and cyclophosphamide (cytoxan) (AC) response and resistance. Breast Cancer Res Treat. 2006;95(3):229–233. doi: 10.1007/s10549-005-9009-7. [DOI] [PubMed] [Google Scholar]
- 23.Symmans WF, Ayers M, Clark EA, Stec J, Hess KR, Sneige N, Buchholz TA, Krishnamurthy S, Ibrahim NK, Buzdar AU, Theriault RL, Rosales MF, Thomas ES, Gwyn KM, Green MC, Syed AR, Hortobagyi GN, Pusztai L. Total RNA yield and microarray gene expression profiles from fine-needle aspiration biopsy and core-needle biopsy samples of breast carcinoma. Cancer. 2003;97(12):2960–2971. doi: 10.1002/cncr.11435. [DOI] [PubMed] [Google Scholar]
- 24.Haffty BG, Yang Q, Reiss M, Kearney T, Higgins SA, Weidhaas J, Harris L, Hait W, Toppmeyer D. Locoregional relapse and distant metastasis in conservatively managed triple negative early-stage breast cancer. J Clin Oncol. 2006;24(36):5652–5657. doi: 10.1200/JCO.2006.06.5664. [DOI] [PubMed] [Google Scholar]
- 25.Rakha EA, El-Sayed ME, Green AR, Lee AH, Robertson JF, Ellis IO. Prognostic markers in triple-negative breast cancer. Cancer. 2007;109(1):25–32. doi: 10.1002/cncr.22381. [DOI] [PubMed] [Google Scholar]
- 26.Fan C, OhDS, Wessels L, Weigelt B, Nuyten DSA, Nobel AB, van’t Veer LJ, Perou CM. Concordance among gene-expression-based predictors for breast cancer. N Engl J Med. 2006;355(6):560–569. doi: 10.1056/NEJMoa052933. [DOI] [PubMed] [Google Scholar]
- 27.Keam B, Im SA, Kim HJ, Oh DY, Kim JH, Lee SH, Chie EK, Han W, Kim DW, Moon WK, et al. Prognostic impact of clinicopathologic parameters in stage II/III breast cancer treated with neoadjuvant docetaxel and doxorubicin chemotherapy: paradoxical features of the triple negative breast cancer. BMC Cancer. 2007;7:203. doi: 10.1186/1471-2407-7-203. [DOI] [PMC free article] [PubMed] [Google Scholar]
- 28.Estevez LG, Gradishar WJ. Evidence-based use of neoadjuvant taxane in operable and inoperable breast cancer. Clin Cancer Res. 2004;10(10):3249–3261. doi: 10.1158/1078-0432.CCR-03-0133. [DOI] [PubMed] [Google Scholar]
- 29.Kuerer HM, Newman LA, Smith TL, Ames FC, Hunt KK, Dhingra K, Theriault RL, Singh G, Binkley SM, Sneige N, et al. Clinical course of breast cancer patients with complete pathologic primary tumor and axillary lymph node response to doxorubicinbased neoadjuvant chemotherapy. J Clin Oncol. 1999;17(2):460. doi: 10.1200/JCO.1999.17.2.460. [DOI] [PubMed] [Google Scholar]
- 30.Chollet P, Amat S, Cure H, de Latour M, Le Bouedec G, Mouret-Reynier MA, Ferriere J, Achard J, Dauplat J, Penault-Llorca F. Prognostic significance of a complete pathological response after induction chemotherapy in operable breast cancer. Br J Cancer. 2002;8(86):1041–1046. doi: 10.1038/sj.bjc.6600210. [DOI] [PMC free article] [PubMed] [Google Scholar]
- 31.Gonzalez-Angulo AM, McGuire SE, Buchholz TA, Tucker SL, Kuerer HM, Rouzier R, Kau S-W, Huang EH, Morandi P, Ocana A, et al. Factors predictive of distant metastases in patients with breast cancer who have a pathologic complete response after neoadjuvant chemotherapy. J Clin Oncol. 2005;23(28):7098–7104. doi: 10.1200/JCO.2005.11.124. [DOI] [PubMed] [Google Scholar]
- 32.Wolmark N, Wang J, Mamounas E, Bryant J, Fisher B. Preoperative chemotherapy in patients with operable breast cancer: nine-year results from National Surgical Adjuvant Breast and Bowel Project B-18. J Natl Cancer Inst Monogr. 2001;30:96–102. doi: 10.1093/oxfordjournals.jncimonographs.a003469. [DOI] [PubMed] [Google Scholar]
- 33.Dawood S, Broglio K, Kau S-W, Islam R, Symmans WF, Buchholz TA, McGuire SE, Meric-Bernstam F, Cristofanilli M, Hortobagyi GN, et al. Prognostic value of initial clinical disease stage after achieving pathological complete response. Oncologist. 2008;13(1):6–15. doi: 10.1634/theoncologist.2007-0107. [DOI] [PubMed] [Google Scholar]
- 34.Guarneri V, Broglio K, Kau S-W, Cristofanilli M, Buzdar AU, Valero V, Buchholz T, Meric F, Middleton L, Hortobagyi GN, et al. Prognostic value of pathologic complete response after primary chemotherapy in relation to hormone receptor status and other factors. J Clin Oncol. 2006;24(7):1037–1044. doi: 10.1200/JCO.2005.02.6914. [DOI] [PubMed] [Google Scholar]